

Abstract
A great deal is known about the functional organization of cortical networks that mediate visual object processing in the adult. The current research is part of a growing effort to identify the functional maturation of these pathways in the developing brain. The current research used near-infrared spectroscopy to investigate functional activation of the infant cortex during the processing of featural information (shape) and spatiotemporal information (speed of motion) during the first year of life. Our investigation focused on two areas that were implicated in previous studies: anterior temporal cortex and posterior parietal cortex. Neuroimaging data were collected with 207 infants across three age groups: 3 to 6 months (Experiment 1), 7 to 8 months (Experiment 2), and 10 to 12 months (Experiments 3 and 4). The neuroimaging data revealed age-related changes in patterns of activation to shape and speed information, mostly involving posterior parietal areas, some of which were predicted and others that were not. We suggest that these changes reflect age-related differences in the perceptual and/or cognitive processes engaged during the task.
Keywords: object processing, temporal cortex, parietal cortex, functional brain activation, infants, near-infrared spectroscopy
I. Introduction
There is a substantial body of research suggesting that in the human brain, information about the spatiotemporal and featural properties of objects are processed by different cortical systems, similar to those first identified in the non-human primate (Mishkin, Ungerleider, & Macko, 1983; Ungerleider & Mishkin, 1982). The ventral system extends from the visual cortex through the temporal cortex and mediates processing of the featural attributes of objects. For example, areas in the primary visual cortex respond to specific features, such as lines, orientation, or color (Bartels & Zeki, 2000; Orban, Van Essen, & Vanduffel, 2004; Tootell, Tsao, & Vanduffel, 2003), whereas areas in the occipito-temporal cortex integrate these features and code objects as wholes, independent of visual perspective (Grill-Spector, 2003; Kourtzi & Kanwisher, 2001). Finally, more anterior areas in temporal cortex are important for higher level object processing, such as object recognition, identification, and naming (Devlon et al., 2002; Humphreys, Price, & Riddoch, 1999; Malach et al., 1995). The dorsal system extends from the visual cortex through the parietal cortex and mediates processing of the spatiotemporal attributes of objects. For example, area MT/V5 responds selectively to moving (as compared to static) stimuli and is sensitive to coherent motion of randomly distributed dots (Kolster, Peeters, & Orban, 2010; Murry, Olshausen, & Woods, 2003; Murry, Schrater, & Kersten, 2004; Paradis et al., 2000), whereas the angular gyrus mediates attention to and analysis of speed and path of object motion (Chambers, Payne, & Mattingley, 2007; Nagel, Sprenger, Hohagen, Binkofski, & Lencer, 2008) and the inferior parietal cortex mediates the extraction of 3-D object structure from coherent motion displays (Denys et al., 2004; Murray et al., 2003; Murray et al., 2004; Paradis et al., 2000; Peuskens et al., 2004). These and related findings (for reviews see Bell, Pasternak, & Undergerleider, 2013 and Orban, 2011) support the functional distinction proposed by Ungerleider and colleagues that the ventral stream is dedicated to the recognition, identification, and categorization of objects, or the “what” of objects, whereas the dorsal stream is dedicated to the processing of information about motion, depth, and location, or the “where” of objects (for an alternative viewpoint see Milner & Goodale, 1995). Claims about the functional specificity of these two pathways have been tempered somewhat, however, by evidence that ventral and dorsal cortical areas may be less specialized (or at least more interactive) than originally proposed (Borst, Thompson, & Kosslyn, 2011; Konen & Kastner, 2008; Kravitz, Kriegeskorte, & Baker, 2010; Zachariou, Klatzky, & Behrmann, 2013).
What has remained unspecified is the functional development of these visual object-processing pathways, largely because of a lack of neuroimaging techniques that can be used successfully with infants. With the introduction of functional near-infrared spectroscopy (fNIRS) into the experimental setting, however, developmental scientists now have the opportunity to investigate functional organization of the infant cortex. A growing number of studies (for a review see Lloyd-Fox, Blasi, & Elwell, 2010) have focused on identifying cortical substrates that mediate processing of distinct types of objects and/or object properties, many of which are theoretically important to cognitive and developmental neuroscientists. The outcome of such studies have allowed us to better understand how the human brain is functionally organized from the early days of life (Honda et al., 2010; Lloyd-Fox et al., 2009; Watanabe, Homae, Nakano, & Taga, 2008; Wilcox, Haslup, & Boas, 2010) and provide insight into how this might change with time and experience (Wilcox, Stubbs, Hirshkowitz, & Boas, 2012). Most relevant to the present research are studies that have focused on the cortical substrates that support infants’ emerging capacity to use featural and spatiotemporal information to track the identity of objects (Wilcox, Bortfeld, Armstrong, Woods, & Boas, 2009; Wilcox et al., 2012; Wilcox, Hirshkowitz, Hawkins, & Boas, 2014)
1.1 Object Individuation: Cortical Activation to Featural Differences
Several studies have investigated the cortical basis of infants’ capacity to use featural information to track the identity of objects through occlusion. In one group of studies (Wilcox et al., 2012), infants 3 to 5 months (M age = 5, 8) and 11 to 12 months (M age = 11, 21) were shown occlusion events (Figure 1) in which the objects that emerged successively from behind the screen differed in shape (green ball-green box), color (green ball-red ball) or were identical in appearance (green ball-green ball). The cortical areas targeted were anterior temporal, posterior temporal, posterior parietal, and occipital cortex. Two main findings relevant to the present research emerged. First, infants 3 to 5 months of age, who use shape but not color information to individuate objects (Wilcox, 1999), showed activation in the anterior temporal cortex when viewing the shape difference but not the color difference test event (see also Wilcox et al., 2010). It is not until 11 to 12 months, when infants first individuate-by-color (Wilcox, 1999; Wilcox et al., 2007), that infants showed activation in the anterior temporal cortex when viewing the different-color event. Neither age group showed activation in anterior temporal cortex when viewing the control (green ball-green ball) test event, an event that infants interpret as involving a single object that moves back and forth behind the screen (Wilcox, 1999). More recent studies (Wilcox et al., 2014) have revealed that infants younger than 11 to 12 months, if first primed to attend to color differences (i.e., given experiences that lead them to individuate-by-color), show activation in anterior temporal cortex to the color difference test event. These results provide converging evidence for the conclusion that in the infant the anterior temporal cortex is involved in the object individuation process.
Figure 1.

The shape difference, color difference, and control test events of Wilcox et al. (2012). Each cycle of the test event was 10 s and infants saw 2 complete cycles during each test trial.
The second main finding was of age-related changes in patterns of cortical activation to the different-shape event. One interesting characteristic of shape processing is that either ventral or dorsal cortical areas can mediate it, depending on the visual cues that give rise to object shape. For example, ventral areas extract object structure from contour whereas dorsal areas extract object structure from motion-carried information (Denys et al., 2004; Desimone, Schein, Moran, & Ungerlieder, 1985; De Yoe & Van Essen, 1988; Kraut et al., 1997; Livingstone & Hubel, 1987, 1988; Murray et al., 2004; Paradis et al., 2000; Peuskens et al., 2004). On the basis of these findings, one might expect younger infants, whose visual acuity is less well developed and hence depend more on motion-carried information to perceive object shape, to show greater activation in dorsal areas than older infants. Consistent with this hypothesis, Wilcox et al. (2012) found that infants 3 to 5 months, but not infants aged 11 to 12 months, evidence activation in posterior parietal cortex during the different-shape event. Recall that from the early months of life infants individuate on the basis of shape (Wilcox, 1999) and both 3- to 5-month-olds and 11- to 12-month-olds show activation in anterior temporal cortex to the shape difference test event (Wilcox et al., 2012). Yet, only the 3- to 5-month-olds show activation in posterior parietal cortex. (The younger infants did not show activation in the posterior parietal cortex to the control event, indicating that this response was specific to the shape difference and was not obtained for events involving moving objects more generally.) According to the visual acuity hypothesis, at what age would we expect infants to no longer show activation in parietal cortex to shape differences? Visual acuity matures significantly during the first 6 months of life, and by 7 to 8 months approaches that of an adult (Dobson & Teller, 1978; Norica & Tyler, 1985; Teller & Movshon, 1986). Hence, by this time we would expect infants to show cortical activation patterns similar to those of the older (and not the younger) infants. The current research tested this prediction.
1.2 Object Individuation: Cortical Activation to Spatiotemporal Discontinuities
Much less research has been conducted on the cortical basis of infants’ use of spatiotemporal information to individuate objects. In a recent study conducted with infants 5 to 7 months (Wilcox et al., 2010), participants were shown a speed discontinuity, path discontinuity, or control event (Figure 2). Previous behavioral studies conducted with 3.5- to 9.5-month-olds have demonstrated that infants interpret the speed discontinuity and path discontinuity event (but not the control event) as involving two distinct objects; that is, they use the spatiotemporal discontinuities to individuate the objects seen in the occlusion sequence (Schweinle & Wilcox, 2004; Wilcox & Schweinle, 2003). During the test session, neural activation, as measured by changes in HbO, was assessed at the same four locations as that of Wilcox et al. (2012). Two main findings emerged. First, the infants in the speed and path discontinuity conditions, but not the control condition, evidenced significant activation in the anterior temporal cortex. When spatiotemporal information embedded in the occlusion sequence signaled the presence of distinct objects, anterior temporal cortex was activated. These results provide converging evidence, using a different type of event – an event involving spatiotemporal discontinuities rather than featural differences – that the anterior temporal cortex mediates the individuation process in the infant. Second, the infants in the speed and path discontinuity conditions, but not the control condition, evidenced activation in the posterior parietal cortex. This finding supports prevailing hypotheses (Kaufman, Mareschal & Johnson, 2003; Johnson & Mareschal, 2003) that from an early age dorsal cortical areas mediate processing of the spatiotemporal properties of objects. The extent to which cortical responses to spatiotemporal discontinuities change during the first year has yet to be tested. In addition, a direct comparison of patterns of cortical activation to featural information, such as shape, and spatiotemporal information, such as speed of motion, in parietal and temporal cortex has not been done. Such a study would allow us to assess the specificity of responses in dorsal and ventral areas to these two sources of information.
Figure 2.
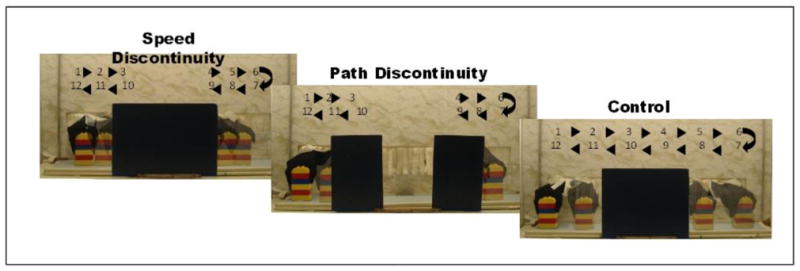
The speed-discontinuity, path-discontinuity, and control test events of Wilcox et al. (2010). Each cycle of the test event was 12 s and infants saw 2 complete cycles during each test trial. These are also the test events used in Experiment 4.
1.3 The Present Research
Recent fNIRS research has provided insight into the organization of cortical areas that mediate object processing in the human infant. At the same time, we are far from having a complete picture of the functional development of these cortical areas. The primary goal of the present research was to fill some gaps in what we know about the cortical structures that mediate infants’ use of featural and spatiotemporal information to individuate objects. We concentrated our investigation on cortical responses to a shape difference and a speed discontinuity event at three ages: 3 to 6 months, 7 to 8 months, and 10 to 12 months of age. These events and age groups were chosen for the following reasons. First, we sought converging evidence for the conclusion that 3- to 5-month-olds but not 11- to 12-month-olds show activation in posterior parietal cortex to a shape difference event. We also sought to identify the age at which parietal activation wanes in response to a shape difference event. Given that visual acuity is well developed by 7 to 8 months, we expected this age group, unlike the 3- to 6-month-olds, to show little, if any, activation in parietal cortex when viewing the different-shape event. Second, little is known about the neural circuits that mediate processing of spatiotemporal discontinuities in the infant. Cortical responses to spatiotemporal discontinuities have been explored in only one age group, 5- to 7-month-olds. Although we would expect infants of all ages to show activation in posterior parietal cortex (in response to the spatiotemporal discontinuity) and in the anterior temporal cortex (as the individuation process was engaged) to the speed discontinuity event, the extent to which this occurs remains an empirical question.
2. Experiments 1 to 3
Infants aged 3 to 6 months (Experiment 1), 7 to 8 months (Experiment 2), and 10 to 12 months (Experiment 3) were assigned to one of three conditions: shape difference, speed discontinuity, or control. Infants saw the test event appropriate for their condition (Figure 3) and neuroimaging data were collected.
Figure 3.

The shape difference, speed discontinuity, and control test events of Experiments 1 to 3. Each cycle of the test event was 12 s and infants saw 2 complete cycles during each test trial.
2.1 Method
2.1.1. Participants
In Experiment 1, infants’ aged 3 to 6 months (N = 51; 35 males and 16 females; M age = 5 months, 7 days, range = 3 months, 25 days to 6 months, 10 days) were assigned to a shape difference (n = 17), speed discontinuity (n = 17), or control (n = 17) condition. Thirty-two additional infants were tested but eliminated from the sample because of procedural problems (n = 5) or difficulty in obtaining an optical signal of sufficient quality because of motion, hair impediment, saturation, or noise (n = 27). Parents reported their infant’s race/ethnicity as Caucasian (n = 40), Hispanic (n = 5), Asian (n = 2), Black (n = 1), or of mixed race/other (n = 3). In Experiment 2, infants aged 7 to 8 months (N = 51; 31 males and 20 females; M age = 7 months, 24 days, range = 7 months, 1 day to 8 months, 28 days) were assigned to a shape difference (n = 17), speed discontinuity (n = 17), or control (n = 17) condition. Thirty additional infants were tested but eliminated from the sample because of procedural problems (n = 11) or difficulty in obtaining an optical signal of sufficient quality because of motion, hair impediment, saturation, or noise (n = 19). Parents reported their infant’s race/ethnicity as Caucasian (n = 34), Hispanic (n = 9), Asian (n = 1), Black (n = 1), or of mixed race/other (n = 6). In Experiment 3, infants aged 10 to 12 months (N = 52; 29 males and 23 females; M age = 11 months, 22 days, range = 10 months, 22 day to 12 months, 14 days) were assigned to a shape difference (n = 18), speed discontinuity (n = 17), or control (n = 17) condition. Twenty-nine additional infants were tested but eliminated from the sample because of procedural problems (n = 11) or difficulty in obtaining an optical signal of sufficient quality because of motion, hair impediment, saturation, or noise (n = 19). Parents reported their infant’s race/ethnicity as Caucasian (n = 40), Hispanic (n = 8), or of mixed race/other (n = 4). The attrition rates reported here are within the range of those typically reported in infant fNIRS studies (Lloyd-Fox et al., 2010).
For all age groups, infants were recruited from commercially produced lists, birth announcements in the local newspaper, and social media websites. Parents were offered $5 or a lab T-shirt for participation.
2.1.2. Task and Procedure
The same task and procedure were used for all three experiments. Infants sat in a Bumbo® seat in a quiet and darkened room and were presented with four trials of the test event appropriate for his/her condition (shape difference, speed discontinuity, or control) in a puppet-stage apparatus (Figure 3). Trained experimenters produced the test events live following a precise script. Each trial was 24 s in duration (each cycle of the test event was 12 s and infants saw 2 complete cycles during each test trial). Each test trial was preceded by a 10 s baseline interval during which time a curtain covered the front opening and stage of the apparatus. This interval was necessary because analysis of the optical imaging data requires baseline recordings of the measured intensity of refracted light. Previous studies indicate that 10 s is sufficient for blood volume to return to baseline levels (Wilcox et al., 2008, 2009). The curtain was raised to begin each test trial.
Looking behavior was electronically monitored by two independent and naïve observers who watched the infants through peepholes in cloth-covered frames attached to the side of the apparatus. Inter-observer agreement averaged 94%, 95%, and 94% for Experiments 1, 2, and 3, respectively.
Total duration of looking (i.e., cumulative looking) to each test trial was obtained. Test trials in which infants looked < 16 s were excluded from analysis. This minimum looking time criteria, which all of our previous studies have employed, ensures against group differences in attention to the events, which could potentially affect the hemodynamic response.
2.1.3 Instrumentation
The imaging equipment contained four fiber optic cables that delivered near-infrared light to the scalp of the participant (emitters), eight fiber optic cables that detected the diffusely reflected light at the scalp (detectors), and an electronic control box that served as the source of the near-infrared light and the receiver of the reflected light. The control box produced light at wavelengths of 690 nm, which is more sensitive to deoxygenated blood, and 830 nm, which is more sensitive to oxygenated blood, with two laser-emitting diodes (TechEn Inc). Laser power emitted from the end of the diode was 4 mW. Light was square wave modulated at audio frequencies of approximately 4 to 12 kHz. Each laser had a unique frequency so that synchronous detection could uniquely identify each laser source from the photodetector signal. Ambient illumination from the testing room did not interfere with the laser signals because environmental light sources modulate at a different frequency. Fiber optic cables were 2.5 mm in diameter and 5 m in length. Each emitter delivered both wavelengths of light and each detector responded to both wavelengths. The signals received by the electronic control box were processed and relayed to a DELL desktop computer. A custom computer program recorded and analyzed the signal.
Prior to the experimental session, infants were fitted with a custom-made headgear that secured the fiber optics to the scalp. Configuration of the sources and detectors within the headgear, placement of the sources and detectors on the infant’s head, and location of the nine corresponding channels are displayed in Figure 4. Source-detector separation was 2 cm. The headgear was not elastic so the distance between sources and detectors and between the four source-detector groups (O1, P3, T5, T3) remained fixed. The headgear was placed on the infant’s head using O1 as the primary anchor and T3 and P3 as secondary anchors.
Figure 4.
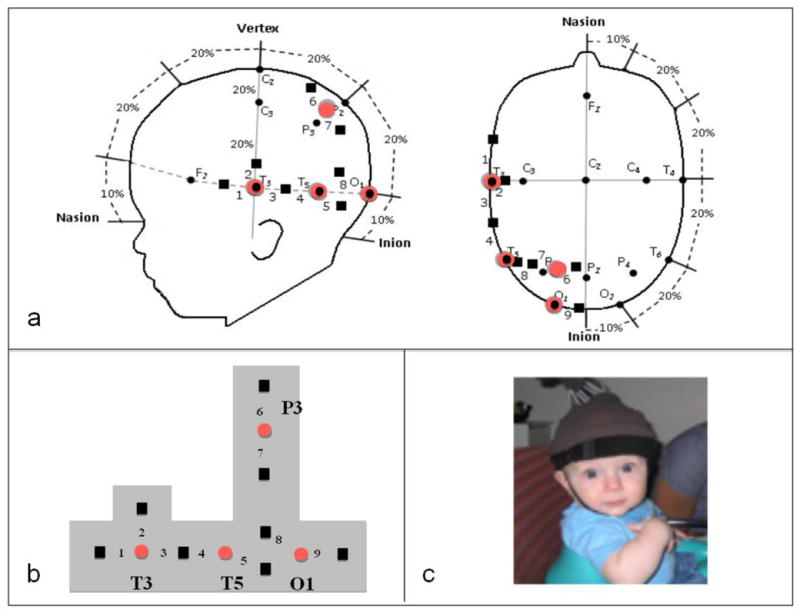
Configuration and placement of optodes. (a) Location of emitters (large red circles) and detectors (black squares) on the infant’s head in relation to the 10–20 International EEG system (small black circles). This configuration was identical to that used by Wilcox et al. (2010, 2012). Also represented are the nine corresponding channels from which data were collected. Each detector read from a single emitter except for the detector between T3 and T5, which read from both emitters. The light was frequency modulated to prevent “cross-talk”. (b) Configuration of the emitters (red circles) and detectors (black squares), and the nine channels, in the headgear. Emitter-detector distances were all 2 cm. (c) Infants sat in a supportive seat to restrain excess movement. An elasticized headband was slid onto the infant’s head and secured by a chinstrap.
Within each experiment, head circumference (HC) and A1 to A2 (A1-A2) measurements were averaged across infants and conditions to obtain a grand average. These measurements were missing for three infants in Experiment 2. An ANOVA was then performed on each of these head measurements with experiment as the between-subjects factor. For HC, the main effect of experiment was significant, F (2, 148) = 27.79, p < .001. Planned comparisons revealed that the mean HC of the infants in Experiment 1 (M = 43.42 cm, SD = 1.92 cm) differed significantly from that of Experiment 2 (M = 44.17 cm, SD = 1.45 cm), t (1, 97) = 2.17, p = .016 (one-tailed), and the mean HC of the infants in Experiment 2 differed significantly from that of Experiment 3 (M = 45.85 cm, SD = 1.66 cm), t (1, 98) = 5.77, p < .001 (one-tailed). For A1–A2, the main effect of experiment was significant, F (2, 148) = 4.68, p = .011. Planned comparisons revealed that the mean A1–A2 of the infants in Experiment 1 (M = 26.92 cm, SD = 2.28 cm) did not differ significantly from that of Experiment 2 (M = 26.69 cm, SD = 2.98 cm), t (1, 97) < 1, but that the mean A1–A2 of the infants in Experiment 2 differed significantly from that of Experiment 3 (M = 28.30 cm, SD = 3.26 cm), t (1, 98) = 2.57, p = .006 (one-tailed).
Although there were group differences in HC and A1–A2, keep in mind that we measured cortical activation from a limited area included within these distances. For example, between the youngest and oldest age group, the mean difference in distance between 01 and T3 (1/4 of the HC measurement) was 0.61 cm and the mean difference in distance between the headgear’s base to P3 (1/3 of the A1A2 measurement) was 0.46 cm. So, even though the mean head size between the age groups varied, the area of the skull (and underlying neural structures) affected was relatively small and, importantly, was smaller than the separation between each source and detector. An illustration of the reported age-related differences in optode placement can be found in Figure 6.
Figure 6.
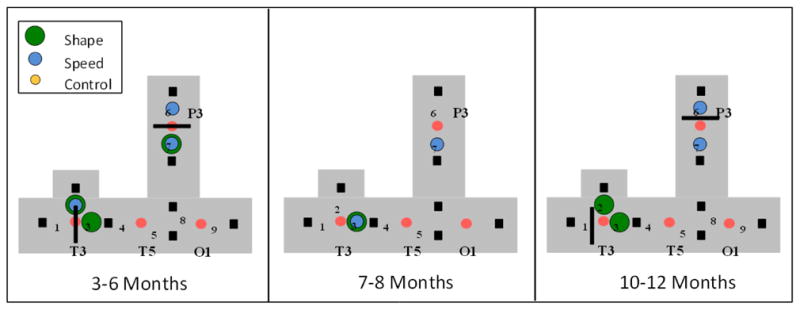
Patterns of neural activation obtained for the 3- to 6-month-olds (Experiment 1), 7- to 8-month-olds (Experiment 2), and 10- to 12-month-olds (Experiment 3). The colored dots (large green = shape difference, medium blue = speed discontinuity, small yellow = control) indicate that neural activation was obtained during that test event at that channel. The distance between sources and detectors remained fixed but mean head size varied by age (see text). The black lines indicate the actual location of T3, T5, and P3 (based on mean head measurements) for the younger and older infants.
2.1.4 Processing of the NIRS Data
The NIRS data were processed, for each detector and event condition separately, using a procedure identical to that of Wilcox et al. (2010, 2012). Briefly, the raw signals were acquired at the rate of 200 samples per second, digitally low-pass-filtered at 10 Hz, a principal components analysis was used to design a filter for systemic physiology and motion artifacts, and the data were converted to relative concentrations of oxygenated (HbO) and deoxygenated (HbR) blood using the modified Beer-Lambert law. Changes in HbO and HbR were examined using the following time epochs: the 2 s prior to the onset of the test event, the 24 s test event, and the 10 s following the test event. The mean optical signal from −2 to 0 s (baseline) was subtracted from the signals and other segments of the time epoch were interpreted relative to this zeroed baseline. Optical signals were averaged across trials and then infants for each event condition. Trials objectively categorized as containing motion artifacts (a change in the filtered intensity greater than 5% in 1/20 s during the 2 s baseline and the test event) were eliminated from the mean. On the basis of this criterion, and the looking time criteria (see above), 42 of 204 possible test trials (51 infants × 4 trials), 46 of 204 possible trials (51 infants × 4 trials), and 52 of 208 possible test trials (52 infants × 4 trials), were eliminated from data analysis for Experiments 1, 2, and 3, respectively. The number of missing trials (in relation to total number of trials), did not differ significantly for Experiments 1 and 2, z = −0.48 p = .631, or for Experiments 2 and 3, z = 1.46, p = .144 (two-tailed tests).
2.2 Results and Discussion
2.2.1 Looking Time Data
For ease in analysis and reporting, duration of looking data were averaged across trials and infants for each event condition and experiment, separately. A 3 × 3 ANOVA was conducted with experiment (1, 2, or 3) and event condition (shape difference, speed discontinuity, or control) as between-subjects factors. Neither the main effect of experiment, F (2, 145) < 1, or event condition, F (2, 145) = 2.36, p = .098, nor the interaction between the two, F (4, 145) = 1.52, p = .199, were significant, indicating that looking times did not vary reliably by age group or test event. Mean duration of looking data are presented in Table 1.
Table 1.
Mean (SD) during of looking (in sec) during the test events for Experiments 1 to 3.
| Shape Difference N = 52 |
Speed Discontinuity N = 51 |
Control N = 50 |
|
|---|---|---|---|
| Experiment 1 3–6 mos |
12.65 (6.68) | 12.46 (7.01) | 8.56 (4.97) |
| Experiment 2 7–8 mos |
10.13 (5.44) | 11.60 (6.47) | 10.48 (5.94) |
| Experiment 3 10–12 mos |
12.68 (6.14) | 11.03 (5.91) | 13.68 (5.49) |
2.2.2 Optical Imaging Data
On the basis of previous research (Wilcox et al., 2010, 2012) we expected to obtain activation in occipital cortex across experiments and event conditions. Preliminary analysis confirmed this hypothesis and, hence, channels 8 and 9 will not be considered further.
The primary goal of the present research was to identify the extent to which age-related changes in cortical activation would be obtained in response to a shape difference and speed discontinuity event. We focused our analyses on anterior temporal cortex (channels 2 and 3) and posterior parietal cortex (channels 6 and 7), as these are the channels that have been implicated in previous studies (Wilcox et al., 2010, 2012)
Hemodynamic response curves for Experiments 1 to 3 are presented in Figure 5. Relative changes in the hemodynamic response were averaged, for each event condition and channel, over 7 to 24 s. This interval was chosen because the first emergence of the object to the right of the screen began at 5 s and, allowing 2 s for the hemodynamic response to become initiated, hemodynamic changes should be detectable by 7 s and persist until the end of the trial at 24 s (see Wilcox et al., 2010 for supporting evidence). Statistical analyses were conducted on HbO responses, which are more robust than HbR responses (Strangman et al., 2003). However, HbR data are reported in the Appendix.
Figure 5.
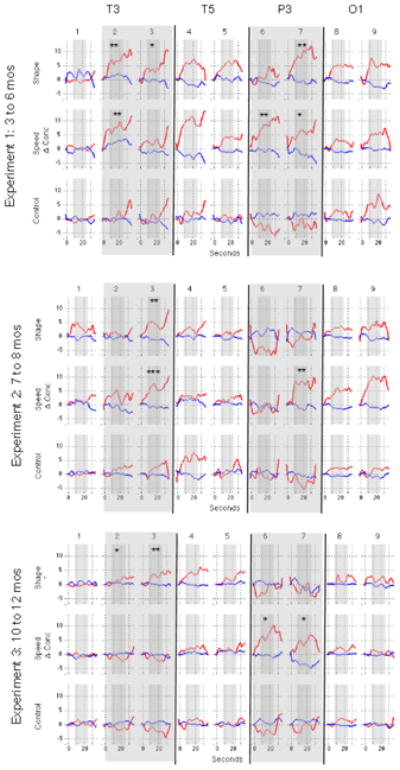
Hemodynamic response curves for Experiments 1 to 3 (smoothed for presentation purposes with a 0.5 Hz low-pass filter). Relative changes in HbO and HbR (red and blue lines respectively) during each test event at each of the nine channels are displayed for each of the three experiments, separately. Time is on the x-axis and hemodynamic changes in μM cm on the y-axis. The bold lines separate channels associated with each of the four 10–20 coordinates. In all three experiments, 1 to 24 s was the test event and 25 to 34 s was the silent pause (baseline). The hemodynamic response was averaged over 7 to 24 s, indicated by narrow grey shading. Our analyses focused on channels 2, 3, 6, and 7, as indicated by wide grey panels. Asterisks indicate M (SD) responses that differed significantly from baseline (* p < .05, ** p < .01, *** p < .001).
Two sets of analyses were conducted on HbO responses (Table 2). First, mean responses obtained at channels 2 and 3 (anterior temporal cortex) and channels 6 and 7 (posterior parietal cortex) were compared to 0. One-tailed tests were used because our predictions were one-directional; negative HbO responses are uncommon in this experimental context. Second, and more critical to our hypotheses, a one-way ANOVA was conducted for each channel to assess group differences in mean hemodynamic responses. When a significant main effect of event condition was obtained, follow-up comparisons using t-tests (one-tailed) were performed. A Benjamini-Hochberg (1995) procedure was used to correct for multiple comparisons. In a Benjamini-Hochberg procedure p values are rank ordered and new p values are calculated using p = (i/m)Q, where i = rank, m = total comparisons made, and Q = false discovery rate (.05).
Table 2.
Mean (SD) HbO responses during the test events for Experiments 1 to 3.
| Neural Region | T3 | T5 | P3 | O1 | |||||
|---|---|---|---|---|---|---|---|---|---|
| Channel | 1 | 2 | 3 | 4 | 5 | 6 | 7 | 8 | 9 |
| Experiment 1: 3–6 MOS | |||||||||
| Shape Difference n = 17 |
−0.0006 (0.003) | 0.0066 (0.010)** | 0.0034 (0.006)* | 0.0059 (0.009) | 0.0052 (0.006) | 0.0016 (0.010) | 0.0087 (0.012)** | 0.0047 (0.004) | 0.0054 (0.012) |
| Speed Discontinuity n = 17 |
0.0001 (0.004) | 0.0074 (0.011)** | 0.0023 (0.013) | 0.0099 (0.013) | 0.0037 (0.007) | 0.0076 (0.013)** | 0.0054 (0.012)* | 0.0027 (0.005) | 0.0051 (0.010) |
| Control n = 17 |
−0.0007 (0.004) | 0.0002 (0.004) | 0.00003 (0.006) | 0.0018 (0.007) | 0.0005 (0.005) | −0.0028 (0.010) | −0.0019 (0.009) | 0.0023 (0.004) | 0.0058 (0.006) |
| One-Way ANOVA |
F (1, 48) = 3.32* Shape vs. Control t (32) = 2.48**, d = 0.88 Speed vs. Control t (32) = 2.46**, d = 0.87 |
F (1, 48) < 1 |
F (1, 48) = 3.87* Shape vs. Control t (33) < 1 Speed vs. Control t (32) = 2.70**, d = 0.95 |
F (1, 48) = 3.97* Shape vs. Control t (32) = 2.85**, d = 1.01 Speed vs. Control t (32) = 2.00*, d=0.71 |
|||||
| Experiment 2: 7–8 MOS | |||||||||
| Shape Difference n = 17 |
0.0029 (0.009) | 0.0006 (0.005) | 0.0042 (0.007)** | 0.0021 (0.005) | 0.0007 (0.006) | −0.0047 (0.007) | −0.0012 (0.012) | 0.0028 (0.004) | 0.0035 (0.007) |
| Speed Discontinuity n = 17 |
0.0002 (0.003) | 0.0021 (0.007) | 0.0058 (0.006)*** | 0.0018 (0.008) | 0.0007 (0.009) | −0.0016 (0.008) | 0.0076 (0.012)** | 0.0034 (0.007) | 0.0083 (0.010) |
| Control n = 17 |
−0.0003 (0.002) | 0.0012 (0.004) | 0.0001 (0.006) | 0.0057 (0.017) | −0.00001 (0.009) | −0.0013 (0.010) | −0.0039 (0.015) | 0.0014 (0.007) | 0.0007 (0.006) |
| One-Way ANOVA | F (1, 48) < 1 |
F (1, 48) = 3.78* Shape vs. Control t (32) = 1.93*, d = 0.68 Speed vs. Control t (32) = 2.77**, d = 0.98 |
F (1, 48) < 1 |
F (1, 48) = 3.59* Shape vs. Control t (33) < 1 Speed vs. Control 1>t (32) = 2.45**, d = 0.87 |
|||||
| Experiment 3: 10–12 MOS | |||||||||
| Shape Difference n = 18 |
−0.0001 (0.002) | 0.0017 (0.004)* | 0.0034 (0.005)** | 0.0035 (0.004) | 0.0011 (0.007) | −0.0027 (0.006) | −0.0018 (0.007) | 0.0010 (0.003) | 0.0027 (0.0054) |
| Speed Discontinuity n = 17 |
−0.0002 (0.003) | −0.0016 (0.004) | −0.0018 (0.005) | 0.0014 (0.007) | 0.0012 (0.004) | 0.0074 (0.014)* | 0.0070 (0.015*) | 0.0020 (0.004) | 0.0010 (0.006) |
| Control n = 17 |
0.0006 (0.005) | −0.0014 (0.004) | −0.0019 (0.005) | 0.0014 (0.004) | 0.0001 (0.004) | −0.0028 (0.009) | −0.0009 (0.007) | 0.0015 (0.004) | 0.0001 (0.003) |
| One-Way ANOVA |
F (1, 49) = 4.09* Shape vs. Control t (33) = 2.54**, d = 0.88 Speed vs. Control t (32) < 1 |
F (1, 49) = 7.01** Shape vs. Control t (33) = 3.35***, d = 1.17 Speed vs. Control t (32) < 1 |
F (1, 49) = 5.88** Shape vs. Control t (33) < 1 Speed vs. Control t (33) = 3.35***, d = 1.17 |
F (1, 49) = 3.64* Shape vs. Control t (33) < 1 Speed vs. Control t (32) = 1.92*, d = 0.68 |
|||||
One sample t-tests (one-tailed) compared mean HbO responses (averaged over 7 to 24 s) to zero at each of the four channels of interest, indicated by grey shading. One-way ANOVAs tested for differences between groups at each of the four channels. Follow-up comparisons, using independent samples t-tests, were performed for channels in which a significant effect was obtained. In all cases * p < .05; ** p < .01; *** p < .001, one-tailed. A Benjamini-Hochberg (1995) procedure was used to correct for multiple comparisons (see text).
In Experiment 1, the infants in the shape-difference condition showed significant activation, relative to baseline, in the anterior temporal cortex (channels 2 and 3) and the posterior parietal cortex (channel 7), and the responses obtained in channels 2 and 7 differed significantly from those obtained in the control condition. The infants in the speed-discontinuity condition also showed significant activation, relative to baseline, in the anterior temporal cortex (channel 2) and the posterior parietal cortex (channels 6 and 7) cortex, and these responses differed significantly from those observed in the control condition. Note that there was a parietal channel (6) in the shape-difference conditional and a temporal channel (3) in the speed-discontinuity in with the activation was non-significant (as compared to baseline) and/or was not significantly different from the control event. It is possible that these results reflect greater noise (and hence less statistical power) at those channels than a meaningful difference between those and nearby channels. Also note that in a few channels (e.g., channels 2 and 3) the optical signal appears to increase rather than return to baseline during the baseline event. Recall that motion artifacts were identified and removed for the time period used for data processing (−2 to 24 s). Motion artifacts were not removed when they occurred post-event, as these do not affect data processing and would result in significant data loss (e.g., infants are more active during the baseline event). This is the same approach used in previous studies (Wilcox et al., 2005; Wilcox et al., 2007; Wilcox et al., 2010; Wilcox et al., 2012) and these studies have demonstrated that 10 s is sufficient for the hemodynamic response to return to baseline in this experimental context. In short, the apparent increase in the optical signal (or failure to decrease) during baseline is not due to a delay in recovery but to unfiltered motion.
In Experiment 2, the infants in the shape-difference condition showed activation in the anterior temporal cortex (channel 3) and this response differed significantly from that observed in the control condition. Activation was not obtained in the posterior parietal cortex, suggesting that by 7 to 8 months parietal cortex is not involved in the analysis of shape information when tracking moving occluded objects. The infants in the speed-discontinuity condition showed activation in the anterior temporal (channel 3) and the posterior parietal (channel 7), and these responses differed significantly from those observed in the control condition.
In Experiment 3, the infants in the shape-difference condition showed activation in anterior temporal cortex (channels 2 and 3) and these responses differed significantly from those obtained in the control condition. The infants in the speed-discontinuity condition showed activation in the posterior parietal cortex (channels 6 and 7), which differed significantly from control. Unexpectedly, they did not show activation in the anterior temporal cortex. We were puzzled by this pattern of results: from the early days of life infants are sensitive to motion-carried information and use spatiotemporal discontinuities to track the identity of objects as they move in and out of view (Aguair & Ballargeon, 2002; Spelke et al., 1995; Wilcox & Schweinle, 2002; Xu & Carey, 1996). So why did the older infants fail to show activation in anterior temporal cortex in response to the speed-discontinuity event? Would a similar result be obtained in response to other spatiotemporal discontinuities, such as discontinuity in path of motion, or is this result specific to speed of motion? To replicate this unusual pattern of results and address these questions we conducted Experiment 4.
3. Experiment 4
Infants aged 11 to 13 months were assigned to one of three conditions: speed discontinuity, path discontinuity, or control. The speed, path, and control test events were identical to those of Wilcox et al., 2010 (Figure 2). Infants saw the test event appropriate for their condition and neuroimaging data were collected.
3.1 Method
3.1.1. Participants
Infants aged 11 to 13 months (N = 53; 22 males and 31 females; M age = 12 months, 13 days, range = 11 months, 2 day to 13 months, 13 days) were assigned to a speed discontinuity (n = 17), path discontinuity (n = 18), or control (n = 18) condition. Twenty-nine additional infants were tested but eliminated from the sample because of crying (n = 2), procedural problems (n = 8) or difficulty in obtaining an optical signal of sufficient quality because of motion, hair impediment, saturation, or noise (n = 19). Parents reported their infant’s race/ethnicity as Caucasian (n = 42), Hispanic (n = 7), Black (n = 1), or of mixed race/other (n = 3).
3.1.2. Task and Procedure
The test events used in Experiment 4 are displayed in Figure 2. The procedure was identical to that of Experiments 1 to 3. Inter-observer agreement averaged 95%.
3.1.3 Instrumentation
Instrumentation was identical to that of Experiments 1 to 3. Head circumference and A1 to A2 measurements were averaged across infants and conditions to obtain grand averages. The average HC (M = 46.19, SD = 1.73) and A1–A2 (M = 28.00, SD = 2.52) measurements of the infants in Experiment 4 did not differ significantly from those of the infants in Experiment 3, both t (103) s < 1.
3.1.4 Processing of the NIRS Data
The NIRS data were processed in a manner identical to that of Experiments 1 to 3. On the basis of trial elimination criterion, 62 of 212 possible test trials (53 infants × 4 trials) were eliminated from data analysis. The number of missing trials (in relation to total number of trials), did not differ significantly for Experiments 3 and 4, z = 0.978 p = .328 (two-tailed).
3.2 Results and Discussion
3.2.1 Looking Time Data
Duration of looking data were averaged across trials and infants for each event condition and a one-way ANOVA was conducted with event condition as the between-subjects factor. The main effect of event condition, F (2, 50) < 1, was not significant, indicating that looking times, in secs, did not vary reliably by test event (speed M = 21.36, SD = 2.66; path M = 21.61, SD = 1.81; control M = 21.73, SD = 2.07).
3.2.2 Optical Imaging Data
Again, we focused our analyses on anterior temporal cortex (channels 2 and 3) and posterior parietal cortex (channels 6 and 7). Hemodynamic response curves for Experiments 4 are presented in Figure 7. Relative changes in the hemodynamic response were averaged for each event condition and channel over 7 to 24 s and analyses identical to those of Experiment 3 were conducted on HbO responses. HbR data are reported in the Appendix.
Figure 7.

Hemodynamic response curves for Experiment 4 (smoothed for presentation purposes with a 0.5 Hz low-pass filter). Relative changes in HbO and HbR (red and blue lines respectively) during each test event at each of the nine channels are displayed. Time is on the x-axis and hemodynamic changes in μM cm on the y-axis. The bold lines separate channels associated with each of the four 10–20 coordinates. Time 1 to 24 s was the test event and 25 to 34 s was the silent pause (baseline). The hemodynamic response was averaged over 7 to 24 s, indicated by narrow grey shading. Our analyses focused on channels 2, 3, 6, and 7, as indicated by wide grey panels. Asterisks indicate M (SD) responses that differed significantly from baseline (* p < .05, ** p < .01, *** p < .001).
Mean HbO responses were compared to 0 (Table 3). The infants in the speed-discontinuity condition showed significant activation in the posterior parietal cortex but not the anterior temporal cortex. The infants in the path-discontinuity condition showed activation in both the posterior parietal cortex and the anterior temporal cortex. The infants in the control condition failed to show activation in either the posterior temporal or posterior parietal cortex. In addition, one-way ANOVAs and follow-up comparisons were conducted for each of the four channels to test for group differences in mean hemodynamic responses (Table 3). The infants in the speed-discontinuity condition showed activation in the posterior parietal but not the anterior temporal cortex, replicating the results of Experimental 3. In comparison, the infants in the path-discontinuity condition showed activation in both the posterior parietal and the anterior temporal cortex.
Table 3.
Mean (SD) HbO responses during the test events for Experiment 4.
| Neural Region | T3 | T5 | P3 | O1 | |||||
|---|---|---|---|---|---|---|---|---|---|
| Channel | 1 | 2 | 3 | 4 | 5 | 6 | 7 | 8 | 9 |
| Experiment 4: 11–13 MOS | |||||||||
| Speed Discontinuity n = 17 |
0.0003 (0.004) | −0.0038 (0.009) | −0.0023 (0.008) | −0.00001 (0.006) | 0.0006 (0.005) | 0.0053 (0.015) | 0.0102 (0.018)* | 0.0015 (0.008) | 0.0072 (0.011) |
| Path Discontinuity n = 18 |
0.00008 (0.004) | 0.0051 (0.009)* | 0.0039 (0.007)* | 0.0021 (0.006) | 0.0034 (0.006) | 0.0041 (0.009)* | 0.0063 (0.012)* | 0.0051 (0.007) | 0.0034 (0.010) |
| Control n = 18 |
−0.0010 (0.004) | −0.0040 (0.007) | −0.0010 (0.005) | 0.0016 (0.007) | 0.0015 (0.007) | −0.0021 (0.013) | −0.0012 (0.009) | 0.0035 (0.008) | 0.0043 (0.007) |
| One-Way ANOVA |
F (1,50) = 6.35** Speed vs. Control t (33) < 1 Path vs. Control t (34) = 3.56**, d =1.22 |
F (1,50) = 4.43* Speed vs. Control t (33) < 1 Path vs. Control t (34) = 2.50**, d = 0.86 |
F (1,50) = 1.76 |
F(1,50) = 3.29* Speed vs. Control t (33) = 2.38*, d = 0.83 Path vs. Control t(34) = 2.17*, d = 0.74 |
|||||
One sample t-tests (one-tailed) compared mean HbO responses (averaged over 7 to 24 s) to zero at each of the four channels of interest, indicated by grey shading. One-way ANOVAs tested for differences between groups at each of the four channels. Follow-up comparisons, using independent samples t-tests, were performed for channels in which a significant effect was obtained. In all cases * p < .05 and ** p < .01, *** p < .001, one-tailed. A Benjamini-Hochberg (1995) procedure was used to correct for multiple comparisons (see text).
There are two possible interpretations for these results. One possibility is that infants aged 10 to 13 months interpret the speed-discontinuity and the path-discontinuity event as involving two objects but only the path-discontinuity event evokes activation in the anterior temporal cortex. That is, anterior temporal cortex is involved in one individuation context but not the other (reasons for this will be addressed later). An alternative interpretation is that infants aged 10 to 13 months perceive a path-discontinuity but not a speed-discontinuity event as involving two distinct objects, hence, activation is obtained in anterior temporal cortex in response to the path- but not the speed-discontinuity event. We will consider the latter explanation first. There is a large body of research demonstrating that infants 3 to 12 months individuate on the basis of a discontinuity in path of motion (e.g., Aguair & Ballargeon, 2002; Spelke, Kestenbaum, Simon, & Wein, 1995; Wilcox & Schweinle, 2002; Xu & Carey, 1996). There is also evidence that infants 3.5 to 9.5 months individuate on the basis of a discontinuity in speed of motion (Schweinle & Wilcox, 2004; Wilcox & Schweinle, 2003). Given that infants older than 9.5 months have not been tested it is possible, albeit unlikely, that older infants do not individuate on the basis of speed of motion. To rule out this possibility, a behavioral study using a violation-of-expectation procedure similar to that of Wilcox and Schweinle (2003) was conducted with older infants.1
3.2.3. Behavioral Study
Infants aged 11 to 13 months (N = 36; 17 males and 19 females; M age = 12 months, 19 days, range = 11 months, 2 days to 13 months, 13 days) were assigned to one of three conditions: speed discontinuity (n = 12), path discontinuity (n = 12) or control (n = 12). Infants were tested using a two-phase test event. In the initial phase, infants saw one full cycle of the event (speed discontinuity, path discontinuity, or control) appropriate for their condition. These events were identical to those of Figure 2 except the objects were a solid green color, rather than striped. The occluder was then lowered to the floor of the apparatus and in the final phase infants saw a single object gently “dancing” at the left end of the platform (the area behind the screen was revealed as empty). The final phase of the test trial ended when the infant either (a) looked at the display for a maximum of 60 cumulative sec, or (b) looked away for 1 sec after looking a minimum of 5 cumulative sec. Infants saw four test trials. If infants interpret the event as involving two objects they should show prolonged looking to the one-object display (i.e., the infants in the speed- and path-discontinuity condition should look reliably longer at the final display than the infants in the control condition). Previous studies have shown that in this task, and/or simplified versions of this task, infants 4.5 to 9.5 months show prolonged looking to one-object final display after viewing the speed-discontinuity as compared to the control event (Schweinle & Wilcox, 2004; Wilcox & Schweinle, 2003).
Infants’ duration of looking during the final phase of the test event was averaged across the four test trials and a one-way ANOVA was performed on mean looking times with event condition as the between-subjects factor. The main effect of condition was significant, F (2, 33) = 4.34, p = .021, η2 = .21. Planned comparisons revealed that the infants’ in the speed-discontinuity condition (M = 17.76, SD = 7.87) looked reliably longer at the final one-object display than the infants in the control condition (M = 11.05, SD = 4.04), t (1, 22) = 2.63, p = .008 (one-tailed), Cohen’s d = 1.07 (Cohen, 1977). The infants’ in the path-discontinuity condition (M = 15.34, SD = 4.18) also looked reliably longer at the final one-object display than the infants in the control condition, t (1, 22) = 2.55, p = .009 (one-tailed), Cohen’s d = 1.04. These results suggest that the infants in the speed-discontinuity and path-discontinuity conditions, but not the control condition, interpreted the occlusion sequence as involving two objects and found the presence of only a single object behind the lowered screen unexpected. Hence, the unusual pattern of fNIRS results obtained with the older infants (i.e., anterior temporal activation in response to the path-discontinuity but not the speed-discontinuity event) is better explained by age-related differences in the cortical areas involved in the individuation process during these events than failure to individuate the objects in the speed discontinuity condition. We will discuss this in more detail in the General Discussion.
4. General Discussion
The present research investigated functional organization of object processing areas at three different ages during the first year. Age-related changes in patterns of cortical activation to featural (shape) and spatiotemporal (speed of motion) information were observed. Although some of the age-related changes in activation patterns were predicted, others were not. The main findings are discussed below.
4.1. Shape Processing
Neural activation was obtained in the posterior parietal cortex in response to a shape difference event in the youngest age group (3- to 6-month-olds) but not the older two age groups (7- to 8-month-olds and 10- to 12-month-olds). In contrast, activation was not obtained in the posterior parietal cortex in response to the control event in any age group. These results provide converging evidence for the conclusion that early, but not late, in the first year posterior parietal cortex is involved in the analysis of object shape (Wilcox et al., 2012). These results also reveal, for the first time, that by 7 months this involvement wanes. Despite age-related changes in posterior parietal activation, anterior temporal activation was obtained in all three age groups during the shape difference, and the magnitude of the response differed significantly from that obtained in the control condition. That is, regardless of how shape was processed (as evidenced by different patterns of activation in the parietal cortex) individuation-by-shape was mediated by the anterior temporal cortex.
There are several possible explanations for why posterior parietal cortex is engaged in shape processing in the youngest, but not the two older, age groups. One possible explanation for this pattern of results, and the one offered earlier, is that younger infants, whose visual acuity is relatively poor, are more likely to depend on motion-carried information to extract object shape than older infant. As a result, younger infants are more likely to show activation in dorsal areas during processing of the different-shape event. This explanation is consistent with evidence that visual acuity develops significantly during the first 6 months (Dobson & Teller, 1978; Norica & Tyler, 1985; Teller & Movshon, 1986) and that by the second half of the first year infants are less reliant on motion-carried information for the analysis of object form (Arterberry, Craton, & Yonas, 1993; Kellman & Arterberry, 2006). This interpretation is also consistent with fMRI studies conducted with adults showing that posterior parietal areas are activated when motion-carried information defines object shape but not when shape is extracted from static contour alone (Murray et al., 2004; Peuskens et al., 2004). In the shape difference event, shape could be extracted from contour (the objects sat stationary for 1 s after each emergence from behind the screen and/or static “snapshots” could be extracted at any time during which the objects were visible) or from motion-carried information (change in optic flow as the objects moved along the horizontal plane). Infants with poor visual acuity would quite naturally depend more on the latter to discriminate between the form of the object seen emerging, successively, to the left and right sides of the occluding screen. However, there are alternative explanations for the pattern of results obtained in response to object shape that should be considered.
One alternative explanation focuses on age-related changes in the extent to which shape processing is “embodied” rather than age-related changes in visual acuity. There is evidence that when adults are asked to retrieve information about an object’s shape or size, areas in the parietal cortex are activated (Oliver & Thompson-Schill, 2003; Thompson-Schill, 2003). Thompson-Schill and her colleagues have suggested that coding of information about form features is closely linked to possible actions on objects. Adults frequently engage in coordinated visual and manual exploration of objects and even when physical manipulation of objects is not possible, we often imagine that we are doing so (Oliver, Geiger, Lewandowski, & Thompson-Schill, 2009; Michelon, Vettel, & Zacks, 2005; Richter et al., 2000). Indeed, a prominent and long-standing theory of object perception maintains that the primary function of vision is to provide information about object affordances; that is, possible ways that we can act on objects (Gibson, 1979). In the developmental sciences, there is a substantial body of research demonstrating an intimate link between perception, action, and cognition in the developing infant (e.g., Campos et al., 2000; Corbetta, 2009; Sommerville & Woodward, 2010). One theme that runs through much of this work is the importance of coordinated visual and manual exploration of objects on infants’ learning about the physical properties of those objects (Möhring & Frick, 2013; Needham, 2002; Soska, Adolph, & Johnson, 2010; Wilcox, Woods, Chapa, & McCurry, 2007). Some infant researchers (Kaufman, Mareschal & Johnson, 2003; Mareschal & Johnson, 2003) have hypothesized that when infants are visually presented with objects that could potentially be acted upon (such as 3D objects moving across a near-by stage in real space and time), the processing of object properties that could influence action on those objects, such as shape, will activate dorsal areas in the cortex. This hypothesis draws on the idea that the functional distinction between ventral and dorsal areas may be better (or at least as aptly) described as the difference between the “what” and “how” of objects than the “what” and “where” of objects (Goodale, Milner, Jakobson, & Carey, 1991; Milner & Goodale, 1995). In this case “how” refers to guidance of motor behaviors relevant to the spatial properties (e.g., location or form) of objects. Although the infant hypothesis has not been directly tested, the fNIRS data we obtained here is not inconsistent with this hypothesis. What is difficult to reconcile, however, is why only the youngest age group showed activation in parietal cortex during the shape difference event. Why would shape processing activate an action-perception circuit in the younger but not the older infants? Is shape perception and motor planning more tightly linked in younger than older infants? If so, why would this be the case? These are all intriguing questions worthy of pursuit. To answer such questions, future research will need to systematically explore the extent to which parietal activation is dependent on whether objects are perceived as “actionable” and the conditions under which this occurs.
Another alternative interpretation for parietal activation observed in the younger infants focuses on age-related changes in the extent to which shape processing engages spatial analysis of the objects. One could argue that shape discrimination invokes spatial processing and, hence, parietal activation (c.f., Oliver & Thompson-Schill, 2003). For example, forming a shape perception could potentially involve analysis of the spatial units that together form a composite shape and/or comparison of two shape percepts might require an analysis of the space those objects occupy. (The objects in the present studies were similar in size so the analysis would be one of spatial configuration rather than spatial extent.) According to this interpretation, younger infants are more likely than older infants to attend to and analyze individual spatial components of objects. We find this hypothesis less compelling, for a couple of reasons. First, there is a large body of research indicating that ventral areas are activated during object recognition and identification tasks, even when the task involves shape discrimination (Gauthier et al., 2002; Oliver & Thompson-Schill, 2003; Wilson & Farah, 2006; Zacks, Vettel, & Michelon, 2003). Unless shape processing is dependent on motion-carried information or related to action on the object, dorsal areas are not typically involved. Second, a spatial analysis approach would involve a detailed analysis of the spatial units that together, form the object, rather than a holistic analysis of object shape. There is a large body of research indicating that younger infants are more likely to attend to global rather than local components of objects (Colombo, Kapa, & Curtindale, 2010), which is inconsistent with an analysis-of-specific-components hypothesis.
4.2. Speed of Motion: Age-Related Changes
Consistent with our predictions that throughout the first year dorsal areas would mediate processing of spatiotemporal information, activation was obtained in the parietal cortex in response to the speed-discontinuity event in all three age groups. This outcome replicates findings obtained with 5- to 7-month-olds (Wilcox et al., 2010) and extends it to younger and older infants. Also consistent with our predictions, the two younger age groups showed activation in anterior temporal cortex in response to the speed-discontinuity event. Unexpectedly, however, the oldest group tested, 10- to 12-month-olds, did not show activation in the anterior temporal cortex in response to the speed-discontinuity event. A behavioral study ruled out the possibility that older infants fail to use a speed discontinuity to individuate objects. (Previous behavioral studies (Schweinle & Wilcox, 2004; Wilcox & Schweinle, 2003) had already established that younger infants interpret a speed-discontinuity event as involving two objects, but older infants had not been tested.) Finally, an additional fNIRS study revealed that the pattern of results obtained in response to the speed-discontinuity event in the older infants does not generalize to other spatiotemporal discontinuities. In Experiment 4, 11- to 13-month-olds showed activation in posterior parietal and anterior temporal cortex in response to a path discontinuity event, but (replicating the findings of Experiment 3) showed activation in posterior parietal cortex, only, to the speed discontinuity event.
How do we explain this unexpected pattern of results? A more detailed analysis of the events, and the processes they evoke, may provide some insight. The extent to which infants’ and adults’ experience physical objects as entities that persist across space and time, even when perceptual contact is lost and then regained, is determined by a number of factors. Two well established principles that guide infants’ and adults’ apprehension of object identity are continuity of motion and smoothness of motion (Spelke et al., 1995). According to the continuity principle, physical objects move on connected paths; they do not jump in space and time. Hence, a gap in path of motion necessarily signals the presence of two objects. This is an either/or judgment. It is not surprising, then, that throughout the first year infants, like adults, reliably interpret a path discontinuity event like that of Experiment 4 as involving two objects (Aguair & Ballargeon, 2002; Spelke et al., 1995; Wilcox & Schweinle, 2002; Xu & Carey, 1996). In comparison, according to the smoothness principle, objects undergo linear motion at a constant speed in the absence of forces. It is this principle that leads adults and infants to interpret an event in which an object disappears behind one edge of a screen and immediately appears at the other edge, as involving two objects. However, a speed discontinuity event does not always (and unambiguously) signal the presence of objects (Michotte, Thines, & Crabbe, 1991). When viewing occlusion sequences (or events perceived as occlusion sequences), the extent to which adults interpret the event as involving two objects depends on the width of the occluding surface, the speed at which the objects move when visible, and/or the occlusion interval. The percept of two objects is strongest when the occluding screen is wide, the objects move at a more moderate pace when visible, and the reappearance at the opposite side of the occluding surface is immediate (Michotte et al., 1963). In sum, when interpreting a speed discontinuity event, adults consider a number of factors. In contrast, when interpreting a path discontinuity event involving two screens only a single factor need be considered: whether the object traveled the path between the two screens.
Drawing on this analysis, one possible explanation for the different pattern of fNIRS results obtained with the 3- to 6-month olds and 7- to 8-month-olds, as compared to the 10- to 13-month-olds, is one of age-related differences in the processes evoked or, more accurately the number of factors infants consider, when viewing the speed discontinuity event. Perhaps the two younger age groups considered a single factor: occlusion interval (immediate reappearance = two objects). In contrast, the older infants may have considered a number of factors: speed of motion, occlusion interval, and width of the screen (immediate reappearance after occlusion behind a wide screen in conjunction with objects moving at a moderate rate prior to occlusion = 2 objects). According to this interpretation, a more detailed analysis of the event involving a number of factors evoked a different cortical circuit, one that does not include anterior temporal cortex. Although speculative, this interpretation is consistent with current research and theory in the developmental sciences (Baillargeon, Li, Gernter, & Wu, 2011; Baillargeon et al., 2012). Baillargeon and her colleagues have reported that young infants often attend to a single factor when interpreting physical events, usually a factor that is the most reliable predictor of an event outcome. However, with time and experience infants learn to consider a number of factors that could, potentially, influence the outcome of the event. Perhaps the activation of distributed networks that involve different cortical areas support these changes in the way infants interpret physical events.
4.3 Caveats
The current research reports measurements from two cortical areas using a unilateral (left) probe. Hence, we lack information about the contribution of other cortical areas to object processing during these tasks. For example, we suspect that some temporal areas are selectively sensitive to the featural, as compared to the spatiotemporal, properties of objects. In addition, it is possible that physical objects (like those used in the present research) elicit greater left than right hemisphere activation. Given the complex nature of object processing, and the extent to which the mature brain is functionally specialized, it will be important for future research to include greater coverage of cortical areas in order to identify early developing circuitry.
We also offer caution in our interpretation of age-related changes in patterns of cortical activation. It is possible that when activation is observed in one cortical area in one age group but not another, activation patterns have shifted laterally to cortical areas outside of the region sampled. Or, perhaps activation has moved deeper into the cortical folds or to cortical depths below the sensitivity of fNIRS. Although it is difficult to imagine this as an explanation for the lack of activation in anterior temporal cortex to the speed-discontinuity event (activation was obtained in anterior temporal cortex to the path-discontinuity and shape-difference event), it is a potential explanation for the lack of sensitivity to shape information in the parietal cortex in the older infants. Although, on the basis of the research reviewed, we believe this a less viable explanation than those offered in section 4.1, such an explanation does need to be considered.
4.4 Final Comments
The present results suggest that the functional network of cortical areas involved in tracking objects through occlusion is not static, but instead changes during the first year of life. We have suggested that at least some of these changes reflect age-related differences in the way that infants process information. For example, parietal activation during shape processing in younger but not older infants may reflect greater dependency on motion-carried information to extract object shape or greater reliance on action-related information in the analysis of object shape. In addition, different patterns of activation obtained during individuation-by-speed may reflect age-related changes in the process by which infants solve the individuation problem. Future research will be aimed at localizing object processing areas within a larger cortical circuit, including more areas of temporal and parietal cortex, as well as determining the specificity of these areas in the developing brain.
Supplementary Material
Highlights.
We examined parietal and temporal activation during shape and speed processing.
Parietal cortex was activated during shape processing in young but not old infants.
Anterior temporal cortex was activated during object individuation in most cases.
Temporal cortex was not activated during individuation-by-speed in older infants.
Acknowledgments
We thank Marisa Biondi, Tracy Smith Brower, Jennifer Armstrong Haslup, Melissa Wallace Klapuch, Mariam Massoud, Jennifer Moore Norvell, Jessica Stubbs, Kayla Boone Upshaw, Lesley Wheeler, and the staff of the Infant Cognition Lab at Texas A&M University for help with data collection and management, and the infants and parents who so graciously participated in the research. This work was support by grants BCS-0642996 and R01-HD057999 to TW and grant P41-RR14075 to DAB. DAB is an inventor on a technology licensed to TechEn, a company whose medical pursuits focus on noninvasive, optical brain monitoring. DAB’s interests were reviewed and are managed by Massachusetts General Hospital and Partners HealthCare in accordance with their conflict of interest policies.
Footnotes
The current experiments were designed to minimize group differences in looking time (i.e., a computer controlled procedure was used and trials with short looking times were excluded from analysis). Hence, in order to assess the extent to which infants’ interpret a speed- and path-discontinuity event, but not a control event, as involving two objects a different experimental procedure was required. The most commonly used procedure to investigate physical reasoning in infants is a violation-of-expectation paradigm, which was used in the behavioral study.
Publisher's Disclaimer: This is a PDF file of an unedited manuscript that has been accepted for publication. As a service to our customers we are providing this early version of the manuscript. The manuscript will undergo copyediting, typesetting, and review of the resulting proof before it is published in its final citable form. Please note that during the production process errors may be discovered which could affect the content, and all legal disclaimers that apply to the journal pertain.
Contributor Information
Teresa Wilcox, Department of Psychology, Texas A&M University, College Station, TX 77843.
Laura B. Hawkins, Department of Psychology, Texas A&M University, College Station, TX 77843
Amy Hirskkowitz, Department of Psychology, Texas A&M University, College Station, TX 77843.
David A. Boas, Massachusetts General Hospital, Harvard Medical School, Charlestown, MA 02129
References
- Aguiar A, Baillargeon R. Developments in young infants’ reasoning about occluded objects. Cognitive Psychology. 2002;45:267–336. doi: 10.1016/s0010-0285(02)00005-1. [DOI] [PMC free article] [PubMed] [Google Scholar]
- Arterberry ME, Craton LG, Yonas A. Infants’ sensitity to motion-carried information for depth and object properties. In: Granrud C, editor. Visual perception and cognition in infancy: Twenty-third Carnegie Mellon symposium on cognition. Hillsdale, NJ: Lawrence Erlbaum Associates; 1993. [Google Scholar]
- Baillargeon R, Li J, Gertner Y, Wu D. How do infants reason about physical events? In: Goswami U, editor. The Wiley-Blackwell handbook of childhood cognitive development. 2. Malden, MA: Wiley-Blackwell; 2011. pp. 11–48. [Google Scholar]
- Baillargeon R, Stavans M, Wu D, Gertner Y, Setoh P, Kittredge AK, Bernard A. Object individuation and physical reasoning in infancy: An integrative account. Language Learning and Development. 2012;8(1):4–46. doi: 10.1080/15475441.2012.630610. [DOI] [PMC free article] [PubMed] [Google Scholar]
- Bartels A, Zeki S. The architecture of the colour centre in the human visual brain: New results and a review. European Journal of Neuroscience. 2000;12:172–193. doi: 10.1046/j.1460-9568.2000.00905.x. [DOI] [PubMed] [Google Scholar]
- Bell AH, Pastermal T, Ungerlieder LG. Ventral and dorsal processing streams. In: Chalupa L, Werner J, editors. The new visual sciences. MIT Press; Cambridge, MA: 2013. [Google Scholar]
- Benjamini Y, Hochberg Y. Controlling the false discovery rate - A practical and powerful approach to multiple testing. Journal of the Royal Statistical Society. Series B Methodological. 1995;57(1):289–300. [Google Scholar]
- Borst G, Thompson W, Kosslyn S. Understanding the dorsal and ventral systems of the human cerebral cortex: Beyond dichotomies. The American Psychologist. 2011;66(7):624–632. doi: 10.1037/a0024038. [DOI] [PubMed] [Google Scholar]
- Campos JJ, Anderson DI, Barbu-Roth MA, Hubbard EM, Hertenstein MJ, Witherington D. Travel broadens the mind. Infancy. 2000;1(2):149–219. doi: 10.1207/S15327078IN0102_1. [DOI] [PubMed] [Google Scholar]
- Chambers CD, Payne JM, Mattingley JB. Parietal disruption impairs reflexive spatial attention within and between sensory modalities. Neuropsychologia. 2007;45:1715–24. doi: 10.1016/j.neuropsychologia.2007.01.001. [DOI] [PubMed] [Google Scholar]
- Cohen J. Statistical Analysis for the Behavioral Sciences. Academic Press; NewYork: 1977. [Google Scholar]
- Colombo J, Kapa L, Curtindale . Varieties of Attention in Infancy. In: Oakes LM, Cashon CH, Casasola M, Rakison DH, editors. Infant perception and cognition: Recent advances, emerging theories, and future directions. New York: Oxford University Press; 2010. pp. 3–26. [Google Scholar]
- Corbetta D. Brain, body, and mind: Lessons from infant development. In: Spencer M, Thomas, McClelland J, editors. Toward a unified theory of development: Connectionism and dynamic systems theory re-considered. Oxford University Press; 2009. [Google Scholar]
- Denys K, Vanduffel W, Fize D, Nelissen L, Peuskens H, Van Essen D, Orban GA. The processing of visual shape in the cerebral cortex of human and nonhuman primates: A functional magnetic resonance imaging study. The Journal of Neuroscience. 2004;24:2551–2565. doi: 10.1523/JNEUROSCI.3569-03.2004. [DOI] [PMC free article] [PubMed] [Google Scholar]
- Devlin JT, Russell RP, Davis MH, Price CJ, Moss HE, Fadili MJ, Tyler LK. Is there an anatomical basis for category-specificity? Semantic memory studies in PET and fMRI. Neuropsychologia. 2002;40:54–75. doi: 10.1016/s0028-3932(01)00066-5. [DOI] [PubMed] [Google Scholar]
- Desimone R, Schein S, Moran J, Ungerleider L. Contour, color and shape analysis beyond the striate cortex. Vision Research. 1985;25:441–452. doi: 10.1016/0042-6989(85)90069-0. [DOI] [PubMed] [Google Scholar]
- De Yoe EA, Van Essen DC. Concurrent processing streams in monkey visual cortex. Trends in Neuroscience. 1988;11:219–226. doi: 10.1016/0166-2236(88)90130-0. [DOI] [PubMed] [Google Scholar]
- Dobson V, Teller DY. Visual acuity in human infants: A review and comparison of behavioral and electrophysiological studies. Vision Research. 1978;18(11):1469–1483. doi: 10.1016/0042-6989(78)90001-9. [DOI] [PubMed] [Google Scholar]
- Gauthier I, Hayward WG, Tarr MJ, Anderson AW, Skudlarksi P, Gore JC. BOLD activity during mental rotation and viewpoint-dependent object recognition. Neuron. 2002;34:161–171. doi: 10.1016/s0896-6273(02)00622-0. [DOI] [PubMed] [Google Scholar]
- Gibson JJ. The ecological approach to visual perception. Boston, MA: Houghton Mifflin; 1979. [Google Scholar]
- Goodale MA, Milner AD, Jakobson LS, Carey DP. A neurological dissociation between perceiving objects and grasping them. Nature. 1991;349:154–156. doi: 10.1038/349154a0. [DOI] [PubMed] [Google Scholar]
- Grill-Spector K. The neural basis of object perception. Current Opinion in Neurobiology. 2003;13:159–166. doi: 10.1016/s0959-4388(03)00040-0. [DOI] [PubMed] [Google Scholar]
- Honda Y, Nakato E, Otsuka Y, Kanazawa S, Kojima S, Yamaguchi MK, Kakigi R. How do infants’ perceive scrambled faces?: A near-infrared spectroscopic study. Brain Research. 2010;1308:137–146. doi: 10.1016/j.brainres.2009.10.046. [DOI] [PubMed] [Google Scholar]
- Humphreys GW, Price CJ, Riddoch MJ. From objects to names: A cognitive neuroscience approach. Psychological Research. 1999;62:118–130. doi: 10.1007/s004260050046. [DOI] [PubMed] [Google Scholar]
- Kaufman J, Mareschal D, Johnson M. Graspability and object processing in infants. Infant Behavior and Development. 2003;26(4):516–528. [Google Scholar]
- Kellman PJ, Arterberry ME. Infant visual perception. In: Kuhn D, Siegler RS, Damon W, editors. Handbook of child psychology: Vol. 2. Cognition, perception, and language. 6. Hoboken, NJ: Wiley; 2006. pp. 109–160. [Google Scholar]
- Kolster H, Peeters R, Orban GA. The retinotopic organization of the human middle temporal area mt/v5 and its cortical neighbors. The Journal of Neuroscience. 2010;30(29):9801–9820. doi: 10.1523/JNEUROSCI.2069-10.2010. [DOI] [PMC free article] [PubMed] [Google Scholar]
- Konen CS, Kastner S. Two hierarchically organized neural systems for object information in human visual cortex. Nature Neuroscience. 2008;11(2):224–231. doi: 10.1038/nn2036. [DOI] [PubMed] [Google Scholar]
- Kourtzi Z, Kanwisher N. Representation of perceived object shape by the human lateral occipital complex. Science. 2001;293:1506–1509. doi: 10.1126/science.1061133. [DOI] [PubMed] [Google Scholar]
- Kraut M, Hart J, Soher BJ, Gordon B. Object shape processing in the visual system evaluated using functional MRI. Neurology. 1997;48:1416–1420. doi: 10.1212/wnl.48.5.1416. [DOI] [PubMed] [Google Scholar]
- Kravitz DJ, Kriegeskorte CI, Baker N. High-level visual object representations are constrained by position. Cerebral Cortex. 2010;20(12):2916–2925. doi: 10.1093/cercor/bhq042. [DOI] [PMC free article] [PubMed] [Google Scholar]
- Livingstone M, Hubel D. Psychophysical evidence for separate channels for the perception of form, color, movement, and depth. Journal of Neuroscience. 1987;7:3416–3468. doi: 10.1523/JNEUROSCI.07-11-03416.1987. [DOI] [PMC free article] [PubMed] [Google Scholar]
- Livingstone M, Hubel D. Segregation of form, color, movement, and depth: Anatomy, physiology, and perception. Science. 1988;240:740–749. doi: 10.1126/science.3283936. [DOI] [PubMed] [Google Scholar]
- Lloyd-Fox S, Blasi A, Elwell CE. Illuminating the developing brain: The past, present and future of functional near infrared spectroscopy. Neuroscience and Biobehavioral Reviews. 2010;34:269–284. doi: 10.1016/j.neubiorev.2009.07.008. [DOI] [PubMed] [Google Scholar]
- Lloyd-Fox S, Blasi A, Volein A, Everdell N, Elwell C, Johnson MH. Social perception in infancy: A near infrared spectroscopy study. Child Development. 2009;80:986–999. doi: 10.1111/j.1467-8624.2009.01312.x. [DOI] [PubMed] [Google Scholar]
- Malach R, Reppas JB, Benson RR, Kwong KK, Jiang H, Kennedy WA, Ledden PJ, Brady TJ, Rosen BR, Tootell RBH. Object-related activity revealed by functional magnetic resonance imaging in human occipital cortex. Proceedings of the National Academy of Sciences. 1995;92:8135–8139. doi: 10.1073/pnas.92.18.8135. [DOI] [PMC free article] [PubMed] [Google Scholar]
- Mareschal D, Johnson M. The “what” and “where” object representations in infancy. Cognition. 2003;88:259–276. doi: 10.1016/s0010-0277(03)00039-8. [DOI] [PubMed] [Google Scholar]
- Mather M, Cacioppo JT, Kanwisher N. How FMRI can inform cognitive theories. Perspectives on Psychological Science. 2013;8:108–113. doi: 10.1177/1745691612469037. [DOI] [PMC free article] [PubMed] [Google Scholar]
- Michelon P, Vettel JM, Zacks JM. Lateral somatotopic organization during imagined and prepared movements. Journal of Neurophysiology. 2005;95:811–822. doi: 10.1152/jn.00488.2005. [DOI] [PubMed] [Google Scholar]
- Michotte A, Thines G, Crabbe G. Amodal completion of perceptual structures. In: Thines G, Costall A, Butterworth G, editors. Michotte’s experimental phenomenology of perception. Hillsdale, NJ: Lawrence Erlbaum Associates; 1991. (original work published in French in 1964) [Google Scholar]
- Milner AD, Goodale MA. The visual brain in action. Oxford: Oxford University Press; 1995. [Google Scholar]
- Mishkin M, Ungerleider LG, Macko KA. Object vision and spatial vision: two cortical pathways. Trends in Neuroscience. 1983;6:414–417. [Google Scholar]
- Mohring W, Frick A. Touching up mental rotation: Effects of manual experience on 6-month-old infants mental object rotation. Child Development. 2013;84(5):1554–1565. doi: 10.1111/cdev.12065. [DOI] [PubMed] [Google Scholar]
- Murray SO, Olshausen BA, Woods DL. Processing shape, motion, and three-dimensional shape-from-motion in the human cortex. Cerebral Cortex. 2003;13:508–516. doi: 10.1093/cercor/13.5.508. [DOI] [PubMed] [Google Scholar]
- Murray SO, Schrater P, Kersten D. Perceptual group and the interactions between visual cortical areas. Neural Networks. 2004;17:695–705. doi: 10.1016/j.neunet.2004.03.010. [DOI] [PubMed] [Google Scholar]
- Nagel M, Sprenger A, Hohagen F, Binkofski F, Lencer R. Cortical mechanisms of retinal and extraretinal smooth pursuit eye movements to different target velocities. NeuroImage. 2008;41:483–492. doi: 10.1016/j.neuroimage.2008.02.058. [DOI] [PubMed] [Google Scholar]
- Needham A. Improvements in object exploration skills may facilitate the development of object segregation in early infancy. Journal of Cognition and Development. 2000;1(2):131–156. [Google Scholar]
- Norcia AM. Spatial frequency sweep vep: Visual acuity during the first year of life. Vision Research. 1985;25(10):1399–1408. doi: 10.1016/0042-6989(85)90217-2. [DOI] [PubMed] [Google Scholar]
- Oliver RT, Geiger EJ, Lewandowski BC, Thompson-Schill SL. Remembrance of things touched: How sensorimotor experience affects the neural instantiation of object form. Neuropsychologia. 2009;47(1):239–247. doi: 10.1016/j.neuropsychologia.2008.07.027. [DOI] [PMC free article] [PubMed] [Google Scholar]
- Oliver RT, Thompson-Schill SL. Dorsal stream activation during retrieval of object size and shape. Cognitive, Affective & Behavioral Neuroscience. 2003;3(4):309–322. doi: 10.3758/cabn.3.4.309. [DOI] [PubMed] [Google Scholar]
- Orban GA. The extraction of 3d shape in the visual system of human and nonhuman primates. Annual Review of Neuroscience. 2011;34(1):361–388. doi: 10.1146/annurev-neuro-061010-113819. [DOI] [PubMed] [Google Scholar]
- Orban GA, Van Essen D, Vanduffel W. Comparative mapping of higher visual areas in monkeys and humans. Trends in Cognitive Sciences. 2004;8:315–324. doi: 10.1016/j.tics.2004.05.009. [DOI] [PubMed] [Google Scholar]
- Paradis AL, Cornilleau-Peres V, Droulez J, Van de Moortele PF, Lobel E, Berthoz D, Le Bihan D, Poline JB. Visual perception of motion and 3-D structure from motion: an fMRI study. Cerebral Cortex. 2000;10(8):772–783. doi: 10.1093/cercor/10.8.772. [DOI] [PubMed] [Google Scholar]
- Peuskens H, Claeys KG, Todd JT, Norman JF, Van Hecke P, Orban GA. Attention to 3-D shape, 3-D motion, and texture in 3-D structure from motion displays. Journal of Cognitive Neuroscience. 2004;16:665–682. doi: 10.1162/089892904323057371. [DOI] [PubMed] [Google Scholar]
- Richter W, Somorjai R, Summers R, Jarmasz M, Menon RS, Gati JS, Georgopoulos AP, Tegeler C, Ugurbil K, Kim SG. Motor area activity during mental rotation studied by time-resolved single-trial fMRI. Journal of Cognitive Neuroscience. 2000;12(2):310–320. doi: 10.1162/089892900562129. [DOI] [PubMed] [Google Scholar]
- Schweinle A, Wilcox T. Sex differences in infants’ ability to represent complex event sequences. Infancy. 2004;6:333–359. [Google Scholar]
- Sommerville JA, Woodward AL. The link between action production and action processing in infancy. In: Grammont F, Legrand D, Livet P, editors. Naturalizing intention in action. Cambridge, MA: MIT Press; 2010. pp. 67–90. [Google Scholar]
- Soska KC, Adolph KE, Johnson SP. Systems in development: Motor skill acquisition facilitates 3D object completion. Developmental Psychology. 2010;46:129–138. doi: 10.1037/a0014618. [DOI] [PMC free article] [PubMed] [Google Scholar]
- Spelke ES, Kestenbaum R, Simons DJ, Wein D. Spatiotemporal continuity, smoothness of motion and object identity in infancy. Br J Dev Psychol. 1995;13:113–143. [Google Scholar]
- Strangman G, Franceschini MA, Boas DA. Factors affecting the accuracy of near-infrared spectroscopy concentration calculations for focal changes in oxygenation parameters. NeuroImage. 2003;18:865–879. doi: 10.1016/s1053-8119(03)00021-1. [DOI] [PubMed] [Google Scholar]
- Teller D, Movshon J. Visual development. Vision Research. 1985;26:1483–1506. doi: 10.1016/0042-6989(86)90169-0. [DOI] [PubMed] [Google Scholar]
- Thompson Schill SL. Neuroimaging studies of semantic memory: Inferring “how” from “where”. Neuropsychologia. 2003;41(3):280–292. doi: 10.1016/s0028-3932(02)00161-6. [DOI] [PubMed] [Google Scholar]
- Tootell D, Tsao D, Vanduffel W. Neuroimaging weighs in: Humans meet macaques in “primate” visual cortex. The Journal of Neuroscience. 2003;23:3981–3989. doi: 10.1523/JNEUROSCI.23-10-03981.2003. [DOI] [PMC free article] [PubMed] [Google Scholar]
- Ungerleider LG, Mishkin M. Two cortical visual systems. In: Ingle DJ, Goodale MA, Mansfield RJW, editors. Analysis of visual behavior. Cambridge, MA: MIT Press; 1982. pp. 549–586. [Google Scholar]
- Watanabe H, Homae F, Nakano T, Taga G. Functional activation in diverse regions of the developing brain of human infants. Neuroimage. 2008;43:345–357. doi: 10.1016/j.neuroimage.2008.07.014. [DOI] [PubMed] [Google Scholar]
- Wilcox T. Object Individuation: Infants’ use of shape, size, pattern, and color. Cognition. 1999;72:125–166. doi: 10.1016/s0010-0277(99)00035-9. [DOI] [PubMed] [Google Scholar]
- Wilcox T, Bortfeld H, Armstrong J, Woods R, Boas D. Hemodynamic response to featural and spatiotemporal information in the infant brain. Neuropsychologia. 2009;47:657–662. doi: 10.1016/j.neuropsychologia.2008.11.014. [DOI] [PMC free article] [PubMed] [Google Scholar]
- Wilcox T, Bortfeld H, Woods R, Wruck E, Boas D. Hemodynamic response to featural changes in the occipital and inferior temporal cortex in infants: A preliminary methodological exploration. Developmental Science. 2008;11:361–370. doi: 10.1111/j.1467-7687.2008.00681.x. [DOI] [PMC free article] [PubMed] [Google Scholar]
- Wilcox T, Haslup J, Boas DA. Dissociation of processing of featural and spatiotemporal information in the infant cortex. NeuroImage. 2010;53:1256–1263. doi: 10.1016/j.neuroimage.2010.06.064. [DOI] [PMC free article] [PubMed] [Google Scholar]
- Wilcox T, Hirshkowitz A, Hawkins L, Boas D. The effect of color priming on infant brain and behavior. NeuroImage. 2014;85:302–313. doi: 10.1016/j.neuroimage.2013.08.045. [DOI] [PMC free article] [PubMed] [Google Scholar]
- Wilcox T, Schweinle A. Infants’ use of speed of motion to individuate objects in occlusion events. Infant Behavior and Development. 2003;26:1833–1840. [Google Scholar]
- Wilcox T, Stubbs J, Hirshkowitz A, Boas DA. Object processing and functional organization of the infant cortex. NeuroImage. 2012;62:1833–1840. doi: 10.1016/j.neuroimage.2012.05.039. [DOI] [PMC free article] [PubMed] [Google Scholar]
- Wilcox T, Woods R, Chapa C, McCurry S. Multisensory exploration and object individuation in infants. Developmental Psychology. 2007;43:479–495. doi: 10.1037/0012-1649.43.2.479. [DOI] [PMC free article] [PubMed] [Google Scholar]
- Wilson KD, Farah MJ. Distinct patterns of viewpoint-dependent BOLD activity during common-object recognition and mental rotation. Perception. 2006;35:1351–1366. 161–171. doi: 10.1068/p5571. [DOI] [PubMed] [Google Scholar]
- Xu F, Carey S. Infants’ metaphysics: the case of numerical identity. Cognitive Psychology. 1996;30:111–153. doi: 10.1006/cogp.1996.0005. [DOI] [PubMed] [Google Scholar]
- Zachariou V, Klatzky R, Behrmann M. Ventral and dorsal visual stream contributions to the perception of object shape and object location. Journal of Cognitive Neuroscience. 2014;26(1):189–209. doi: 10.1162/jocn_a_00475. [DOI] [PMC free article] [PubMed] [Google Scholar]
- Zacks JM, Vettel JM, Michelon P. Imagined viewer and object rotations dissociated with event-related fMRI. Journal of Cognitive Neuroscience. 2003;15(7):1002–1018. doi: 10.1162/089892903770007399. [DOI] [PubMed] [Google Scholar]
Associated Data
This section collects any data citations, data availability statements, or supplementary materials included in this article.