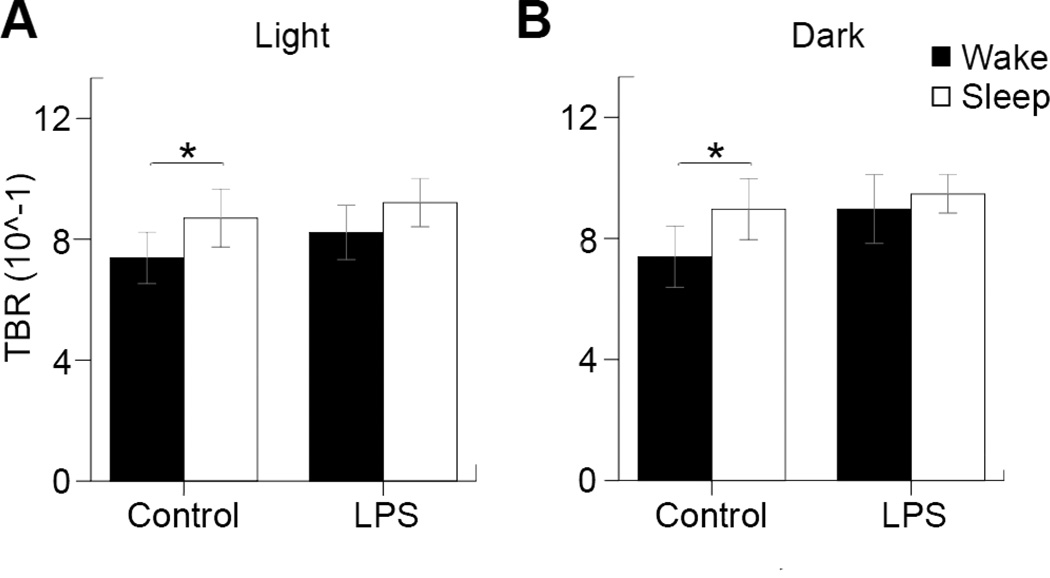
Figure 5. Theta-beta ratio analysis.
(A) The theta-beta ratios for controls during wake (0.74±0.085) and sleep (0.87±0.096), as well as LPS during wake (0.82±0.010) and sleep (0.92±0.080) during the light cycle. (B) The theta-beta ratios for controls during wake (0.74±0.10) and sleep (0.90±0.10), as well as LPS during wake (0.90±0.11) and sleep (0.95±0.063) during the dark cycle. Statistical significance was determined by paired-samples T-tests (*=p<0.05, n=8 control, n=10 LPS).

