

Abstract
Report cards have been used to increase accountability and quality of care in health care settings, and to improve state infrastructure for providing quality mental health care services. However, to date, report cards have not been used to compare states on racial/ethnic disparities in mental health care. This qualitative study examines reactions of mental health care policymakers to a proposed mental health care disparities report card generated from population-based survey data of mental health and mental health care utilization. We elicited feedback about the content, format, and salience of the report card. Interviews were conducted with nine senior advisors to state policymakers and one policy director of a national non-governmental organization from across the U.S. Four primary themes emerged: fairness in state-by-state comparisons; disconnect between the goals and language of policymakers and researchers; concerns about data quality and; targeted suggestions from policymakers. Participant responses provide important information that can contribute to making evidence-based research more accessible to policymakers. Further, policymakers suggested ways to improve the structure and presentation of report cards to make them more accessible to policymakers and to foster equity considerations during the implementation of new health care legislation. To reduce mental health care disparities, effort is required to facilitate understanding between researchers and relevant stakeholders about research methods, standards for interpretation of research-based evidence and its use in evaluating policies aimed at ameliorating disparities.
Introduction
Among those with mental illness, racial/ethnic minorities experience greater severity and chronicity of mental illness (Breslau et al., 2005; Williams & Rucher, 2000). While the causes of these mental health differences are multifactorial, it is likely that persistent disparities in access to and quality of care (Cook, Miranda, & McGuire, 2007; Blanco et al., 2007) contribute to minorities' poorer mental health outcomes (Williams & Rucker, 2000). Tracking success in reducing these disparities is of the utmost importance. The passage of the Affordable Care Act and the Mental Health Care Parity Act will necessitate numerous changes at the state and federal level in the organization and payment structure of mental health care, with potentially significant effects on access to mental health and mental health care disparities (Smedley, 2008). The monitoring of states' progress in disparities reduction will help to maintain accountability and focus on equity in health care as implementation of these laws progresses.
Public reporting has been championed as an efficient means to foster greater accountability in health care, though available evidence suggests mixed success on this front (Trivedi, Gibbs, Nsiah-Jefferson, Ayanian, & Prothrow-Stith, 2005). Advocates for public reporting maintain that “health care report cards,” studies that compare states, areas, or health care systems on defined health care quality metrics provide a readily useable tool for assessing and tracking health care performance. In this respect, state-based report cards may prove particularly useful in efforts to address disparities in mental health care. Improved data systems and monitoring are required to track the effect of policies and programs targeting racial and ethnic minority populations (Williams & Rucker, 2000) and report cards present an important method of comparing the data from these efforts by location and time.
Publicly identifying areas of the country with high rates of mental health care disparities also maintains a focus on equity considerations and applies pressure on policymakers to implement policies that result in improved access to and receipt of quality care. Disparities in mental health care are in part due to a failure to implement evidence-based practices equitably (Agency for Health Research and Quality, 2001; Alegria, 2009). Choosing items in the report card that align with evidence-based practices rightly evaluates states on measures shown to be important to improving mental health care outcomes. Furthermore, the benefits of mental health care parity, extended health insurance coverage, patient-centered medical homes, and other initiatives to be implemented under the ACA may also be distributed inequitably. A state-based mental health disparities report card offers a tool in assisting state policymakers to surmount obstacles to effective mental health policy decisions in the face of competing priorities (Epstein, 1998) and can maintain equitable implementation of new legislation as a priority. To the extent that they provide a tenable, methodologically rigorous and consistent means to evaluate policy decisions, we posit that a state-based mental health disparities report card has the potential to reduce disparities, improve the translation of research to policy and, to reduce disparities in access and quality of mental health care.
Emergence of Report Cards to Measure Quality of Health Care
Despite an increase in both cost (Mark, McKusick, King, Harwood, & Genuardi, 1996) and demand for mental health care (Frank & Glied, 2006; Frank, Goldman, & McGuire, 2009), substantial numbers of people with psychiatric disorders do not receive minimally acceptable care (Alegria et al., 2008; Cook et al., 2014; Wang, Demier, & Kessler, 2002). Health care report cards, defined as an integrated set of quantitative indicators to assess performance and quality (Gormley & Weimer, 1999), are increasingly used to monitor the quality of health care (Dranove, Kessler, McClellan, & Satterthwaite, 2002; Teague, Ganju, Hornik, Johnson, & McKinney, 1997). Notable examples in the area of mental health care include the ‘National Alliance on Mental Illness’ (NAMI) ‘Grading the States’ (National Alliance on Mental Illness, 2009), and SAMHSA's ‘Mental Health Statistics Improvement Program (MHSIP) Report Card’ (Teague et al., 1997). NAMI's consumer advocacy-based approach report card is based on state measures of access to treatment, the availability of recovery services, information services and public infrastructure. The MHSIP report card was similarly designed as a consumer-based approach report focusing on the quality of state mental health services (Teague et al., 1997). We intend to improve upon this prior work by developing a report card that reports racial/ethnic disparities in individual-level mental health care access and quality (as opposed to comparing states on infrastructure and mental health care provider supply) using analyses of population-based surveys of mental health and mental health care utilization. Interviewing policymakers to understand their reactions to this type of report card using a preliminary comparison of U.S. cities represents a formative step in this process.
The development of performance standards for mental health care has not kept pace with other areas of medical care (Rosenheck & Cicchetti, 1998). A possible explanation for this difference is that capitation and other behavioral health care management tools drive quality, preventing the field from effectively negotiating with payers with respect to independent monitoring systems (Manderscheid, 1998). At the same time, mental health care does not readily lend itself to quantifiable outcomes with well-defined endpoints (Rosenheck & Cicchetti, 1998) in the same way that medical care such as cardiovascular care does, making quality care hard to measure. Evidence-based guidelines regarding minimally adequate mental health care exist (Melfi et al., 1998; Wang et al., 2002; Wells et al., 2000) but are not disorder-specific and differ from more stringent, disorder-specific measures of quality (Busch, Frank, Lehman, & Greenfield, 2006; Busch, Frank, Sachs, & Normand, 2009; Farmer Teh et al., 2009). In the absence of a core set of quality measures for mental health, regional differences in access to, intensity and duration of treatment have been noted (Wang et al., 2002), underscoring the vulnerability of mental health services to state budget cuts (Rosenheck & Cicchetti, 1998). Given these obstacles, forging consensus on a set of fair measures of mental health care quality has hampered the development of mental health care report cards.
Evidence in support of the utility of report cards in improving quality of care is equivocal (James, 2012). Recipients of poor grades tend to perceive the report card as flawed (Romano, Rainwater, & Antonius, 1999), and ignore its findings. Others maintain that they exert limited influence on policy change or market behavior (Coe, 2003; M. Marshall et al., 2006). While report cards characterized by highly adverse outcomes and/or poor ratings do influence consumers and state legislators, measures of stable performance go largely unnoticed (Shahian et al., 2011). Hospital-based report cards have received increased scrutiny as states mandate the publication of risk-adjusted mortality rates for facilities that provide acute care and/or cardiac surgeries (Mukamel & Mushlin, 2001; Shahian, Torchiana, Shemin, Rawn, & Normand, 2005). Advocates maintain that report cards grading quality of cardiovascular care facilitate patient choice, stimulate quality improvement, and inform health care administrators (Dranove et al., 2002). Detractors challenge the validity of such claims, arguing that the analytical techniques utilized in many report cards are incorrect and that the very nature of the reports encourages “gaming” the system either through deliberate selection of the healthiest patients, avoidance of high-risk individuals, or some combination of both - with negative repercussions including reduced access to care among critically ill individuals (Dranove et al., 2002; Marshall, Romano, & Davies, 2004; Shahian et al., 2001; Tu & Austin, 2007; Tu et al., 2009).
Strengthening mental health care disparity report cards
There is a need to offer clarity in a report card's purpose, to motivate it with research questions that are useful for dissemination, and to provide results that can be used for reform (Pawson, 2002). That is, the success of a report card lies in its communication to policymakers, media response, and its recommendations for improvement (Epstein, 2006). The implementation of a cardiac surgery report card in Massachusetts, for example, was made possible through the productive collaboration of cardiac surgeons, statistical analysts and state regulators, underscoring the importance of effective coalition building well in advance of any publication of results (Shahian et al., 2005). To be effective, report cards must forge a compromise between the delivery of health and human services focused on what we should do, and the rigor and hypothesis formulation, what we do not know, inherent in research (Shonkoff, 2000).
Public reporting and disparities in health care
While report cards have gained traction in the past decade as a means to reward health care providers and hospitals meeting specific targets, the impact of these initiatives on disparities in health care is unknown because most do not collect information on the race or ethnicity of patients (Weinick & Hasnain-Wynia, 2011). Some evidence suggests that quality improvement efforts may actually serve to widen gaps in care among racial/ethnic minority populations (Trivedi, Grebla, Wright, & Washington, 2011; Weinick & Hasnain-Wynia, 2011; Werner & Asch, 2005). Failure to integrate quality improvement and disparity reduction efforts may unwittingly increase disparities by reducing physician salaries in economically disadvantaged communities, deterring service use through the continuance of programs that do not meet the needs of patients and inducing physicians to cherry pick patients that are likely to be healthier (Casalino et al., 2007). Report cards focused specifically on reducing disparities in care are emerging. For example, disparities report cards were used to improve diabetes care (Sequist et al., 2010) and now influence the setting of Massachusetts Medicaid hospital payments (Weinick, Caglia, Friedman, & Flaherty, 2007). More robust implementation of these report cards requires broader buy-in and input from providers and policymakers.
While report cards are emerging as a means of monitoring progress towards reducing health care disparities, no report cards have been developed to track disparities in mental health care access and quality. Input into the development of such a report card from stakeholders such as state policymakers and advocates is needed for the report card to be a relevant and effective tool for tracking and reducing mental health care disparities.
Present study
This paper is a qualitative study examining the reactions of senior-level professionals in state government who work in mental health care administration to mental health care disparities report cards. We conducted these interviews as an initial step in the proposed creation of a state-by-state report card to evaluate states on their success in reducing racial and ethnic disparities in mental health care. A sample report card was used during the interviews to facilitate conversation and to garner feedback about potential data to include and how to best present it (see Figure 1). Analyzing their responses provides important, useable information about how to make evidence-based research more accessible, with the goal of facilitating better policy creation - particularly policies to address disparities in mental health care that have proved intractable over the last decade (Blanco et al., 2007; Cook et al., 2007). This paper is the first study of which we are aware that elicits stakeholder input to aid in the development of a mental health care disparities report card.
Figure 1. Three slides presented to respondents to discuss the visual design of the mental health care disparities report cards.
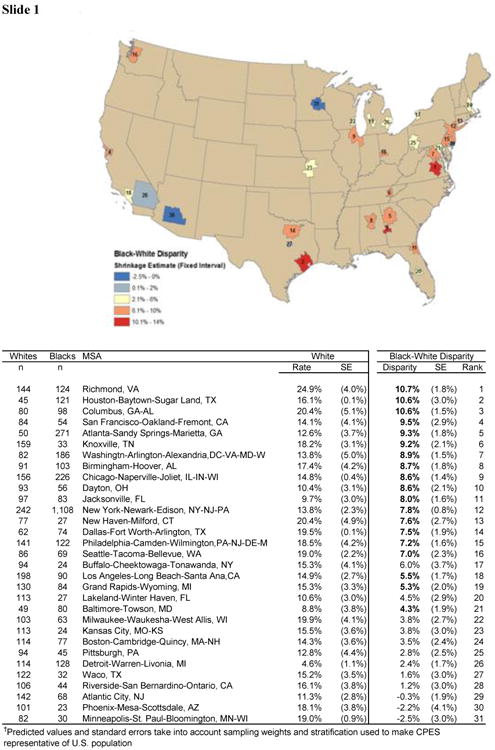


Slide 1: Map for 31 Metropolitan Statistical Areas (MSAs) ranked and colored by magnitude of black-white disparity in rates of any mental health care
Slide 2: Scatter plot of percentage white mental health care use (x-axis) and minority percentage minority mental health care use (y-axis)
Note: These figures show the relationships between minority mental health use and white mental health use. Dots are shaded by percent minority living in each MSA. If national disparities were solely due to minorities living more in cities that utilize mental health care less, then all dots would fall on the 45 degree line and darker shaded dots would be towards the bottom left. Most of the points lie below the line, indicating that disparities exist for all racial/ethnic groups most MSAs. Darker shaded dots are located in the bottom left, indicating that location contributes to overall disparity, but most dots fall below the line, indicating that there are also disparities within MSAs.
Slide 3: Ranking with confidence intervals of disparities in any mental health care use
Note: Estimated disparities and 95% intervals based on model-generated predictions from Collaborative Psychiatric Epidemiology Surveyes. The black line is at 0, the red line is the average across all MSA estimates. Most MSAs have disparities significantly <0. Except at the extremes, disparities within MSAs are not significantly different.
Methods
Characteristics of focus group and interview participants
Volunteer participants were nine senior advisors to policymakers from state departments of mental health in management positions and one policy director from a national non-profit organization. The states varied in mental health care delivery systems, including the organizational behavior of their HMOs, policy initiatives, populations, provider networks, budget expenditure, economic status, and regional needs. All participants reported seeing or using report cards that graded their states. Participants were recruited in October 2011 at a conference of the National Association of State Health Policymakers (NASHP). A flyer was distributed asking for senior advisors to policymakers and/or directors of state mental health departments to participate in an interview to discuss state-based mental health care disparities report cards, important factors related to disparities to incorporate in a proposed report card and ideas one might have about how to best convey this information to policymakers. Participants were from states with varied demographic, socioeconomic and urban/rural populations in the Northeast, Southeast, Midwest and Pacific Northwest regions.
Procedures for eliciting feedback on a proposed mental health care disparity report card
This study constitutes the first step of a mixed methods exploratory sequential study design(Creswell and Clark 2010), an approach that prioritizes the collection and analysis of qualitative data in order to inform subsequent quantitative analyses. We collected the feedback of senior advisors to state policymakers to inform the development, design, and analysis of a state-by-state mental health care disparity report card. Our aim was to conduct focus groups, though scheduling conflicts among prospective participants allowed for two such groups only, consisting of three and four respondents, respectively. Three in-depth individual qualitative interviews using the same questions and data presentation format were also conducted, yielding responses from a total of ten respondents. Senior researchers on the team conducted all focus groups and/or in-depth interviews. Upon review of the coded data, we decided to discontinue data gathering as respondents frequently repeated or endorsed the ideas their colleagues noted.
The proposed purpose of the mental health care disparities report card is to rank states on disparities in three mental health care utilization measures: initiation of mental health care, mental health care expenditures given use, and quality of mental health care (operationalized as 4 or more mental health care visits and a psychotropic medication fill or 8 or more mental health care visits without a psychotropic medication fill) (Wang et al. 2005). Disparities on these three measures have been identified at the national level (Cook et al. 2014). These three measures differ from those of previous report cards (National Alliance on Mental Illness, 2009) because they are focused on aggregated individual-level utilization within a state as opposed to structural components of a mental health care system. Although the measures were pre-selected because they target the utilization of mental health services among individuals, they were only considered to be a starting point to elicit policymaker feedback. The intent of the interviews was to query senior advisors to policymakers about their response to the utility of these measures, preferences for the presentation of disparities results, and targeted suggestions they might have to enhance its utility and receipt.
Development of a sample mental health care disparity report card shown to focus group and interview participants
So that focus group and interview participants could better understand the format and content of the proposed mental health care disparities report cards, we provided a sample report card comparing disparities in rates of any mental health care across a selection of metropolitan statistical areas (MSAs: geographic areas typically centered around a single city characterized by concentrated population density of greater than 50,000 individuals). Data analyzed for the sample report card come from the Collaborative Psychiatric Epidemiological Surveys (CPES) (Colpe, Merikangas, Cuthbert, & Bourdon, 2004), a comprehensive nationally representative mental health dataset combined with area-level sociodemographic and provider supply data from publicly available databases (Area Resource File (HRSA 2008) and the U.S. Census (2000)).
In our development of the disparities report cards, we defined disparities in mental health care ulization in accordance with the IOM report Unequal Treatment (IOM, 2002), which makes a distinction between racial/ethnic differences and disparities. According to the IOM, racial/ethnic differences arise due to racial/ethnic differences in 1) clinical appropriateness and need, or patient preferences; 2) the operation of health care systems and the legal and regulatory climate; and 3) discrimination. Disparities are defined as all differences except those due to clinical appropriateness and need, or patient preferences. We implemented the IOM definition when comparing MSAs on disparities in any mental health care, using statistical methods recommended in prior studies (Cook et al., 2012; Cook et al, 2009; McGuire, Alegría, Cook, Wells, & Zaslavsky, 2006) that adjust for indicators of clinical need while allowing racial/ethnic differences in socioeconomic status, insurance, and discrimination to enter into the calculation of the disparity. Results from these analyses were presented to policymakers in sample disparities report cards (see Figure 1).
Senior researchers from our team, familiar with the explanation of complex measures and the sample report card analysis, described how the sample report card was created and the statistical methods used to adjust (or to not adjust) for individual- and community-level mental health and sociodemographic differences across states. Participant questions about data, presentation, or statistical methods, were answered at any point during the focus groups and/or in-depth interviews.
Focus group and interview data collection
The focus groups and/or in-depth interviews followed a semi-structured guide; all were audio-recorded. Open-ended questions gauged the purported value of report cards in general and elicited feedback on the sample report card. The concept of using a mental health care disparities report card was introduced by asking: What do you think about using report cards to monitor disparities in mental health treatment? Several prompts meant to discover the respondents' familiarity with and opinion of report cards followed. Then the concept of our proposed report card was introduced as a state-by-state comparison of racial/ethnic disparities in initiation of mental health care, mental health care expenditures given use, and quality of mental health care among individuals in need for mental health care. The data source (the Medical Expenditures Panel Survey (MEPS) linked to the Area Resource File and U.S. Census data), and more information about the three proposed indicators of mental health care access and quality were described. It was noted that MEPS is based on a representative sample and collects information annually on multiple aspects of mental health care including population-based measures of mental health, detailed expenditure and utilization information and documentation of all mental health care use over two years for each respondent. Further, MEPS includes mental health status assessments (e.g., the Kessler-6 (K-6), Patient Health Questionnaire-2 (PHQ-2) and Functional Status (SF-12)) to determine individual need for treatment. When presented with the proposed utilization measures, respondents were asked a series of questions, including whether or not the measures had merit, what measures might be more relevant for identifying disparities in mental health care, their reactions to the report card format, and their ranking of the measures from most to least important.
The final part of the interview guide focused on the visual design of the mental health care disparities report cards. Respondents were presented with the sample report card created from the CPES as described above. These example report cards included maps and rankings comparing metropolitan statistical areas (MSAs) (See Figure 1). Interviewers clarified respondent questions about the sample report cards and then asked about the best way to present and disseminate findings. The interview concluded with an open-ended question asking if the respondent(s) had anything else to add.
Qualitative data analysis
To analyze focus group and interview responses, we used the constant comparative method, a method that allows for “codifying” qualitative data while also simultaneously analyzing it for connections to the context of the respondent's whole response, resulting in a constant “redesign” of theory (Glaser & Strauss 1967;Miles & Huberman, 1994; Patton, 2002). The “framework” method acted as a guide for the detection of relevant themes (Ritchie & Spencer 2002) by providing the following recommended steps of working through the data: 1) Familiarization, immersing oneself in the data; 2) Identifying a thematic framework, focusing in on key issues; 3) Indexing, applying the thematic framework to specific data points such as words; 4) Charting, reorganizing the data into charts with the relevant themes; and 5) Mapping and interpretation of data where concepts and typologies emerge (Ritchie & Spencer 2002). Analysts adhered to the tenet that qualitative analysis requires a combination of deductive and inductive logic (Miles & Huberman, 1994). That is, themes and hypotheses can be tested but also should be allowed to arise from the data itself. The analysts were encouraged to do more than count the frequency of certain words, but also to detect the emphasis and importance placed on words by the respondents in the whole sample.
The steps used to operationalize these theoretical frameworks for qualitative data analysis were the following: First, researchers read through transcripts, line-by-line, recording notes of themes that arose in the data. Analysts generated codes based not only on the frequency of motifs within the response but also on the emphasis granted certain themes by the respondent. Quotes that aligned with the emerging themes were organized using NVivo software, which allowed for ongoing discovery of open themes. Second, researchers revisited and updated themes after the completion of the coding and after coding of additional interviews. Third, two analysts, blinded to each other's results, collaborated to refine the open themes and coding and to select quotes that they agreed most represented each theme (Bradley, Curry, & Devers, 2007). Finally, the analysts came to a consensus upon the final themes and discussed how these themes informed the subsequent creation of the mental health care disparities report cards.
Results
Four major themes were identified that relate to policymakers' concerns and suggestions for developing a mental health care disparities report card: fairness in state-by-state comparisons; disconnect between the goals and language of policymakers and researchers; concerns about data quality; and targeted suggestions from policymakers (See Table 1 for summary). One of the four major themes, Targeted Suggestions from Policymakers, matched the a priori interview guide theme whereas the other open themes emerged after analysis of the data. The respondents were unanimous in raising points related to these four themes. Four other themes that arose from respondent comments deserve mention though they were only raised by one or two respondents: 1) distrust of research; 2) difficulty in understanding statistical methods and results; 3) concern over the importance placed on focusing on racial/ethnic minorities; and 4) the importance of reporting positive as well as negative outcomes. Because these themes were rarely mentioned, they are not explored in-depth in this section. We here discuss in more detail the comments underlying the four major themes.
Table 1. Four Themes Related to Policymakers' Concerns and Suggestions for Developing a Mental Health Care Disparities Report Card.
| Theme | Definition | Example |
|---|---|---|
| Fairness in state-by-state comparisons | The concern that a report card's findings will be biased and therefore of diminished utility. How can a report card best capture the experience of care and/or unmet need among vulnerable populations (e.g.: Native Americans, Pacific Islanders) that are often excluded from analysis based on small sample sizes or grouped in ways to make statistical inferences possible, but obscure disparities? | We end up having to explain all that ‘apples to apples’ comparisons and it becomes a distraction.” “It doesn't show up in [the] analysis and it couldn't because there are fifty ways to do everything,” |
| Disconnect between the goals and language of policymakers and researchers | Expressed as tension or even mistrust about the nature of research evidence and the goals of research vs. the insider's knowledge of how state politics worked, which programs were truly effective and the state's most vulnerable populations. How are these report cards to be used? | “I understand [it] statistically, but it's a different issue politically” “[We're] sensitive to the term report card because anything with a value assessment would rate it so that services are cut.” |
| Concerns about data quality | Refers to concerns about data collection, measurement and analysis, and the nature of making comparisons between states based on partial, or inaccurate information. How could mental health conditions be defined to best capture a spectrum of conditions? | [It is okay to] “benchmark different groups against each other…” [so long as such comparisons] “…were not based on “predefined conclusions.” |
| Targeted suggestions from policymakers | Includes specific recommendations about how to ensure that the report would be well received and perceived as fair and helpful. How can we shift the emphasis of report cards to include positive outcomes as well? | “Areas where minority groups do well are excluded. Reporting areas where minority groups do better would give more credibility to the report.” “Maps are the best way to display the data because they are more intuitive.” |
Fairness in State-by-State Comparisons
Respondents suggested that a mental health care disparities report card could neither account for factors that made a state unique - like its population composition – nor for inconsistencies across states including involuntary commitment laws, provider training and licensure requirements, or the degree to which the financing and delivery of mental health services statewide was determined by “…managed care corporations policies or state administrations.” Many expressed the idea that fairness in state-by-state comparisons was somehow lost in the process of grading states. During a focus group, one respondent explained the problem of fairness as an issue of grading states based on categories that are overly broad and feign the look of compatible comparison: “We end up having to explain all that ‘apples to apples’ comparisons and it becomes a distraction.” Others spoke of the provider population, noting that variables associated with the provider, such as competency, could never be known or evaluated in a meaningful way. One cited “the struggle to find providers that are culturally competent”; another suggested the need to “measure the skillfulness of the provider base.” “I could give excellent funding to a lousy community health center and get lousy outcomes,” the respondent concluded. Such factors were referred to as beyond the stakeholders' control and beyond the researchers' ability to capture accurately.
Two senior advisors to policymakers explained how outcome measures used in prior report cards led to an erroneous interpretation of their state's mental health care system based on discrete policy contexts within each state. Each noted their state's stringent involuntary commitment laws, which result in higher levels of commitment of individuals than in states without such laws. Referring to previously published report cards, one senior advisor to policymakers noted that simply comparing the numbers of committed individuals across states might not provide meaningful information. “It doesn't show up in [the] analysis and it couldn't because there are fifty ways to do everything,” one respondent said when discussing how the failure to accurately account for significant differences between states can affect the fairness of report card grades.
Concerns about populations that have been historically underreported were also noted; some respondents cited criticisms leveled at prior report cards, explaining that populations most in need are not assessed using the same criteria as majority populations. Moreover, important system factors within states were excluded from research analysis. In relation to the difficulty of measuring adequacy of care, respondents described a wide variety of ways that patients may receive care within a particular state, as well as rapidly evolving protocols in many state care delivery systems. As an example, it might appear as if a patient were receiving inadequate care if the measure was unable to identify that s/he was being moved to and from multiple treatment delivery systems at the time of assessment.
Disconnect between the goals and language of policymakers and researchers
A sense of disconnect between the objectives of research and policymaking was evident in the responses of many respondents. In discussing the interpretation of data by state policymakers, one observed, “I understand [it] statistically, but it's a different issue politically.” Many expressed concern that results from statistical analyses might result in legislative “backlash” or “defensive postures.” Ironically, a high report card score might not be welcome either, as it could signal to state legislatures that mental health care was not a pressing issue and vital funding would be withdrawn. Several respondents were particularly explicit about this anxiety: “I'm worried what they're used for”; “[We're] sensitive to the term report card because anything with a value assessment would rate it so that services are cut.” Tension between the purported goal of the rankings and likely outcomes was a prominent theme throughout all the interviews.
Most respondents noted that a state's report card grade seldom corresponded to an insider's experiences of health care on the ground and that many report cards were “set up with predefined conclusions” and not “just testing hypotheses.” In anticipation of how our report card would be received by state policymakers, some respondents wanted all report cards to include “caveats” indicating the purposes for which they should and should not be used, such as budget cuts. Explained one, “[it] often appears as though it's about making an advocacy position, not about an equitable look at disparities across cultures.”
Respondent comments reflected tensions concerning the nature of evidence, how it is arrived at and the conclusions one might draw from it. Many needed clarification of both data points and/or methods used to inform the proposed mental health care disparities report card. Many were “surprised” that use of the MEPS dataset and proposed indicators would result in the kind of analysis and nuanced picture of statewide disparities presented. Some informants expressed doubts that it was actually possible to obtain valid information on some measures and many asked about how MEPS respondents are selected and how such extensive data is collected. After our team's descriptions of details of data collection, many respondents countered that results could still be confounded or misleading.
Concerns About Data Quality
Apart from questions concerning data collection and analysis methods, many respondents touched upon themes of poor data quality and assumptions underlying analyses. Some suggested that despite the best of intentions, report card analysis could be biased by subtle assumptions of the researcher. One respondent said, for example, that it was good to “benchmark different groups against each other…” so long as such comparisons “…were not based on “…predefined conclusions.” This sentiment reflects a pervasive theme that the idea of a report card is not simply a data driven entity but an emotionally provocative one as well. Respondents worried about the potential for error when patients fill out surveys, whether or not a patient could accurately interpret a question correctly, or whether or not patients would be willing to report accurate information (i.e. in the case of undocumented immigrants). In other cases, they implied that patient response, even in answering questions about the adequacy of care, would be of little worth, given numerous examples of patient loyalty to health centers that were patently inadequate. Further, patient response was also considered untrustworthy for self-reported mental health and health care delivery.
Targeted Suggestions from Policymakers
Specific suggestions about how to enhance the data included: the inclusion of both child and adult data (our proposed report card only included adult data); reporting of rates for racial/ethnic and geographic subpopulations, even if there was large statistical error in the estimates; and the inclusion of language proficiency and adverse childhood experiences (ACEs) defined as chronic stressors and/or traumatic events of childhood that are associated with physical and mental health problems in adulthood (SAMHSA, 2014). Although disparities analyses address health care distribution among various racial/ethnic groups, many policymakers felt that too often report cards neglected underrepresented groups who were “really in need.” Respondents were not merely concerned with excluding smaller minority sub-ethnic groups, but expressed concern that areas where minority groups do well were often excluded, claiming that issues “where minority groups do better” would “give more credibility to the report.” Most respondents also suggested the inclusion of specific concerns of subpopulations unique to their states, and expressed exasperation that researchers often couldn't provide better data of typically under reported minority groups with small sample sizes (e.g., Native Americans, Asian Americans).
When speaking of the utility of report cards, respondents said that report cards in general were “useful,” especially when data were broken down at the “block level.” One respondent added that the information provided was useful because it was “good to know in terms of your own quality improvement.” Concerns tended to focus on the public or political reaction to report card grades and therefore most of their targeted suggestions were related to these concerns.
Respondents also voiced concerns about the utility of the proposed measure of mental health care expenditures with respect to state budgetary issues, noting that expenditures may be a poor indicator of quality of mental health care. As an example, one respondent asserted that a clinic might have a large budget but it might not necessarily use all of the money allotted to them, in an effort to appear better or worse in terms of expenditures and confound the data. Another noted that a search for the most “cost-effective treatment plan” for children, especially in terms of medication, was actually a quality control measure. A majority of respondents suggested that budget expenditures were often deceiving, though, paradoxically, budgetary expenditures are often the most important measure used in health care.
Targeted Suggestions from Policymakers also included respondent claims that the term “report card” is decidedly negative and “hated” by many states. Evaluations that include “suggestions for improvement rather than just areas for improvement” were deemed helpful. In discussing the sample report cards provided, a majority of respondents agreed that maps were the best way to display the data, maintaining, “they are more intuitive.” All interviewees endorsed local area data (data from MSAs and even smaller areas such as neighborhoods) as being potentially very helpful to their quality improvement efforts.
Discussion
The creation of a mental health care disparity report card capitalizes upon efforts across the U.S. to capture racial/ethnic data to publicly compare states on their success in reducing mental health care disparities and to hold them accountable for improving equity of access and quality of care. Our findings, however, show that much progress is needed to bridge the gap between the priorities and objectives of researchers and policymakers if a report card is to be developed, and that policymakers need to be involved in a) the decision to use report cards as a mechanism to reduce disparities; and b) in the development of these report cards should they be used. Beyond cross-disciplinary differences, the training and career trajectories of those working within research or policy differ such that the epistemologies of each are not shared, nor well understood by the other. Senior advisors' comments revealed a disconnect between the goals and language of policymakers and researchers and they expressed concerns over fairness in state-by-state comparisons. This suggests that, in order to develop and implement a mental health care disparity report card, researchers need to be explicit about their normative theoretical framework and to examine the assumptions that underscore their research questions and the implications of their findings (Fleurbaey & Schokkaert, 2009).
Communication with administrators and policymakers in the early stages of planning is extremely important so that there is a shared understanding of the objectives and assumptions underlying the development of the report card. One area in which this is important is to ensure that researchers do not jump ahead to assume that the research will be beneficial for policymakers. For example, we developed one section of the interview guide to specifically elicit respondent perceptions of the three utilization measures used in the proposed report card. However, a consistent finding across all respondents was a reluctance to discuss the measures and a return to their more general concern about the utility of the report card. Through their efforts to translate child development research for policymakers, Shonkoff & Bales (2011) observed that policymakers formed opinions about scientific research in much the same way as the public: through a reliance on heuristics to frame disparate information largely informed by cultural factors. They also depend on public images, verbal discourse and the input of colleagues in formulating opinions and making decisions. This suggests more attention ought to be paid to considering how scientific knowledge is generated and the process by which policymakers, and the constituencies they represent, come to understand it (Shonkoff & Bales, 2011). In part, this reluctance to address specific indicators in the report card may also have been because the report card indicators were not clearly presented to policymakers. Researchers ought to present a clear and coherent evidence-based narrative justifying their research design, analysis, and results. This is not to suggest that the process must be watered down, only that it is incumbent upon the researcher to provide accessible information.
If a mental health care disparity report card is to be developed, two targeted suggestions emerged from this study: a call for inclusion of both child and adult data, and the creation of additional comparisons that were more relevant to states such as comparisons by geographical area and language proficiency. Respondents also suggested that the utility of report cards would be increased with greater specificity in terms of geographic and racial/ethnic groupings, not less. Calls for the design of a disparities index, a concise view of the racial/ethnic equity gap in mental health care (National Institute of Mental Health, 2010), and disparities impact assessments, tracking of how disparities improve or worsen under various policies and interventions (Weinick & Hasnain-Wynia, 2011), may thus be too broad to serve the needs of state policymakers. Disparities impact assessments and state report cards should thus heed respondents' concerns about fairness in state-by-state comparisons insofar as they have the resources and data to account for factors that the state should be responsible for and factors that are beyond state control.
In terms of addressing mental health care inequities, researchers should emphasize that fair measurement is vital to assessing policymakers' efforts to reduce disparities. The concern raised by respondents that research comparisons may be based on predefined conclusions identified under respondents' concerns about data quality underscores the need to make explicit differing views on the origins and development of health care disparities. Commonly held values inform our understanding of disparities, making it necessary to explore the communicative and ideological barriers between researchers and policymakers. In particular, ideological barriers may be lowered if there is an opportunity for frank discussion about the influence of the historical legacy of discrimination and institutional racism on health care disparities. As some scholars have suggested, legislation that prohibits purposeful discrimination, while successful in some areas (e.g., voting and employment), has proven largely ineffective in the context of health care (Willams & Rucker, 2000). Although there may be resistance to acknowledging these linkages, doing so may help policymakers and researchers understand each other's vantage points. Health care disparities are decidedly complex and multifactorial and addressing them will not result in facile solutions (Weinick & Hasnain-Wynia, 2011). Quality improvement efforts such as the development of disparities report cards should account for important state-level historical and contextual factors.
This study has several limitations. First, a limited convenience sample of senior advisors to policymakers was interviewed. For this reason, findings may not reflect the preferences or attitudes of policymakers from all states. Further, in the interest of confidentiality, we did not provide any demographic information on the study participants other than their region of employment. We acknowledge that the absence of this information is significant given how sociodemographic factors might affect participant response – particularly with respect to attitudes towards the importance of reporting on mental health care disparities. Additionally, while topic saturation was detected by the analysts on the four major themes related to concerns and suggestions for the development of the mental health care disparities report cards, resources were not available to interview additional policymakers to test whether saturation had truly been reached on the four major themes and to rule out the emergence of the minor themes. Second, the sample report card using the CPES data may have presented statistical analyses and indicators that were not familiar to the policymakers and therefore may not have been the best tool to elicit policymaker reactions to a mental health care disparities report card. Suggestions for what to include in a mental health care disparities report card may have been more detailed if the measures and methods used to determine mental health care disparities were more familiar or relevant to policymakers.
Senior administrative and managerial personnel, and the policymakers they work with, contribute important insights to the creation of public accountability measures and efforts to foster collaboration between research and policy. While we theorized that stakeholder buy-in was key to how any report card would be received, we discovered that contextualization and a more nuanced assessment of disparities was preferred by state decision makers. Previous report cards and public accountability measures have been criticized for de-motivating providers, increasing health care disparities, ignoring contexts of populations and policy, and lacking constructive criticism. A focus on disparities reduction rather than health care overall appropriately places the lens on those populations most at risk. A state-by-state mental health care disparities report card can incorporate health care delivery, policy, and population contexts and provide utility to policymakers. However, it is important to acknowledge policymakers' resistance to report cards and their concerns regarding data quality and the fairness of comparisons.
Acknowledgments
This project was supported by National Institute of Mental Health Grant R01 MH091042
References
- Agency for Health Research and Quality. Translating research into practice (TRIP)-II. Washington, DC: Agency for Health Research and Quality; 2001. [Google Scholar]
- AHRQ. National Healthcare Disparities Report, 2012. Rockville, MD: Agency for Healthcare Research and Quality; 2012. [Google Scholar]
- Alegria M. Academy Health 25th Annual Research Meeting Chair Address: From a Science of Recommendation to a Science of Implementation. Health Services Research. 2009;44(1):5. doi: 10.1111/j.1475-6773.2008.00936.x. [DOI] [PMC free article] [PubMed] [Google Scholar]
- Alegria M, Chatterji P, Wells K, Cao Z, Chen C, Takeuchi D. Disparity in Depression Treatment Among Racial and Ethnic Minority Populations in the United States. Psychiatric Services. 2008;59(11):1264. doi: 10.1176/appi.ps.59.11.1264. [DOI] [PMC free article] [PubMed] [Google Scholar]
- Blanco C, Patel S, Liu L, Jiang H, Lewis-Fernandez R, Schmidt A. National Trends in Ethnic Disparities in Mental Health Care. Medical care. 2007;45(11):1012–1019. doi: 10.1097/MLR.0b013e3180ca95d3. [DOI] [PubMed] [Google Scholar]
- Bradley EH, Curry LA, Devers KJ. Qualitative data analysis for health services research: developing taxonomy, themes, and theory. Health Services Research. 2007;42(4):1758–1772. doi: 10.1111/j.1475-6773.2006.00684.x. [DOI] [PMC free article] [PubMed] [Google Scholar]
- Busch AB, Frank RG, Lehman AF, Greenfield SF. Schizophrenia, co-occurring substance use disorders and quality of care: the differential effect of a managed behavioral health care carve-out. Administration and policy in mental health. 2006;33(3):388–397. doi: 10.1007/s10488-006-0045-3. [DOI] [PMC free article] [PubMed] [Google Scholar]
- Busch AB, Frank RG, Sachs G, Normand SL. Bipolar-I patient characteristics associated with differences in antimanic medication prescribing. Psychopharmacology bulletin. 2009;42(1):35–49. [PMC free article] [PubMed] [Google Scholar]
- Casalino LP, Elster A, Eisenberg A, Lewis E, Montgomery J, Ramos D. Will pay-for-performance and quality reporting affect health care disparities? Health affairs. 2007;26(3):w405–w414. doi: 10.1377/hlthaff.26.3.w405. [DOI] [PubMed] [Google Scholar]
- Coe CK. A report card on report cards. Public Performance & Management Review. 2003;27(2):53–76. [Google Scholar]
- Colpe L, Merikangas KR, Cuthbert B, Bourdon K. Guest Editorial. International Journal of Methods in Psychiatric Research. 2004;13(4):193–194. [Google Scholar]
- Cook BL, McGuire T, Miranda J. Measuring Trends in Mental Health Care Disparities, 2000–2004. Psychiatric Services. 2007;58(12):1533–1539. doi: 10.1176/ps.2007.58.12.1533. [DOI] [PubMed] [Google Scholar]
- Cook BL, McGuire T, Zaslavsky AM, Meara E. Adjusting for Health Status in Non-Linear Models of Health Care Disparities. Health Services Outcomes and Research Methodology. 2009;9(1):1–21. doi: 10.1007/s10742-008-0039-6. [DOI] [PMC free article] [PubMed] [Google Scholar]
- Cook BL, McGuire TG, Zaslavsky AM. Measuring Racial/Ethnic Disparities in Health Care: Methods and Practical Issues. Health Services Research. 2012;47(3 Pt 2):1232–54. doi: 10.1111/j.1475-6773.2012.01387.x. [DOI] [PMC free article] [PubMed] [Google Scholar]
- Cook BL, Zuvekas S, Carson N, Ferris Wayne G, Vesper A, McGuire TG. Assessing Racial/Ethnic Disparities in Treatment Across Episodes of Mental Health Care. Health Services Research. 2014;49(1):206–29. doi: 10.1111/1475-6773.12095. [DOI] [PMC free article] [PubMed] [Google Scholar]
- Creswell JW. Research Design: Qualitative, quantitative and mixed methods approaches. 3. Thousand Oaks, CA: Sage; 2009. [Google Scholar]
- Creswell JW, Clark V. Designing and Conducting Mixed Methods Research. Thousand Oaks, CA: Sage Publications Incorporated; 2010. [Google Scholar]
- Dranove D, Kessler D, McClellan M, Satterthwaite M. Is more information better? The effects of ‘report cards’ on health care providers: National Bureau of Economic Research 2002 [Google Scholar]
- Epstein AJ. Do cardiac surgery report cards reduce mortality? Assessing the evidence Medical Care Research and Review. 2006;63(4):403–426. doi: 10.1177/1077558706288831. [DOI] [PubMed] [Google Scholar]
- Epstein AM. Rolling down the runway. The challenges ahead for quality report cards. Journal of the American Medical Association. 1998;279:1691–1696. doi: 10.1001/jama.279.21.1691. [DOI] [PubMed] [Google Scholar]
- Farmer Teh C, Sorbero MJ, Mihalyo MJ, Kogan JN, Schuster J, Reynolds CF. Predictors of Adequate Depression Treatment among Medicaid-Enrolled Adults. Health Services Research. 2009;45(1):302–315. doi: 10.1111/j.1475-6773.2009.01060.x. [DOI] [PMC free article] [PubMed] [Google Scholar]
- Fleurbaey M, Schokkaert E. Unfair inequalities in health and health care. Journal of health economics. 2009;28(1):73–90. doi: 10.1016/j.jhealeco.2008.07.016. [DOI] [PubMed] [Google Scholar]
- Frank RG, Glied S. Better but not well: Mental health policy in the United States since 1950. Johns Hopkins Univ Pr; 2006. [Google Scholar]
- Frank RG, Goldman HH, McGuire TG. Trends in mental health cost growth: an expanded role for management? Health affairs. 2009;28(3):649–659. doi: 10.1377/hlthaff.28.3.649. [DOI] [PubMed] [Google Scholar]
- Gormley WT, Weimer DL. Organizational report cards. Harvard University Press; 1999. [Google Scholar]
- Health Resources and Services Administration (HRSA) Area Resource File (ARF) System. Fairfax, VA: Quality Resource Systems, Inc; 2008. Bureau of Health Professions. [Google Scholar]
- IOM. Confronting Racial and Ethnic Disparities in Health Care. Washington, DC: National Academies Press; 2002. Unequal Treatment. [PubMed] [Google Scholar]
- James J. Public Reporting on Quality and Costs. Do report cards and other measures of providers' performance lead to improved care and better choices by consumers. Health Affairs: At the Intersection of Health, Healthcare, and Policy. 2012;8 [Google Scholar]
- Manderscheid RW. From many into one: Addressing the crisis of quality in managed behavioral health care at the millennium. The Journal of Behavioral Health Services and Research. 1998;25(2):233–237. doi: 10.1007/BF02287484. [DOI] [PubMed] [Google Scholar]
- Mark T, McKusick D, King E, Harwood H, Genuardi J. National Expenditures for Mental Health, Alcohol and Other Drug Abuse Treatment. Rockville, MD: U.S. Department of Health and Human Services; 1996. [Google Scholar]
- Marshall M, Noble J, Davies H, Waterman H, Walshe K, Sheaff R. Development of an information source for patients and the public about general practice services: an action research study. Health Expectations. 2006;9(3):265–274. doi: 10.1111/j.1369-7625.2006.00394.x. [DOI] [PMC free article] [PubMed] [Google Scholar]
- Marshall MN, Romano PS, Davies HTO. How do we maximize the impact of the public reporting of quality of care? International Journal For Quality in Health Care. 2004;16(suppl 1):i57–i63. doi: 10.1093/intqhc/mzh013. [DOI] [PubMed] [Google Scholar]
- McGuire TG, Alegría M, Cook BL, Wells KB, Zaslavsky AM. Implementing the Institute of Medicine definition of disparities: an application to mental health care. Health Services Research. 2006;41(5):1979–2005. doi: 10.1111/j.1475-6773.2006.00583.x. [DOI] [PMC free article] [PubMed] [Google Scholar]
- Melfi CA, Chawla AJ, Croghan TW, Hanna MP, Kennedy S, Sredl K. The effects of adherence to antidepressant treatment guidelines on relapse and recurrence of depression. Archives of General Psychiatry. 1998;55(12):1128. doi: 10.1001/archpsyc.55.12.1128. [DOI] [PubMed] [Google Scholar]
- Miles M, Huberman AM. An expanded sourcebook: qualitative data analysis. 2nd. Thousand Oaks: Sage Publications; 1994. [Google Scholar]
- Mukamel DB, Mushlin AI. The impact of quality report cards on choice of physicians, hospitals, and HMOs: a midcourse evaluation. Joint Commission Journal on Quality and Patient Safety. 2001;27(1):20–27. doi: 10.1016/s1070-3241(01)27003-5. [DOI] [PubMed] [Google Scholar]
- National Alliance on Mental Illness. Grading the States. 2009 From http://www.nami.org/gtsTemplate09.cfm?Section=Grading_the_States_2009.
- National Institute of Mental Health. NIMH notice NOT-MH-10-021. Rockville, MD: National Institute of Mental Health; 2010. NIMH Announces Availability of Funds for Competitive Revision Applications for Targeted Research on Mental Health Disparities. http://grants.nih.gov/grants/guide/notice-files/NOT-MH-10-021.html. [Google Scholar]
- Patton MQ. Two Decades of Developments in Qualitative Inquiry A Personal, Experiential Perspective. Qualitative Social Work. 2002;1(3):261–283. [Google Scholar]
- Pawson R. Evidence and policy and naming and shaming. Policy studies. 2002;23(3):211–230. [Google Scholar]
- Romano PS, Rainwater JA, Antonius D. Grading the graders: how hospitals in California and New York perceive and interpret their report cards. Medical care. 1999;37(3):295. doi: 10.1097/00005650-199903000-00009. [DOI] [PubMed] [Google Scholar]
- Rosenheck R, Cicchetti D. A mental health program report card: a multidimensional approach to performance monitoring in public sector programs. Community Mental Health Journal. 1998;34(1):85–106. doi: 10.1023/a:1018720414126. [DOI] [PubMed] [Google Scholar]
- SAMHSA. Adverse Childhood Experiences. Substance Abuse and Mental Health Services Administration; 2014. [accessed on July 16, 2014]. Available at: http://captus.samhsa.gov/prevention-practice/targeted-prevention/adverse-childhood-experiences/1. [Google Scholar]
- Sequist TD, Fitzmaurice GM, Marshall R, Shaykevich S, Marston A, Safran DG. Cultural competency training and performance reports to improve diabetes care for black patients: a cluster randomized, controlled trial. Annals of internal medicine. 2010;152(1):40. doi: 10.7326/0003-4819-152-1-201001050-00009. [DOI] [PubMed] [Google Scholar]
- Shahian DM, Edwards FH, Jacobs JP, Prager RL, Normand SLT, Shewan CM. Public reporting of cardiac surgery performance: Part 2—implementation. The Annals of thoracic surgery. 2011;92(3):S12–S23. doi: 10.1016/j.athoracsur.2011.06.101. [DOI] [PubMed] [Google Scholar]
- Shahian DM, Normand SL, Torchiana DF, Lewis SM, Pastore JO, Kuntz RE. Cardiac surgery report cards: comprehensive review and statistical critique. The Annals of thoracic surgery. 2001;72(6):2155–2168. doi: 10.1016/s0003-4975(01)03222-2. [DOI] [PubMed] [Google Scholar]
- Shahian DM, Torchiana DF, Shemin RJ, Rawn JD, Normand SLT. Massachusetts cardiac surgery report card: implications of statistical methodology. The Annals of thoracic surgery. 2005;80(6):2106–2113. doi: 10.1016/j.athoracsur.2005.06.078. [DOI] [PubMed] [Google Scholar]
- Shonkoff JP. Science, policy, and practice: Three cultures in search of a shared mission. Child Development. 2000;71(1):181–187. doi: 10.1111/1467-8624.00132. [DOI] [PubMed] [Google Scholar]
- Shonkoff JP, Bales SN. Science does not speak for itself: Translating child development research for the public and its policymakers. Child Development. 2011;82(1):17–32. doi: 10.1111/j.1467-8624.2010.01538.x. [DOI] [PubMed] [Google Scholar]
- Smedley BD. Moving beyond access: achieving equity in state health care reform. Health Affairs. 2008;27(2):447. doi: 10.1377/hlthaff.27.2.447. [DOI] [PubMed] [Google Scholar]
- Teague GB, Ganju V, Hornik JA, Johnson JR, McKinney J. The MHSIP Mental Health Report Card A Consumer-Oriented Approach to Monitoring the Quality of Mental Health Plans. Evaluation Review. 1997;21(3):330–341. doi: 10.1177/0193841X9702100307. [DOI] [PubMed] [Google Scholar]
- Trivedi AN, Gibbs B, Nsiah-Jefferson L, Ayanian J, Prothrow-Stith D. Creating a state minority health policy report card. Health affairs. 2005;24(2):388–396. doi: 10.1377/hlthaff.24.2.388. [DOI] [PubMed] [Google Scholar]
- Trivedi AN, Grebla RC, Wright SM, Washington DL. Despite improved quality of care in the Veterans Affairs health system, racial disparity persists for important clinical outcomes. Health affairs. 2011;30(4):707–715. doi: 10.1377/hlthaff.2011.0074. [DOI] [PubMed] [Google Scholar]
- Tu JV, Austin PC. Cardiac Report Cards How Can They Be Made Better? Circulation. 2007;116(25):2897–2899. doi: 10.1161/CIRCULATIONAHA.107.745075. [DOI] [PubMed] [Google Scholar]
- Tu JV, Donovan LR, Lee DS, Wang JT, Austin PC, Alter DA. Effectiveness of Public Report Cards for Improving the Quality of Cardiac Care. JAMA: the journal of the American Medical Association. 2009;302(21):2330–2337. doi: 10.1001/jama.2009.1731. [DOI] [PubMed] [Google Scholar]
- U. S. Census Bureau. 2000 Census Summary File 1—United States, prepared by the U.S. Census Bureau 2001. Profile of selected social characteristics 2000 [Google Scholar]
- Wang PS, Demier O, Kessler R. Adequacy of treatment for serious mental illness in the United States. American Journal of Public Health. 2002;92(1):92–98. doi: 10.2105/ajph.92.1.92. [DOI] [PMC free article] [PubMed] [Google Scholar]
- Wang P, Lane M, Olfson M, Pincus H, Wells K, Kessler R. Twelve- Month Use of Mental Health Services in the United States. Archives of General Psychiatry. 2005;62(6):629–640. doi: 10.1001/archpsyc.62.6.629. [DOI] [PubMed] [Google Scholar]
- Weinick R, Caglia JM, Friedman E, Flaherty K. Measuring racial and ethnic health care disparities in Massachusetts. Health affairs. 2007;26(5):1293. doi: 10.1377/hlthaff.26.5.1293. [DOI] [PubMed] [Google Scholar]
- Weinick R, Hasnain-Wynia R. Quality Improvement Efforts Under Health Reform: How To Ensure That They Help Reduce Disparities—Not Increase Them. Health affairs. 2011;30(10):1837–1843. doi: 10.1377/hlthaff.2011.0617. [DOI] [PubMed] [Google Scholar]
- Wells K, Sherbourne CD, Schoenbaum M, Duan N, Meredith LS, Unutzer J. The impact of disseminating quality improvement programs for depression in managed primary care: A randomized controlled trial. Journal of the American Medical Association. 2000;283(2):212–220. doi: 10.1001/jama.283.2.212. [DOI] [PubMed] [Google Scholar]
- Werner RM, Asch DA. The unintended consequences of publicly reporting quality information. JAMA: the journal of the American Medical Association. 2005;293(10):1239–1244. doi: 10.1001/jama.293.10.1239. [DOI] [PubMed] [Google Scholar]
- Williams D, Rucker T. Understanding and addressing racial disparities in health care. Health Care Financing Review. 2000;21(4):75–90. [PMC free article] [PubMed] [Google Scholar]