Fig 2.

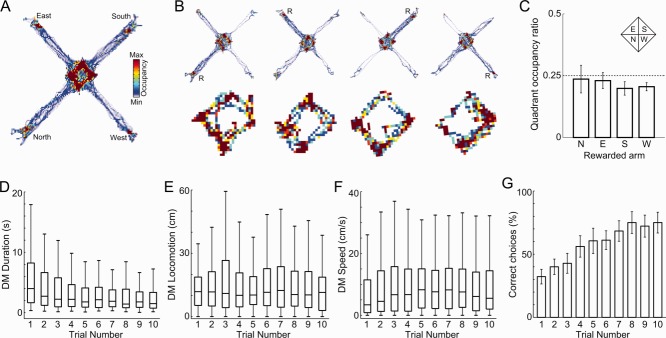
Behavioral characteristics in the spatial choice task. A: Spatial occupancy for a representative session. B: (Top row) Occupancy in each of the 10-trial blocks in the same session; “R” indicates reward location. (Bottom row) Zoomed in view of spatial occupancy of the central part of the maze during the last 10 s of the intertrial interval. C: Group result of quadrant occupancy ratio, defined as the time spent in the quadrant associated with the rewarded arm divided by the time spent in the other quadrants (see inset for quadrant boundaries). Notice that animals have no preference for the quadrant associated with the rewarded arm during the intertrial interval (P > 0.05, Student's t-test for each occupation ratio against 0.25). D–F: Distribution of DM duration (D), distance traveled (E), and speed (F) during DM across trials. G: Percentage of correct choices on each trial (mean ± SEM over animals). [Color figure can be viewed in the online issue, which is available at wileyonlinelibrary.com.]
