

Abstract
Background
Several recurrent copy number variants (CNVs) have been shown to increase the risk of developing schizophrenia (SCZ), developmental delay (DD), autism spectrum disorders (ASD) and various congenital malformations (CM). Their penetrance for SCZ has been estimated to be modest. However, comparisons between their penetrance for SCZ or DD/ASD/CM, or estimates of the total penetrance for any of these disorders have not been made yet.
Methods
We use data from the largest available studies on SCZ and DD/ASD/CM, including a new sample of 6882 cases and 6316 controls, to estimate the frequencies of 70 implicated CNVs, in carriers with these disorders, in healthy controls and in the general population. On the basis of these frequencies we estimate their penetrance. We also estimate the strength of the selection pressure against CNVs and correlate this against their overall penetrance.
Results
The rates of nearly all CNVs are higher in DD/ASD/CM, compared to SCZ. The penetrance of CNVs is at least several times higher for the development of a disorder from the group of DD/ASD/CM. The overall penetrance of SCZ-associated CNVs for developing any disorder is high, ranging between 10.6% and 100%.
Conclusions
CNVs associated with SCZ have high pathogenicity. The majority of the increased risk conferred by CNVs is towards the development of an earlier-onset disorder, such as DD/ASD/CM, rather than SCZ. The penetrance of CNVs correlates strongly with their selection coefficients. The improved estimates of penetrance will provide crucial information for genetic counselling.
Keywords: CNV, schizophrenia, penetrance, developmental delay, autism spectrum disorder, selection
Introduction
A number of rare genomic rearrangements, called copy number variants (CNVs) have been shown to increase the risk of developing early-onset neurodevelopmental disorders. These were first identified in patients with characteristic and recognizable syndromic features, e.g. Williams–Beuren syndrome, Smith–Magenis syndrome, Sotos syndrome, DiGeorge/Velo Cardio Facial syndrome. Over the last few years, with the introduction of high-throughput microarray technologies, more CNVs of smaller size and incomplete penetrance have also been identified. Some of these have been shown to also increase the risk of developing SCZ, ASD and other neuropsychiatric disorders. For example, in 2008–2009, a deletion at 15q13.3 was shown to increase the risk of developing DD(1), SCZ(2, 3), epilepsy(4) and autism(5). Similar findings of increased risk for developing SCZ, DD and ASD were made for deletions at 1q21.1 and 15q11.2 and duplications at 16p11.2 and 16p13.11 (reviewed by Malhotra&Sebat (6). A number of CNVs have now been consistently associated with SCZ and each of them also increases the risk for the group of DD/ASD/CM (6–9).
The number of CNVs known to increase the risk of developing a disorder from the group of DD/ASD/CM is higher than those implicated in SCZ. Thus Girirajan et al (7) tested 32,587 samples from children who had DD or ASD with or without CM for 72 CNV regions (39 deletions and 33 reciprocal duplications) which had previously been implicated in neurodevelopmental phenotypes or genomic disorders, and including 9 of uncertain pathogenic significance. When compared with a set of 8,329 healthy controls, 38 of them (25 deletions and 13 duplications) were nominally statistically associated with the disorders (at p<0.05) and several more showed trends that might also represent true associations, if tested in larger samples. Similar results were reported by Kaminsky et al (8) on 15,749 individuals who presented for diagnostic array testing with abnormal clinical phenotypes including DD, intellectual deficit, ASD, and/or multiple CM. These authors reported that 21 CNV regions (14 deletions and 7 duplications) were significantly associated with one or more of these disorders.
It is clinically important to know the risk to carriers of these CNVs for developing each of the possible associated disorders (i.e. their penetrance). Vassos et al (9) were the first to estimate the penetrance for SCZ for seven CNVs that had been shown to increase risk for this disorder. They found rather modest rates of 2%–7.4% except for the VCFS deletion on 22q11.2 which had a much higher penetrance of 55%, though with very broad confidence intervals, as no CNV was observed in controls. The authors concluded that these CNVs were neither necessary, nor sufficient to cause the disorder and that the level of penetrance was not sufficient for them to be considered as useful clinical tools in genetic counselling, diagnosis and testing. However they pointed out that the overall penetrance for any neuropsychiatric disorder was likely to be much higher. The penetrance of 12 CNVs for DD/ASD/CM was estimated by Rosenfeld et al, (10). Estimates of the risk for an abnormal phenotype ranged from 10.4% for 15q11.2 deletions to 62.4% for distal 16p11.2 deletions. These values are much higher than those for SCZ. The most highly penetrant CNVs were not tested, as their absence in controls prevented accurate estimates.
Here we estimate the penetrance of all CNVs listed in the Girirajan et al (7) paper. Nearly all SCZ-associated CNVs are on this list as well, and we only added exonic deletions at NRXN1, a gene consistently implicated in SCZ(11–13). We performed estimates for both SCZ and the group of early onset developmental disorders: DD/ASD/CM. This joint analysis allowed us to provide estimates for each CNV, even for those that are never found in SCZ, or in healthy controls. We use a large new sample of cases and controls, and add to this the data from the two largest previous studies on SCZ, or from previous meta-analyses, in order to derive more reliable estimates.
Methods
Choice of CNVs
We analysed CNVs previously associated with SCZ or severe neurodevelopmental phenotypes. These were taken from the list of CNV regions proposed by Girirajan et al (7): 37 deletions and 32 reciprocal duplications, after excluding an overlapping segment at 17p13.3 and a CNV on the X-chromosome, as the X-chromosome was not analysed in our samples. Most of the strongly implicated SCZ-associated CNVs are on this list, but we added exonic deletions at NRXN1. For some of the analyses we focus on CNVs that we regard as associated with SCZ (Table 1), based on the review by Malhotra&Sebat (6), with the addition of NRXN1 and newly implicated loci (Supplementary material Table S2). We did not analyse other SCZ-implicated loci (e.g. VIPR2 duplications), as they have not been tested in sufficiently large samples of DD/ASD/CM or have not received consistent support.
Table 1.
Frequencies and penetrance for the SCZ-associated CNVs only. The full list of CNVs is presented in Supplementary Material, Table S4.
| locus | Selection coefficient | Frequency % | Penetrance % (95%CI) | |||||
|---|---|---|---|---|---|---|---|---|
| controls | SCZ | DD/ASD/CM | general population | SCZ | DD/CM/ASD | Total | ||
| 1q21.1 del | 0.26 | 0.021 | 0.17 | 0.29 | 0.033 | 5.2 (2.5–11) | 35 (18–67) | 40 (20–78) |
| 1q21.1 dup | 0.23 | 0.038 | 0.13 | 0.2 | 0.045 | 2.9 (1.3–6.3) | 18 (10–33) | 21 (11–39) |
| NRXN1 del | 0.23 | 0.02 | 0.18 | 0.18 | 0.028 | 6.4 (2.5–8.3) | 26 (16–80) | 33 (18–88) |
| 3q29 del | 0.83 | 0.0014 | 0.082 | 0.061 | 0.0046 | 18 (4.7–67) | 53 (15–100) | 71 (20–100) |
| WBS dup | 0.61 | 0.0058 | 0.066 | 0.12 | 0.011 | 6.0 (1.4–20) | 44 (13–100) | 50 (14–100) |
| 15q11.2 del | 0.09 | 0.28 | 0.59 | 0.81 | 0.3 | 2.0 (1.4–2.7) | 11 (8.2–14) | 13 (9.6–17) |
| Prader-Willi/Angelman dup | 0.5 | 0.0083 | 0.079 | 0.25 | 0.019 | 4.2 (1.4–12) | 54 (25–100) | 58 (26–100) |
| 15q13.3 del | 0.31 | 0.019 | 0.14 | 0.26 | 0.03 | 4.7 (2.2–9.9) | 35 (19–62) | 40 (21–72) |
| 16p13.11 dup | 0.13 | 0.13 | 0.31 | 0.3 | 0.14 | 2.2 (1.3–3.7) | 8.4 (5.7–13) | 10.6 (7–17) |
| 16p11.2 distal del | 0.29 | 0.018 | 0.063 | 0.14 | 0.024 | 2.6 (0.8–9.2) | 23 (8.4–63) | 26 (9.2–72) |
| 16p11.2 dup | 0.33 | 0.03 | 0.35 | 0.28 | 0.043 | 8.0 (4.3–14) | 26 (18–43) | 34 (22–57) |
| 17q12 del | 0.68 | 0.0054 | 0.036 | 0.087 | 0.009 | 4.0 (0.8–18) | 39 (13–100) | 43 (14–100) |
| DiGeorge/VCFS del | 0.8 | 0 | 0.29 | 0.54 | 0.024 | 12 (6.5–18) | 88 (53–100) | 100 (60–100) |
Estimating the rate of CNVs in different disorders
We only included data from the largest studies/samples available, in order to simplify the presentation. The numbers below are those after exclusion of poorly performing arrays and duplicate samples. A CNV was called as covering a CNV locus if it spanned >50% of the commonly affected region (Table S2). In the case of loci that include only single genes (NRXN1, SIM1, YWHAE, PAFAH1B1 and NF1), we accepted CNVs that intersected at least one exon of the gene.
The rates of CNVs in DD/ASD/CM are taken from the largest study on these phenotypes: 32,587 patients referred for genetic testing to one laboratory (Signature Genomics) described by Girirajan et al (7). For some of the loci the reported sample numbers are smaller (23,380), for others they are larger (33,226) as the same team subsequently published data on several CNVs in an enlarged dataset (10).
For SCZ cases we analysed three large datasets where we had access to the raw data, for a total of at least 13,465 cases (and more for the SCZ-associated loci, see below): 1) 6882 patients from our new CLOZUK and CardiffCOGS samples, (Supplementary material), 2) 3391 cases from the International Schizophrenia Consortium study (ISC, 2008)(2) and 3) 3192 cases from the Molecular Genetics of Schizophrenia (MGS) study (dbGAP accession numbers phs000167.v1.p1 and phs000021.v3.p2).
For controls we analysed samples from four publicly available datasets genotyped with high-resolution Illumina arrays, similar to our new SCZ sample and analysed by us with the same methods. These include individuals who took part in a study on smoking cessation in the USA (N = 1488); in a study on melanoma in the USA (N= 2971); in a study on refractive error, (KORA study) from Germany (N = 1857) and the Wellcome Trust Case Control Consortium (WTCCC2) in the UK (N=4939). To those we added 3181 controls from the ISC and 3437 controls from the MGS studies listed above, for a total of 17,873 controls. For the SCZ-associated loci we added data from previous studies, as reviewed by Malhotra&Sebat(6) or presented in the relevant papers that implicated them (Supplementary material, Table S2). For these loci we excluded our WTCCC2 controls, as they are completely or partially included in the previous reviews.
Estimation of the penetrance was performed with an adaptation of the method proposed by Vassos et al (9). These authors estimated the penetrance as the probability of developing the disease (D) for individuals carrying the CNV (G) with the following formula:
In that formula D̄ denoted controls who do not have SCZ, and P(D) is the lifetime morbid risk for SCZ. Instead of using one single disease population and controls, we substitute the denominator with the estimate of the CNV frequency in the general population (P(CNV general)) which includes patients with SCZ and the group of DD/ASD/CM. The frequency in the general population is therefore likely to be higher than the rate among controls.
Estimating the frequency of the CNV in the general population
The method is described in our previous publication (14). Briefly, we have to take into account that if a CNV has a high penetrance for disorders that are under-represented among populations recruited as healthy controls (e.g. DD/SCZ/CM), then the measured frequency of that CNV among healthy controls will be an underestimate of the population frequency. To minimise this effect, we take into account the rate of these CNVs in all disorders that are likely to be excluded from ‘control’ populations. The overall frequency of a CNV in the general population P(CNV general) is therefore:
(i.e. the sum of the products of the conditional probabilities of being a carrier of the CNV given the phenotype, and the proportion of people with this phenotype in the population). We accepted a frequency of SCZ in the population of 1%. The frequency of DD/ASD/CM was approximated at 4%. The 4% figure is a compromise based on the figure of 5.12% for the total frequency of diseases with an important genetic component, proposed by Baird et al (15). This latter figure was used by Rosenfeld et al (10) for calculating the penetrance of CNVs. However it includes some individuals with psychosis, and some with disorders that are unlikely to be referred for genetic testing, as in the population investigated by Girirajan et al (7). A lower end of the frequency of these disorders could be the sum of the widely accepted rates of 2% for DD(16) and 1% for ASD(17, 18), i.e. 3%, the number that we used in our previous publication(14). Therefore we accepted 4% as a reasonable compromise that also includes some congenital malformations. As will be seen later, even large errors in these estimates make very little difference to our conclusions, as the combined rate of DD/ASD/CM in the population is still several times higher than that of SCZ under any assumptions.
Therefore the frequency of a CNV in the general population can be expressed as the sum of the frequencies among healthy controls, (comprising 95% of the general population that excludes the disorders) + the frequency among SCZ, (comprising 1% of the general population) + the frequency among the DD/ASD/CM patients, (comprising the remaining 4% of the general population):
The penetrance for SCZ (in the range of 0–1) then simplifies to:
And the penetrance for DD/ASD/CM simplifies to:
The total penetrance for any of these disorders is simply the sum of those for SCZ and DD/ASD/CM.
To illustrate the method, we provide an example of the penetrance of the 1q21.1 deletion. It is found in 0.021% of reported controls, in 0.17% of SCZ patients and 0.24% of patients affected with DD/ASD/CM (Table 1). That results in a frequency in the general population of 0.033%: (0.00021 × 0.95) + (0.0017 × 0.01) + (0.0029 × 0.04) = 0.00033. (Note that this rate is higher than the frequency among healthy controls). The penetrance values are expressed as % in the text and tables.
As some of the CNVs are extremely rare, or even absent in controls, we provide the 95% confidence intervals (95%CI) of the penetrance values, which can be very wide in such instances. These were estimated by first producing binomial confidence intervals for the frequencies of CNVs in each population, using the Wilson score interval(19). Upper and lower 95% bounds for penetrance were estimated from the upper bounds of CNV frequencies in patients and the lower bounds of the frequencies in the general population (and vice versa for the lower bounds). The details for each CNV are presented in the Supplementary material Table S4.
Estimating the selection coefficients acting against CNVs was performed with the method we presented before (14). Briefly this equates to the proportion of the observed de novo CNVs in a population, out of the total number of CNVs observed in that population (de novo + inherited). We updated our previous estimates with new data published since and added loci that were not part of our previous paper (Supplementary material, Table S3).
Results
The rates of CNVs among subjects affected with SCZ, those with DD/ASD/CM and healthy controls are presented in Figure 1 and the full details in the Supplementary Material, Table S2 and S4. Almost all CNVs have higher rates in the DD/ASD/CM group, compared to SCZ. The instances where these differences are significantly higher are indicated with asterisks in Figure 1. The only occasions where the rates in SCZ patients are higher are for the 16p11.2 duplication, 3q29 deletion, 16p13.11 duplication and the “smaller 15q13.3 (CHRNA7)” duplication, but these differences are very small and not significant. In contrast, there are numerous occasions of CNVs that are much more frequent in DD/ASD/CM, some differences are highly significant, and some CNVs have not yet been reported in SCZ cases.
Figure 1.

Frequencies of CNVs among individuals with SCZ (grey) and the group of DD/ASD/CM (black). Deletions are on the left and duplications on the right of the figure.
* p<0.05
** p<0.001
*** p<0.00001
The differences between the penetrance of CNVs for the different disorders are even more striking (Figure 2 and Supplementary Material, Table S4). For CNVs that are never observed in controls, the joint penetrance reaches 100% but we should point out that for some of the cases with 100% penetrance, the 95%CI are very large, (Supplementary Material, Table S4). It is known that the penetrance for some syndromic disorders, like PWS/AS, is indeed nearly complete (i.e. they are not found in healthy controls), and they are not found in SCZ subjects either. Their 95%CI are tighter.
Figure 2.

Penetrance of CNVs. The layout is the same as for Figure 1.
Psychiatrists are likely to be more interested in the penetrance of SCZ-associated CNVs. Therefore we present them separately in Figure 3 and Table 1. All of them have much higher penetrance for DD/ASD/CM, than for SCZ. The frequency of a CNV (and therefore its penetrance) separately for ASD, or for DD, or for specific CM will of course differ for each CNV, and is not known in each case. This remains to be established in the future and is not the topic of this paper. The total penetrance for any disorder (including SCZ) for this set of CNVs ranges from 10.6% for the 16p13.11 duplication to 100% for the VCFS deletion, (mean of 41%). The 95%CI for this set of CNVs are much tighter, as they have been tested in larger numbers of controls, and therefore the penetrance estimates are more reliable.
Figure 3.

Penetrance of SCZ-associated CNVs for SCZ (grey) and DD/ASD/CM (black).
The selection coefficients for the CNVs, and the sources we used to derive them, are presented in Supplementary material, Table S3. Our data are insufficient for a confident estimate of the selection coefficients for many of the CNVs, so for our comparison with the penetrance data, we only use CNVs where at least 5 observations on their inheritance status are available from systematically conducted studies. The results are shown in Figure 4a. The strength of selection against CNVs correlated strongly with their overall penetrance for any disorder, Pearson correlation: r = 0.51, p = 0.001. There are some obvious exceptions to the rule, with CNVs that are not seen in controls (and therefore have a penetrance of 100%), that have only modest selection coefficients. As a rule these exceptions are based on smaller number of observations and have very wide 95%CI, up to 0–100% (Supplementary material, Table S4). We therefore excluded CNVs with a penetrance of 100%, that have lower bounds of the 95%CI below 10% (an arbitrarily chosen cut-off). Most of the outliers disappeared (Figure 4b), and the correlation increased to r = 0.83, p < 10−6.
Figure 4.
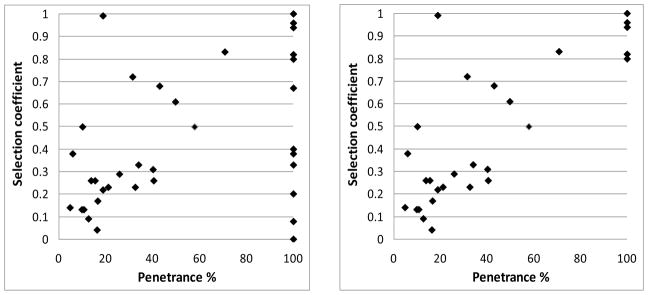
Correlation between the overall penetrance and selection coefficients of CNVs. 4a: all data; 4b: excluding data with very wide 95% confidence intervals, see text.
Discussion
The role of CNVs in the pathogenesis of SCZ and developmental disorders is well established(6–8, 20). The penetrance of some of these CNVs has been estimated before, but separately for these disorders(9, 10). The estimates for SCZ(9) had produced modest rates of 2%–7.4% for seven SCZ-associated CNVs (excluding the 22q11.2 deletion). The estimates for DD/ASD/CM(10) for a small subset of CNVs produced higher estimates of 10% – 62%, but only three loci overlapped between these studies. Our estimates for the penetrance and the 95%CI for the two phenotypes are reassuringly similar to these previous reports: Pearson correlation of 0.82 for SCZ and 0.68 for DD/ASD/CM (Supplementary Material, Table S5). The only exception is the 22q11.2 deletion where the penetrance for SCZ was estimated at 55% by Vassos et al, (10) and 12% by us. However, these authors pointed out that the credible intervals for this CNV were broad, as no CNV was observed in a control, and they relied on simulations. Accurate data on DD/ASD/CM were not available at that time, and these hugely help the estimates. As our results are based on larger sample sizes for every CNV tested, they are likely to be more accurate. Even for CNVs that are found at similar rates in the two phenotypes, the penetrance is several times higher for the DD/ASD/CM group. This is because the population frequency of the group of DD/ASD/CM is ~4 times higher in the general population, indicating that even in those cases where the rate of a CNV is similar, still about 4 times more CNV carriers will develop a DD/ASD/CM phenotype, instead of SCZ. Even large errors in our assumptions for the population frequencies of SCZ and the group of DD/ASD/CM cannot change the conclusion that the penetrance is higher for the group of DD/ASD/CM.
Different arrays have been used in the studies and therefore we have to ensure that this did not create the differences we observe. The CNV frequencies in SCZ cases and controls are based on similar or identical arrays. Thus, the ISC and MGS samples have both cases and controls of similar numbers, and they have been genotyped on the same (Affymetrix) arrays, while the CLOZUK/CardiffCOGS and the corresponding controls from the smoking, melanoma, Kora and WTCCC2 studies were analysed with only the 520,766 overlapping probes on Illumina arrays (Supplementary Material, Table S1). The data on the DD/ASD/CM samples is based on different, custom-made, whole-genome, bacterial artificial chromosome versions or oligonucleotide-based arrays(7, 10). These arrays have fewer probes than those used for the SCZ cases and controls, and as a consequence, could have a lower resolution. Therefore, if CNVs had been under-detected on the custom-made arrays, the differences we find would be even higher. In any case, most CNVs tested are large and should be detected on any of these arrays. We made sure that even the limited number of small CNVs analysed in the DD/ASD/CM samples (those for single genes), were covered with sufficient number of probes from the list of probes common on all Illumina arrays used in our study, and would thus be detected on these arrays too. As presented in Supplementary Material, Table S2, only a small number of CNVs are covered with fewer than 15 probes on the Illumina arrays, and these CNVs are not relevant for our conclusions. Even more reassuringly, the most striking differences between DD/ASD/CM and SCZ are found for very large CNVs, that should be detected on any arrays (e.g. the deletions at the AS/PWS and WBS regions, at 1p36, 16p11.2, 17q21.31 and the duplications at 22q11.2 and 22q13 that show differences at p<10−5) are covered with at least 80 probes (Supplementary Material, Table S2).
The rather modest penetrance values produced for SCZ in the previous literature have been taken as evidence that these CNVs have low penetrance and are neither sufficient, nor necessary for the development of SCZ. The current data highlights the point that most of these CNVs are in fact highly pathogenic, but the phenotype that they produce is more likely to be another developmental disorder, such as DD or ASD. Thus the average penetrance for the SCZ-associated CNVs from Table 1 is 41% for developing any of the disorders discussed here, ranging from 10.6% (95%CI = 7–17%) for the 16p13.11 duplication, to 100% (95%CI = 60–100%) for the VCFS deletion. These are very substantial increases in risk for developing a serious disorder, such as SCZ, DD, ASD, and certain CM. As not all controls have been screened for neuropsychiatric phenotypes, it is possible that some carriers of CNVs from the control populations also have some subtle phenotypes, which would result in even higher penetrance estimates, so our figures might even be an underestimate. The high pathogenicity of these CNVs is supported by the estimates of high selection pressure that operates against them, and the two show a striking correlation (Figure 4b), despite being derived at with different methods (one based of frequencies, the other on de novo ratios). The increase in risk to develop one of these disorders appears to result in a similar increase in the selection pressure against their carriers. This indicates that the selection coefficient (the de novo ratio) is a good predictor for the penetrance of a CNV, and vice versa. For many of the 70 CNVs discussed here, the number of observations used for the de novo ratios or for the frequencies are too small, leading to unreliable estimates for the penetrance and selection coefficients. These estimates should be refined in future studies.
Additional disorders that have not been specifically discussed above, but are also reported in carriers of these CNVs include among others epilepsy(4) and ADHD(21). It is not the scope of this paper to discuss the exact range of phenotypic presentations of each of these CNVs. They are variable, and in some cases are not yet reliably established. What is more important is the fact that the presence of one of these CNVs has consequences for genetic counselling and diagnosis. As the penetrance for a severe neurodevelopmental disorder among children of carriers is >10%, this raises important questions in a genetic counselling setting, as the offspring of carriers who inherit one of these CNVs (Table 1) will have a risk for developing one of these disorders of between 10%–100% (ignoring any additional risk from other inherited genetic variants). This will be in most instances higher than the 12.8%–15% risk among children of SCZ patients in general(22). The presence in a patient of most other CNVs from the list proposed by Girirajan et al (7) should also be considered to be important for the diagnosis and management of the person. There are some notable exceptions to the rule: for example the “smaller 15q13.3” duplication is present at equal rates in cases and controls and is not considered pathogenic by us or by Girirajan et al (7).
A question that arises is what determines the neurodevelopmental trajectory towards SCZ or severe developmental delay/intellectual disability for carriers of the same CNV. One possible explanation is the presence of a second large and rare CNV among carriers of pathogenic CNVs (7). We tested this hypothesis on the subset of SCZ-associated CNVs, as these are the CNVs where we have sufficient numbers to produce valid results (many of the most pathogenic CNV loci analysed by Girirajan et al (7) are not hit by CNVs in SCZ patients). We used the same criteria to define a “second hit”, as suggested by Girirajan et al (7): large (>500kb) and very rare CNVs (<0.1% frequency in control populations), or a known pathogenic CNV (from the list of 70 CNV, Table S2), even if <500kb. The rate of such “second hits” (Table S6) was however, nearly identical for patients with SCZ and those with DD/ASD/CM, at 10% vs. 9.3%, (p = 0.74), indicating that the presence of a second hit CNV is not the factor that usually determines the phenotype of carriers.
The current study also strengthens the now established evidence of a genetic overlap between DD, ASD and SCZ, at least for a sub-set of CNVs. It appears that some CNVs are so highly pathogenic and penetrant, that they cause earlier onset disorders (DD/ASD) and not SCZ. Indeed, severe DD or ASD, particularly in the presence of a clear chromosomal syndrome, is likely to preclude a clinical diagnosis of SCZ. These are for example the Angelman/Prader-Willi Syndrome, Williams-Beuren Syndrome and the 1q36 deletion syndrome. Other CNVs can present with DD/ASD, or later in life lead to SCZ (Table 1). They still have a much higher penetrance for an early-onset disorder (Figure 3). No CNV from this list specifically increases risk to develop SCZ, rather than DD/ASD/CM.
Supplementary Material
Acknowledgments
The 6882 SCZ samples from the “current study” were genotyped at the Broad Institute, USA, funded by a philanthropic gift to the Stanley Center for Psychiatric Research.
We thank the participants and clinicians who took part in the Cardiff COGS study. This work was supported by a clinical research fellowship to JTRW from the MRC/Welsh Assembly Government and the Margaret Temple Award from the British Medical Association. We acknowledge Andrew Iles, David Parslow, Carissa Philipart and Sophie Canton for their work in recruitment, interviewing and rating. For the CLOZUK sample we thank Novartis for their guidance and co-operation. We also thank staff at The Doctor’s Laboratory, in particular Lisa Levett and Andrew Levett, for help and advice regarding sample acquisition. We acknowledge Kiran Mantripragada, Lesley Bates, Catherine Bresner and Lucinda Hopkins for laboratory sample management.
The work at Cardiff University was funded by Medical Research Council (MRC) Centre (G0800509) and Program Grants (G0801418) and the European Community’s Seventh Framework Programme (HEALTH-F2-2010-241909 (Project EU-GEI), and an MRC PhD Studentship to ER.
The authors acknowledge the contribution of data from outside sources:
1) Genetic Architecture of Smoking and Smoking Cessation accessed through dbGAP: Study Accession: phs000404.v1.p1. Funding support for genotyping, which was performed at the Center for Inherited Disease Research (CIDR), was provided by 1 X01 HG005274-01. CIDR is fully funded through a federal contract from the National Institutes of Health to The Johns Hopkins University, contract number HHSN268200782096C. Assistance with genotype cleaning, as well as with general study coordination, was provided by the Gene Environment Association Studies (GENEVA) Coordinating Center (U01 HG004446). Funding support for collection of datasets and samples was provided by the Collaborative Genetic Study of Nicotine Dependence (COGEND; P01 CA089392) and the University of Wisconsin Transdisciplinary Tobacco Use Research Center (P50 DA019706, P50 CA084724).
2) High Density SNP Association Analysis of Melanoma: Case-Control and Outcomes Investigation, dbGaP Study Accession: phs000187.v1.p1: Research support to collect data and develop an application to support this project was provided by 3P50CA093459, 5P50CA097007, 5R01ES011740, and 5R01CA133996.
3) Genetic Epidemiology of Refractive Error in the KORA Study, dbGaP Study Accession: phs000303.v1.p1. Principal Investigators: Dwight Stambolian, University of Pennsylvania, Philadelphia, PA, USA; H. Erich Wichmann, Institut für Humangenetik, Helmholtz-Zentrum München, Germany, National Eye Institute, National Institutes of Health, Bethesda, MD, USA. Funded by R01 EY020483, National Institutes of Health, Bethesda, MD, USA.
4) WTCCC2 study: Samples were downloaded from https://www.ebi.ac.uk/ega/. And include samples from the National Blood Donors Cohort, EGAD00000000024 and samples from the 1958 British Birth Cohort, EGAD00000000022. Funding for these projects was provided by the Wellcome Trust Case Control Consortium 2 project (085475/B/08/Z and 085475/Z/08/Z), the Wellcome Trust (072894/Z/03/Z, 090532/Z/09/Z and 075491/Z/04/B) and NIMH grants (MH 41953 and MH083094)
5) Molecular Genetics of Schizophrenia (MGS) study, Funding support for the Genome-Wide Association of Schizophrenia Study was provided by the National Institute of Mental Health (R01 MH67257, R01 MH59588, R01 MH59571, R01 MH59565, R01 MH59587, R01 MH60870, R01 MH59566, R01 MH59586, R01 MH61675, R01 MH60879, R01 MH81800, U01 MH46276, U01 MH46289 U01 MH46318, U01 MH79469, and U01 MH79470) and the genotyping of samples was provided through the Genetic Association Information Network (GAIN). The datasets used for the analyses described in this manuscript were obtained from the database of Genotypes and Phenotypes (dbGaP) found at http://www.ncbi.nlm.nih.gov/gap through dbGaP accession numbers phs000021.v3.p2 and phs000167.v1.p1. Samples and associated phenotype data for the Genome-Wide Association of Schizophrenia Study were provided by the Molecular Genetics of Schizophrenia Collaboration (PI: Pablo V. Gejman, Evanston Northwestern Healthcare (ENH) and Northwestern University, Evanston, IL, USA).
Footnotes
Financial Disclosures: The authors report no biomedical financial interests or potential conflicts of interest.
Bibliography
- 1.Sharp AJ, Mefford HC, Li K, Baker C, Skinner C, Stevenson RE, et al. A recurrent 15q13.3 microdeletion syndrome associated with mental retardation and seizures. Nat Genet. 2008;40:322–328. doi: 10.1038/ng.93. [DOI] [PMC free article] [PubMed] [Google Scholar]
- 2.International Schizophrenia Consortium ISC. Rare chromosomal deletions and duplications increase risk of schizophrenia. Nature. 2008;455:237–241. doi: 10.1038/nature07239. [DOI] [PMC free article] [PubMed] [Google Scholar]
- 3.Stefansson H, Rujescu D, Cichon S, Pietilainen OPH, Ingason A, Steinberg S, et al. Large recurrent microdeletions associated with schizophrenia. Nature. 2008;455:232–236. doi: 10.1038/nature07229. [DOI] [PMC free article] [PubMed] [Google Scholar]
- 4.Helbig I, Mefford HC, Sharp AJ, Guipponi M, Fichera M, Franke A, et al. 15q13.3 microdeletions increase risk of idiopathic generalized epilepsy. Nat Genet. 2009;41:160–162. doi: 10.1038/ng.292. [DOI] [PMC free article] [PubMed] [Google Scholar]
- 5.Miller DT, Shen Y, Weiss LA, Korn J, Anselm I, Bridgemohan C, et al. Microdeletion/duplication at 15q13.2q13.3 among individuals with features of autism and other neuropsychiatric disorders. J Med Genet. 2009;46:242–248. doi: 10.1136/jmg.2008.059907. [DOI] [PMC free article] [PubMed] [Google Scholar]
- 6.Malhotra D, Sebat J. CNVs: Harbingers of a Rare Variant Revolution in Psychiatric Genetics. Cell. 2012;148:1223–1241. doi: 10.1016/j.cell.2012.02.039. [DOI] [PMC free article] [PubMed] [Google Scholar]
- 7.Girirajan S, Rosenfeld JA, Coe BP, Parikh S, Friedman N, Goldstein A, et al. Phenotypic Heterogeneity of Genomic Disorders and Rare Copy-Number Variants. N Engl J Med. 2012;367:1321–1331. doi: 10.1056/NEJMoa1200395. [DOI] [PMC free article] [PubMed] [Google Scholar]
- 8.Kaminsky EB, Kaul V, Paschall J, Church DM, Bunke B, Kunig D, et al. An evidence-based approach to establish the functional and clinical significance of copy number variants in intellectual and developmental disabilities. Genet Med. 2011;13:777–784. doi: 10.1097/GIM.0b013e31822c79f9. [DOI] [PMC free article] [PubMed] [Google Scholar]
- 9.Vassos E, Collier DA, Holden S, Patch C, Rujescu D, St Clair D, et al. Penetrance for copy number variants associated with schizophrenia. Hum Mol Genet. 2010;19:3477–3481. doi: 10.1093/hmg/ddq259. [DOI] [PubMed] [Google Scholar]
- 10.Rosenfeld JA, Coe BP, Eichler EE, Cuckle H, Shaffer LG. Estimates of penetrance for recurrent pathogenic copy-number variations. Genet Med. 2013;15:478–481. doi: 10.1038/gim.2012.164. [DOI] [PMC free article] [PubMed] [Google Scholar]
- 11.Kirov G, Gumus D, Chen W, Norton N, Georgieva L, Sari M, et al. Comparative genome hybridization suggests a role for NRXN1 and APBA2 in schizophrenia. Hum Mol Genet. 2008;17:458–465. doi: 10.1093/hmg/ddm323. [DOI] [PubMed] [Google Scholar]
- 12.Kirov G, Rujescu D, Ingason A, Collier DA, O’Donovan MC, Owen MJ. Neurexin 1 (NRXN1) Deletions in Schizophrenia. Schizophr Bull. 2009;35:851–854. doi: 10.1093/schbul/sbp079. [DOI] [PMC free article] [PubMed] [Google Scholar]
- 13.Rujescu D, Ingason A, Cichon S, Pietiläinen OP, Barnes MR, Toulopoulou T, et al. Disruption of the neurexin 1 gene is associated with schizophrenia. Hum Mol Genet. 2009;18:988–996. doi: 10.1093/hmg/ddn351. [DOI] [PMC free article] [PubMed] [Google Scholar]
- 14.Rees E, Moskvina V, Owen MJ, O’Donovan MC, Kirov G. De Novo Rates and Selection of Schizophrenia-Associated Copy Number Variants. Biol Psychiatry. 2011;70:1109–1114. doi: 10.1016/j.biopsych.2011.07.011. [DOI] [PubMed] [Google Scholar]
- 15.Baird PA, Anderson TW, Newcombe HB, Lowry RB. Genetic disorders in children and young adults: a population study. Am J Hum Genet. 1988;42:677. [PMC free article] [PubMed] [Google Scholar]
- 16.Raynham H, Gibbons R, Flint J, Higgs D. The genetic basis for mental retardation. QJM. 1996;89:169–176. doi: 10.1093/qjmed/89.3.169. [DOI] [PubMed] [Google Scholar]
- 17.Baird G, Simonoff E, Pickles A, Chandler S, Loucas T, Meldrum D, et al. Prevalence of disorders of the autism spectrum in a population cohort of children in South Thames: the Special Needs and Autism Project (SNAP) The Lancet. 2006;368:210–215. doi: 10.1016/S0140-6736(06)69041-7. [DOI] [PubMed] [Google Scholar]
- 18.Baron-Cohen S, Scott FJ, Allison C, Williams J, Bolton P, Matthews FE, et al. Prevalence of autism-spectrum conditions: UK school-based population study. Br J Psychiatry. 2009;194:500–509. doi: 10.1192/bjp.bp.108.059345. [DOI] [PubMed] [Google Scholar]
- 19.Wilson EB. Probable inference, the law of succession, and statistical inference. J Am Stat Assoc. 1927;22:209–212. [Google Scholar]
- 20.Grozeva D, Conrad DF, Barnes CP, Hurles M, Owen MJ, O’Donovan MC, et al. Independent estimation of the frequency of rare CNVs in the UK population confirms their role in schizophrenia. Schizophr Res. 2012;135:1–7. doi: 10.1016/j.schres.2011.11.004. [DOI] [PMC free article] [PubMed] [Google Scholar]
- 21.Williams NM, Zaharieva I, Martin A, Langley K, Mantripragada K, Fossdal R, et al. Rare chromosomal deletions and duplications in attention-deficit hyperactivity disorder: a genome-wide analysis. Lancet. 2010;376:1401–1408. doi: 10.1016/S0140-6736(10)61109-9. [DOI] [PMC free article] [PubMed] [Google Scholar]
- 22.Kirov G, Owen MJ. Genetics of Schizophrenia. In: Kaplan and Sadock’s Comprehensive Textbook of Psychiatry, Chapter 12.4. 9. Lippincot, Williams and Wilkins; 2009. [Google Scholar]
Associated Data
This section collects any data citations, data availability statements, or supplementary materials included in this article.