

Abstract
Bemisia tabaci has developed high levels of resistance to many insecticides including the neonicotinoids and there is strong evidence that for some compounds resistance is stage-specific. To investigate the molecular basis of B. tabaci resistance to the neonicotinoid thiamethoxam we used a custom whitefly microarray to compare gene expression in the egg, nymph and adult stages of a thiamethoxam-resistant strain (TH-R) with a susceptible strain (TH-S). Gene ontology and bioinformatic analyses revealed that in all life stages many of the differentially expressed transcripts encoded enzymes involved in metabolic processes and/or metabolism of xenobiotics. Several of these are candidate resistance genes and include the cytochrome P450 CYP6CM1, which has been shown to confer resistance to several neonicotinoids previously, a P450 belonging to the Cytochrome P450s 4 family and a glutathione S-transferase (GST) belonging to the sigma class. Finally several ATP-binding cassette transporters of the ABCG subfamily were highly over-expressed in the adult stage of the TH-R strain and may play a role in resistance by active efflux. Here, we evaluated both common and stage-specific gene expression signatures and identified several candidate resistance genes that may underlie B. tabaci resistance to thiamethoxam.
Keywords: Bemisia tabaci, metabolic resistance, thiamethoxam, microarray, stage specific
Introduction
The sweet potato whitefly, Bemisia tabaci (Hemiptera: Aleyrodidae), is an important pest of agricultural and horticultural crops in temperate and tropical regions worldwide. B. tabaci is a species complex, which is generally categorized into a series of species based on distinct biological and genetic differences (Dinsdale et al., 2010; De Barro et al., 2011; Sun et al., 2011). The so-called B- and Q-types are by far the most economically damaging and invasive. In China, the B-type was first detected in the mid-1990s (Luo et al., 2002), whereas the Q-type was first reported in 2003 (Chu et al., 2006). The distributions of both types have extended rapidly throughout the country, although the Q-type is currently supplanting the B-type in many areas (Zhang et al., 2005; Luo et al., 2010).
Over the years B. tabaci has demonstrated a remarkable ability to develop resistance to many insecticides including organophosphates, carbamates, pyrethroids, neonicotinoids and juvenile hormone mimics (Cahill et al., 1996; Horowitz et al., 2004; Nauen & Denholm, 2005). The neonicotinoids (eg imidacloprid, thiamethoxam and acetamaprid) are key compounds for whitefly control because of their excellent efficacy, versatility of application and long residual activity (Nauen et al., 2008). The emergence of resistance to neonicotinoids has been a consistent characteristic of Q-type whiteflies (Nauen & Denholm, 2005), whereas in the B-type resistance generally takes longer to develop. This pattern is evident in China where B-type strains collected in 2007–2008 were far more susceptible than Q-type counterparts (Luo et al., 2010). More recently however, cross-resistance to imidacloprid and thiamethoxam has been reported from field populations of both B- and Q-types (Z.Y. Wang et al., 2010).
There is strong evidence that neonicotinoid resistance is mediated in part by cytochrome p450 monooxygenases (Nauen et al., 2002; Rauch & Nauen, 2003; Feng et al., 2009). In whiteflies, resistance to imidacloprid is strongly correlated with the expression of a specific p450, CYP6CM1, which can metabolize this insecticide in vitro (Karunker et al., 2008, 2009). The finding that imidacloprid resistance is age-specific in B. tabaci (Nauen et al., 2008) was shown to correlate with CYP6CM1 mRNA levels (Jones et al., 2011). To date, no target-site mutations in the nicotinic acetylcholine receptor have been discovered in field populations of B. tabaci; however, a point mutation (R81T) in the peach-potato aphid (Myzus persicae), in addition to elevated cytochrome p450s, confers resistance to both imidacloprid and thiamethoxam (Bass et al., 2011).
The recent advancement in genomic technologies offers the opportunity for a better understanding of the complex metabolic processes underlying insecticide resistance (Bass et al., 2012). Transcriptome profiling has been applied to several insect species as a means of analysing gene expression patterns and associating these with insecticide-resistant phenotypes (Puinean et al., 2010; Liu et al., 2011; Karatolos et al., 2012; Mitchell et al., 2012). Furthermore, transcriptional profiling of individual stages within the insect life-cycle provide evidence for key genes up- or down-regulated during the developmental process (Arbeitman et al., 2002; Colgan et al., 2011; Harker et al., 2012).
Some of the present authors have previously used two approaches to compare gene expression in the adult stage of a thiamethoxam resistant (TH-R) B. tabaci B-type laboratory strain with the parental strain from which it was selected (TH-susceptible, TH-S). In the first study quantitative real-time PCR (qPCR) was used to examine the expression of 63 candidate genes (Xie et al., 2012b), whereas in a second study suppression subtractive hybridization (SSH) was used to identify differentially expressed genes followed by qPCR validation (Xie et al., 2012a). The first study was restricted to genes encoding cytochrome P450s whereas the second study showed poor correlation between SSH and qPCR, suggesting several ‘false positives’ as differentially expressed using SSH (Xie et al., 2012a). In the current study, a global transcriptomic approach was used to analyse gene expression patterns in the egg, fourth instar nymph and adult life stages using an Agilent custom B. tabaci microarray containing ∼15 000 probes representing 8394 expressed sequence tags (ESTs). The microarray data for selected genes were validated using quantitative reverse-transcription PCR (qRT-PCR). The differences in expression profiles between the thiamethoxam resistant and susceptible strains are discussed in the context of our current understanding of neonicotinoid resistance in B. tabaci.
Results
Overview of microarray results
Changes in global gene expression in different development stages of the thiamethoxam selected strain (TH-R) were compared with the equivalent life stage of an unselected culture of the same strain (TH-S) using a custom Agilent microarray. In total, 1043 ESTs were identified as significantly differentially expressed in at least one of the three life stages examined with each development stage displaying a distinct gene expression signature (Figs 1A, 1A, Table S3). Amongst these, only ∼4% (37 ESTs) were differentially expressed in all three stages (Table 2) with just 10 ESTs over-expressed. Approximately 22% (230 ESTs) of the differentially expressed genes were common to two stages and ∼74% (776 genes) were unique to just one stage (Fig. 2B). The expression of 434 ESTs was altered in the egg stage, amongst which ∼59% were up-regulated. The nymph stage had 553 differentially expressed ESTs with ∼42% of them up-regulated. Finally in the female adult stage, 360 ESTs were differentially expressed with ∼61% over-expressed.
Figure 1.

Stage-specific expression patterns. (A) Stage-specific expression of expressed sequence tags in microarray analysis. (B, C, D) Fold change distribution of differentially expressed genes in eggs, nymphs and female adults, respectively. The number of probes for the different classes and corresponding fold changes (fold change = 1–2, 2–3, 3–4, >4) are given. Values are given only for probes in which fold changes are statistically significant using R and SAS tests. TH-R, thiamethoxam resistant; TH-S, thiamethoxam susceptible. R, http://www.r-project.org/. SAS, Statistics Analysis System.
Table 2.
Expressed sequence tags differentially expressed in microarray experiments in all three life stages of the Bemisia tabaci thiamethoxam-resistant strain when compared to the thiamethoxam-susceptible strain
| Fold change* | ||||
|---|---|---|---|---|
| Probe ID | Gene description | Egg | Nymph | Female adult |
| p_00270 | Cytochrome P450 4C1 | 3.347 | 0.423 | 0.342 |
| p_00337 | Cytochrome P450 4C1 | 3.343 | 0.385 | 0.355 |
| p_00429 | Cytochrome c oxidase subunit III | 34.655 | 6.142 | 10.223 |
| p_00430 | Thymus-specific serine protease | 0.446 | 0.414 | 0.257 |
| p_00712 | Cytochrome P450 4C1 | 3.014 | 0.449 | 0.364 |
| p_00828 | Salivary secreted protein | 12.179 | 0.497 | 5.068 |
| p_01080 | Alpha-amylase | 2.759 | 6.407 | 3.456 |
| p_01371 | Glutathione S-transferase (GST class-sigma) | 2.375 | 5.654 | 2.668 |
| p_01426 | Heat shock protein 70 | 0.496 | 0.277 | 7.521 |
| p_01769 | Protease | 0.028 | 0.2 | 0.158 |
| p_01780 | Sucrase | 0.283 | 0.156 | 0.315 |
| p_02142 | Alpha-amylase, partial | 0.445 | 0.31 | 0.446 |
| p_02191 | Iron dehydrogenase | 0.388 | 0.361 | 0.441 |
| p_03634 | Cytochrome P450 | 0.425 | 0.495 | 0.484 |
| p_04998 | Glucose dehydrogenase | 2.114 | 0.471 | 3.942 |
| p_05497 | Cysteine protease | 0.427 | 0.121 | 0.36 |
| p_05608 | Protease | 0.023 | 0.269 | 0.186 |
| p_05647 | Cytochrome c oxidase subunit II | 14.571 | 2.158 | 2.125 |
| p_05670 | Cytochrome c oxidase subunit 7C | 28.279 | 2.312 | 4.357 |
| p_05680 | NADH dehydrogenase subunit 4 | 33.389 | 2.12 | 2.823 |
| p_05809 | NADH dehydrogenase subunit 1 | 29.665 | 2.072 | 9.797 |
| p_06019 | Cytochrome P450 | 2.898 | 0.358 | 0.401 |
| p_06169 | Cytochrome P450 | 3.192 | 0.368 | 0.296 |
| p_06381 | Cytochrome P450 CYP6CM1vB | 3.49 | 3.947 | 2.987 |
| p_06403 | Maltase-like protein Agm2 | 0.471 | 4.852 | 2.189 |
| p_06428 | Heat shock protein (hsp70) | 0.433 | 0.229 | 11.715 |
| p_06906 | Heat shock protein 70 | 0.393 | 0.203 | 13.779 |
| p_06918 | Alpha-glucosidase | 0.419 | 0.398 | 0.37 |
| p_07002 | Chromosome segregation ATPases-like protein | 5.157 | 4.699 | 4.809 |
| p_07176 | Restnol dehydrogenase | 2.431 | 2.039 | 2.454 |
| p_07334 | Cytochrome P450 | 2.726 | 0.35 | 0.413 |
| p_07336 | Protease | 0.073 | 0.155 | 0.161 |
| p_07435 | Protease | 0.231 | 0.152 | 0.162 |
| p_07830 | Cytochrome P450 4C1 | 3.759 | 0.43 | 0.419 |
| p_08139 | Alpha glucosidase | 0.409 | 0.317 | 0.296 |
| p_08232 | Protease | 0.219 | 0.198 | 0.277 |
| p_08377 | Heat shock protein 70 | 0.453 | 0.232 | 11.89 |
Significant difference (P < 0.05, fold change ≥ 2or fold change ≤ 0.5).
NADH, reduced nicotinamide adenine dinucleotide.
Figure 2.
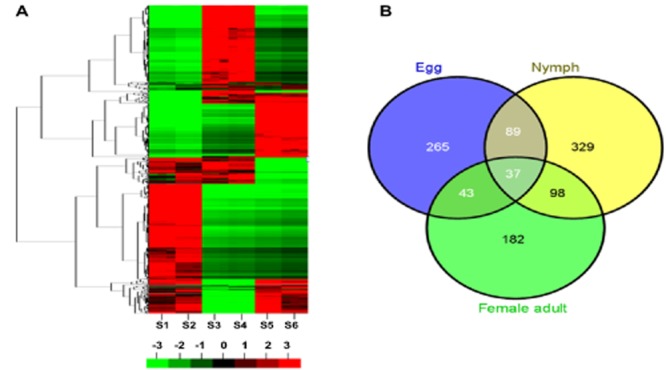
Stage-specific gene expression signatures in Bemisia tabaci. (A) Hierarchical cluster analysis of altered expressed sequence tags (ESTs) (|log2 ratio| ≥ 1, P < 0.05) at the three stages in B. tabaci between thiamethoxam resistance and susceptible were characterized as the following: nymph stage in thiamethoxam resistant (TH-R; S1) and TH susceptible (TH-S; S2), respectively; egg stage in TH-R (S3) and TH-S (S4), respectively; female adult stage in TH-R (S5) and TH-S (S6), respectively. Green, red and black areas indicate, respectively, decreased, increased and no significant change in thiamethoxam resistance compared with susceptible. (B) Venn diagram depicting the number of ESTs with altered expression (|log2 ratio| ≥ 1, P < 0.05) at three stages between thiamethoxam resistance and susceptible, respectively. The size of each region is proportional to the number of altered ESTs.
Stage-specific gene expression
434 genes were significantly differentially expressed in the egg stage between susceptible (TH-S) and resistant (TH-R) whiteflies [false discovery rate (FDR) ≤ 0.001 and |log2 ratio| ≥ 1]. The majority of these transcripts (∼86%, 373 genes) fell into different fold range (Fig. 1B). Gene ontology (GO) analysis of differentially expressed transcripts at the egg stage are presented in Fig. 3 with the details shown in Table S4. For molecular function ontology the majority of the ESTs were assigned to the GO terms catalytic activity (∼36%, 157) and binding (∼23%, 98), for biological process ontology to metabolic process (∼25%, 109), and for cellular component ontology to cell (∼23%, 99) and cell part (∼23%, 99), (Table S4). At this stage, a high number of the most over-expressed transcripts encoded energy regulation components such as cytochrome c and reduced nicotinamide adenine dinucleotide (NADH) dehydrogenase. Other highly over-expressed transcripts encode enzymes involved in metabolic pathways and metabolism of xenobiotics, including glucosyl/glucuronosyl transferases, cytochrome P450 and glutathione S-transferases (GSTs).
Figure 3.
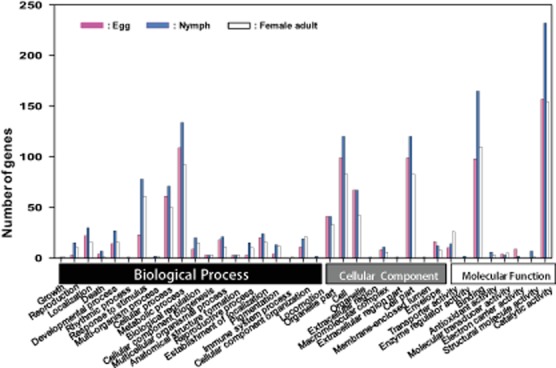
Functional classification of differentially expressed expressed sequence tags (ESTs) The function of differently expressed ESTs are grouped into three main ontology: biological process, cellular component and molecular function. The y-axis the number of genes in each GO term.
The nymph stage had 553 significantly differentially expressed genes (FDR ≤ 0.001 and |log2 ratio| ≥ 1) and there were significantly more stage-specific ESTs at this stage than either the egg or adult stages. Data analysis showed that the majority of the transcripts (∼82%, 453) fell into different fold range (Fig. 1C). In contrast to the predominance of elevated EST expression in the egg stage, genes unique to the nymph stage were more likely to be down-regulated (∼58% of the 553 genes). GO analysis of differentially expressed ESTs in this stage assigned the majority of ESTs to the GO terms catalytic activity (∼42%, 232), metabolic process (∼24%, 134), cell part (∼22%, 120) and cell (∼22%, 120) for the molecular function, biological process and cellular component ontologies respectively induced (Fig. 3, Table S4). Interestingly, expression of genes encoding digestive enzymes were amongst the most highly over-expressed in the larval stage of the TH-R strain, including trehalases, sucrases, amylases, serine proteases, glucosidases and peroxidases, whereas the expression of transport genes such as ATP-binding cassette transporters (ABC transporters) was down-regulated. High numbers of ESTs encoding proteins involved in the metabolic and xenobiotic detoxification pathways were over-expressed in this stage, including two P450s, 22 GSTs and several others encoding oxidoreductase activity, such as glucose dehydrogenase, NADH dehydrogenase and 24-dehydrocholesterol reductase.
The female adult stage had 360 differentially expressed ESTs in the resistant TH-R strain compared to the equivalent stage of the TH-S strain (FDR ≤ 0.001 and |log2 ratio| ≥ 1). Amongst these, 219 ESTs were up-regulated and 141 ESTs were down-regulated by at least 2.0-fold (P < 0.05) with ∼75% (270 ESTs) in the different fold range (Fig. 1D). These included ESTs encoding proteins assigned to the GO terms catalytic activity (∼43%, 154), binding (∼31%, 110), metabolic process (∼25%, 92), cell part (∼23%, 83) and response to stimulus (∼17%, 61) (Fig. 3, Table S4). High numbers of ESTs encoding heat shock proteins and detoxification enzymes such as P450s, GSTs and carboxylesterases (CEs) were amongst the most over-expressed gene in the adult stage of the TH-R strain. Finally, in contrast to the larval stage, several ESTs encoding ABC transporters were over-expressed in the adult stage in the TH-R strain.
Candidate resistance/detoxification genes
In a range of insect species genes encoding members of the GST, cytochrome P450 (P450) and CE families have been most frequently associated with resistance to a range of different insecticides (Li et al., 2007). The expression of ESTs encoding these potential resistance genes and those involved in excretion such as ABC transporters is illustrated in Fig. 4. An approximately equal number of ESTs encoding P450s were over-/under-expressed in the egg and adult stages of the TH-R strain compared to the TH-S strain, with a slightly higher number down-regulated in the nymph stage. Of these, only a single EST (p_00712), encoding CYP6CM1vB, was over-expressed in all stages in the microarray experiments (Table 2). This EST and several others encoding the same P450 (or alleles of it) were the most highly over-expressed ESTs encoding P450s in both egg and larval stages of the TH-R strain. However, in the adult stage of the TH-R strain a different P450 was the most over-expressed gene. This P450 was represented by six over-expressed ESTs (p_04027, p_07226, p_00875, p_00955, p_06100 and p_07903, which encode different regions of this P450) and is most similar to members of the CYP4C family of P450s. As shown in Fig. 4, overall a higher number of ESTs encoding GSTs were over-expressed in the TH-R strain than under-expressed and this was largely because a high number were over-expressed in the nymph stage (22 of 34 genes). Only a single GST (represented by ESTs p_01371, p_08162 and p_00218) was over-expressed in all three life stages and is most similar to the sigma class of GSTs. This was the most over-expressed GST in the larval and adult stages of the TH-R strain and showed the highest levels of expression at the larval stage (5.6-, 6.6- and 10.3-fold for ESTs p_08162, p_00218 and p_01371, respectively). Although over-expressed in the egg stage (2.3-fold), this GST was not the most over-expressed GST in this stage as an EST (p_00685) encoding a GST of the theta class showed slightly higher levels of over-expression (3.2-fold). As shown in Fig. 4, the greatest number of ESTs encoding CEs were overexpressed in the egg stage, including ESTs (p_00010 and p_00256) corresponding to B. tabaci COE2 (EF675186). However, these ESTs were not over-expressed in either the nymph or adult stages. In these stages, the ESTs encoding a different CE (p_01300, p_00872 and p_06520) were over-expressed (over sixfold in the adult stage). This was most similar to the published B. tabaci COE2 sequence but with only 58% sequence identity is unlikely to be the same gene.
Figure 4.
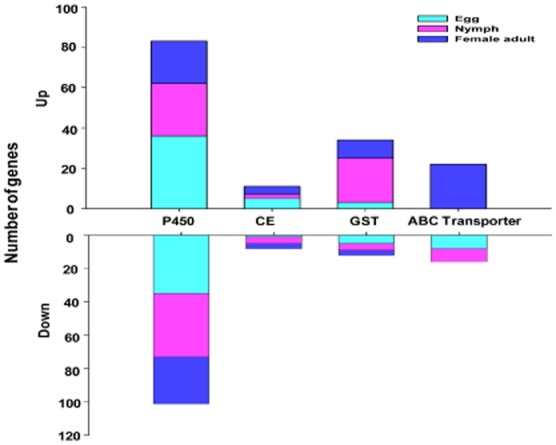
Expression profiles of expressed sequence tags encoding detoxification-related proteins in microarray analysis of a thiamethoxam resistant strain compared to a thiamethoxam susceptible strain. CE, carboxylesterase; GST, glutathione S-transferase; P450, cytochrome P450.
Differential expression of 22 ESTs encoding ABC transporters were significantly over-expressed in the adult stage of the TH-R strain whereas eight ESTs encoding ABC transporters were down-regulated in the egg and nymph stages (Fig. 4). These ESTs encode a maximum of 12 unique ABC transporters as bioinformatic analysis revealed several ESTs encode different regions of the same ABC transporter. For example, ESTs p_01016, p_00161, p_03530, p_05190, p_04478, p_07210, p_04758 and p_00242 encode an ABC transporter most similar to the subfamily G member 4-like of Acyrthosiphon pisum. Other members of the ABCG subfamily were also well represented in the over-expressed ESTs (see Table S5).
We were able to assign GO terms to 572 of the differentially expressed ESTs in B. tabaci. One of the striking results from this analysis is that a large number of the ESTs fall under the category of terms associated with metabolic processes and catalytic activity. This is consistent with our observations that several of the up-regulated ESTs in the resistant subset are cytochrome P450s and GSTs. To investigate the biological functions further, 810 differentially expressed genes were mapped to 221 pathways in the Kyoto Encyclopedia of Genes and Genomes (KEGG) database (http://www.genome.jp/kegg/pathway.html). Amongst these, 16 pathways were significantly enriched (P-value ≤ 0.05) including ‘Drug metabolism – cytochrome P450’, and ‘Metabolism of xenobiotics by cytochrome P450’ (Table 3).
Table 3.
Significantly enriched Kyoto Encyclopedia of Genes and Genomes (KEGG) pathways determined from differential expression associated with thiamethoxam resistance in Bemisia tabaci
| Pathway | Differentially expressed* | Expressed† | P-value | KO |
|---|---|---|---|---|
| Starch and sucrose metabolism | 127 | 393 | 0 | ko00500 |
| Metabolism of xenobiotics by cytochrome P450 | 64 | 378 | 0.022171 | ko00980 |
| Drug metabolism – cytochrome P450 | 64 | 376 | 0.019929 | ko00982 |
| Limonene and pinene degradation | 61 | 362 | 0.027095 | ko00903 |
| Galactose metabolism | 87 | 304 | 3.85E-13 | ko00052 |
| Protein processing in endoplasmic reticulum | 90 | 259 | 0 | ko04141 |
| Antigen processing and presentation | 82 | 218 | 0 | ko04612 |
| Endocytosis | 60 | 175 | 3.09E-13 | ko04144 |
| Toxoplasmosis | 66 | 171 | 0 | ko05145 |
| MAPK signalling pathway | 64 | 152 | 0 | ko04010 |
| Spliceosome | 61 | 146 | 0 | ko03040 |
| Carbohydrate digestion and absorption | 24 | 88 | 0.000176 | ko04973 |
| Progesterone-mediated oocyte maturation | 14 | 57 | 0.007399 | ko04914 |
| NOD-like receptor signalling pathway | 11 | 43 | 0.009771 | ko04621 |
| Nicotinate and nicotinamide metabolism | 7 | 16 | 0.000518 | ko00760 |
| Nonhomologous end-joining | 1 | 2 | 0.018358 | ko03450 |
The number of differentially expressed genes that belong to each KEGG pathway.
The number of expressed genes that belong to each KEGG pathway.
KO, KEGG orthology; MAPK, mitogen-activated protein kinase; NOD, nucleotide-binding oligomerization domain.
qRT-PCR validation
To validate the microarray data presented above, 14 ESTs significantly differentially expressed in all three life stages were selected for qRT-PCR. Three additional biological replicates per strain and life stage were used to independently validate the results. The genes selected covered a range of different expression levels. The expression pattern revealed by qRT-PCR was consistent with that from the microarrays and a good correlation (r = 0.75) was observed between the two methods (Table 1). Of the P450s tested by qRT-PCR, CYP6CM1vB showed by far the highest levels of over-expression (7.9–28-fold) in all three stages of the TH-R strain. The level of over-expression of the sigma-type GST encoded by EST p_01371 was also high in qPCR, with the highest level seen in the nymph stage (∼18-fold), confirming the up-regulation of this gene in the microarray.
Table 1.
Validation of microarray results by quantitative reverse-transcription PCR (qRT-PCR)
| Fold change | |||||
|---|---|---|---|---|---|
| Probe ID | Gene description | Method | Egg | Nymph | Female adult |
| p_00429 | Cytochrome c oxidase subunit III | Microarray | 34.655 | 6.142 | 10.222 |
| qRT-PCR | 71.707** | 2.555** | 1.192 | ||
| p_01080 | Alpha-amylase | Microarray | 2.759 | 6.407 | 3.456 |
| qRT-PCR | 24.082* | 19.383** | 8.461** | ||
| p_06403 | Maltase-like protein Agm2 | Microarray | 0.471 | 4.852 | 2.19 |
| qRT-PCR | 4.841 | 19.232** | 0.971 | ||
| p_00337 | Cytochrome P450 4C1 | Microarray | 3.343 | 0.385 | 0.355 |
| qRT-PCR | 2.367** | 2.183** | 0.244** | ||
| p_05680 | NADH dehydrogenase subunit 4 | Microarray | 33.39 | 2.12 | 2.823 |
| qRT-PCR | 2.12 | 1.414** | 0.503** | ||
| p_07435 | Protease, reverse transcriptase and RNase H | Microarray | 0.231 | 0.152 | 0.162 |
| qRT-PCR | 0.070** | 0.357** | 7.705** | ||
| p_01780 | Sucrase | Microarray | 0.283 | 0.156 | 0.312 |
| qRT-PCR | 3.158 | 0.495** | 1.958** | ||
| p_00828 | Salivary secreted protein | Microarray | 12.179 | 0.497 | 5.068 |
| qRT-PCR | 4.985** | 0.896 | 0.171** | ||
| p_07830 | Cytochrome P450 4C1 | Microarray | 3.759 | 0.43 | 0.419 |
| qRT-PCR | 2.827** | 1.345 | 1.971* | ||
| p_06169 | Cytochrome P450 | Microarray | 3.192 | 0.368 | 0.296 |
| qRT-PCR | 5.286** | 2.197** | 1.567 | ||
| p_06381 | Cytochrome P450 CYP6CM1vB | Microarray | 3.49 | 3.947 | 2.987 |
| qRT-PCR | 28.021** | 15.597** | 7.931** | ||
| p_07334 | Cytochrome P450 | Microarray | 2.726 | 0.35 | 0.413 |
| qRT-PCR | 4.086** | 3.231** | 1.351 | ||
| p_01371 | Glutathione S-transferase | Microarray | 2.375 | 5.654 | 2.668 |
| qRT-PCR | 15.378** | 19.205** | 2.038 | ||
| p_06019 | Cytochrome P450 | Microarray | 2.898 | 0.358 | 0.401 |
| qRT-PCR | 1.559 | 4.41** | 2.817** | ||
Asterisks denote a significant difference in gene expression between resistant and susceptible Bemisia tabaci, as determined by paired t-tests (*P < 0.05, **P < 0.001, fold change ≥ 2 or fold change ≤ 0.5).
NADH, reduced nicotinamide adenine dinucleotide.
Discussion
Biological and biochemical characterization of the TH-R strain has suggested that enhanced production of metabolic enzymes underlie its resistance to thiamethoxam (Feng et al., 2009). However, to date, the genes encoding the specific enzymes involved in the resistance of this strain have not been identified. The aim of this study was to identify candidate resistance genes that are differentially expressed in the TH-R strain compared to the parental strain from which it was selected (TH-S). As previous studies on B. tabaci have demonstrated that resistance to the neonicotinoid imidacloprid is stage-specific (Nauen et al., 2008), we examined gene expression in three different life stages of the TH-R strain.
Microarray analysis revealed clear, stage-specific transcriptional signatures with a remarkably small cohort of genes significantly differentially expressed in all stages of the TH-R strain compared to TH-S. GO analysis revealed that in all life stages a majority percentage of the differentially expressed transcripts were assigned to the catalytic activity and metabolic process ontologies. Overall, the most highly over-expressed transcripts in each life stage encoded enzymes involved in metabolic processes and/or metabolism of xenobiotics. Several of these over-expressed transcripts encode proteins belonging to the P450, GST and COE families, the three main superfamilies of detoxification enzymes that have frequently been associated with resistance to insecticides in a range of different arthropod species (Li et al., 2007).
Exposure of the TH-R strain to the metabolic enzyme inhibitor piperonyl butoxide markedly reduced the resistance of this strain to thiamethoxam, suggesting involvement of P450s in resistance (Feng et al., 2009). The same authors also implicated this enzyme system in resistance by biochemical assay using P450 model substrates. In our study, two cytochrome P450s were amongst the most highly over-expressed genes in different life stages of the TH-R strain. The first of these, CYP6CM1vB, was the only P450 highly over-expressed in all life stages of TH-R in both microarray and qPCR experiments. This P450 has been strongly correlated with resistance to imidacloprid in both B and Q biotypes of B. tabaci and functionally expressed CYP6CM1 is able to metabolize the neonicotinoids imidacloprid, clothianidin and thiacloprid (Karunker et al., 2008, 2009; Roditakis et al., 2011). Interestingly, CYP6CM1 showed no metabolic activity against acetamiprid or thiamethoxam when functionally expressed in Escherichia coli (Roditakis et al., 2011). Despite this finding, our expression results, and the fact that the TH-R strain shows strong (47-fold) cross-resistance to imidacloprid (Feng et al., 2008), suggest that CYP6CM1 also plays a role in the resistance of B. tabaci to thiamethoxam. One explanation for this apparent paradox is that although CYP6CM1 may not be able to metabolize thiamethoxam directly, other studies have shown that in insects and plants thiamethoxam is rapidly metabolized to clothianidin, indicating that thiamethoxam is essentially a neonicotinoid precursor for clothianidin, which in turn can be readily metabolized by CYP6CM1 (Nauen & Elbert, 2003).
Recently, studies of the expression of CYP6CM1 in the nymph, pupal and adult stages of an imidacloprid-resistant B. tabaci strain showed marked age-specific expression of this gene, with CYP6CM1 mRNA levels highest in the pupal stage (200-fold), also high in the adult stage (24-fold) and low in the nymph stage (∼onefold) when compared to a reference susceptible strain (Jones et al., 2011). The authors also showed that a reduction in CYP6CM1 expression in nymphs in this strain was consistent with a concomitant fall in imidacloprid resistance levels between nymph and adult stages. Interestingly, in our study a similar pattern was not observed for the expression of this gene in the TH-R strain, with expression levels highest in the egg stage (28-fold), followed by the nymph stage (16-fold) and then the adult stage (eightfold) when compared to the TH-S strain. It would be interesting in future to compare the resistance of each life stage of the TH-R strain and the TH-S strain to see if stage-specific changes in CYP6CM1 expression relate to changes in the susceptibility of the two strains to thiamethoxam. An alternative explanation is that these changes are related to the involvement of this gene in a developmental process (eg as the insect undergoes physiological and morphological changes from egg to nymph) in addition to its role in resistance to neonicotinoids.
In the adult stage of the TH-R strain a different P450 was the most over-expressed gene in the microarray analysis. This gene was highly over-expressed (up to 19-fold) and encodes a P450 belonging to the CYP4C family. CYP4-type P450s have been associated with resistance to insecticides previously (Karatolos et al., 2012), but to date have not been shown to confer resistance to neonicotinoids. However, a member of this family, CYP4G36, is induced in Aedes aegypti after treatment with imidacloprid (Riaz et al., 2009). It is possible that this P450 is acting in tandem with CYP6CM1 to confer neonicotinoid resistance and the functional expression of this P450. Its ability to metabolize thiamethoxam and clothianidin (the latter for the reasons detailed above) should be examined in future to investigate this further.
A single gene encoding a GST was over-expressed in all three life stages of the TH-R strain. This GST shared greatest sequence similarity with members of the sigma class of GSTs and qPCR revealed that it was particularly highly over-expressed (>20-fold) in the larval stage of the TH-R strain. Although enhanced expression of GSTs has been shown to be a mechanism of resistance to DDT and organophosphates and has also been implicated in resistance to pyrethroids in certain insects, to date, GSTs have not been associated with resistance to neonicotinoids (Huang et al., 1998; Ranson et al., 2001; Vontas et al., 2001). In addition, previous studies have not been able to demonstrate a synergistic effect using the GST inhibitor diethyl maleate in combination with thiamethoxam against the TH-R strain, and biochemical assessment found no difference in GST enzyme activity between the TH-R and TH-S strains (Feng et al., 2009). This study used adult whiteflies for both bioassays and as the enzyme source for biochemical assays; however, the qPCR analysis carried out in our study showed that this GST gene is highly over-expressed in the egg and nymph stages but only slightly over-expressed in the adult stage, so the design of the previous study may have precluded its detection. The involvement of this GST in the resistance of different life stages of the TH-R strain to thiamethoxam clearly warrants further investigation, including functional validation of the ability of this enzyme to metabolize thiamethoxam and/or its primary metabolites.
Thiamethoxam resistance in the TH-R strain is suppressed by the COE inhibitor triphenyl phosphate and total esterase activity is increased ∼threefold in this strain compared to TH-S (Feng et al., 2009). In the adult and nymph stages of the TH-R strain a gene encoding a COE was significantly over-expressed compared to the TH-S strain. This gene was most similar to the published B. tabaci COE2 sequence. Organophosphate resistance in the B-biotype of B. tabaci is associated with a point mutation in an ace1-type acetylcholinesterase and over-expression of COEs (Alon et al., 2008). However, the authors of this study observed only a twofold increase in expression of COE2 compared to a susceptible strain, whereas another COE, COE1, displayed a higher level (fourfold) of expression. Although the COE gene over-expressed in our study shares similarity with COE2, it is not the same gene and represents a novel COE that has not been previously described in B. tabaci. In addition to organophosphates, COEs have also been associated with resistance to carbamates and pyrethroids; however, they have never been directly shown to confer resistance to neonicotinoids. Furthermore, certain strains of insects expressing high levels of COEs are not cross-resistant to neonicotinoids, suggesting that this enzyme family may not have the capacity to break down neonicotinoids. This is consistent with the fact that neonicotinoids are not readily hydrolysed at physiological pH values (Jeschke & Nauen, 2008). Nevertheless, selection of the TH-R strain from the TH-S parental strain has clearly driven up the expression of COEs and the elevated expression of this COE2-like gene may be related to the fact that the TH-R strain shows moderate levels of cross-resistance (∼fourfold) to the carbamate carbosulfan (Feng et al., 2009).
A particularly strong expression signature in the adult stage of the TH-R strain was the over-expression of a high number of ESTs encoding ABC transporters. ABC transporters have been implicated in insecticide resistance in several insect species but the physiological mechanism by which these transporter proteins act to cause resistance has not been clearly defined (Buss et al., 2002; Porretta et al., 2008; Aurade et al., 2010; Gahan et al., 2010; Bariami et al., 2012). In contrast, in humans ABC transporters have been well studied because of their role in conferring drug resistance in cancer cells (Glavinas et al., 2004). The human ABC transporter ABCG2 is thought to play a role in multidrug resistance to chemotherapeutic agents and is expressed at high levels in the intestinal epithelia, in cells of the blood−brain barrier and the placenta, suggesting that its physiological role is to protect cells from potentially toxic substances and to prevent absorption of xenobiotics ingested in the diet by actively transporting compounds from cells (Ejendal & Hrycyna, 2002). In this regard it is noteworthy that members of subfamily G were particularly well represented in the ABC transformers over-expressed in the TH-R strain and the potential role of these transporters in resistance clearly warrants more detailed future investigation.
Summary and conclusions
In this study we have shown that selection of the TH-R strain with thiamethoxam over many generations has induced significant changes in gene expression and that these changes exhibit clear stage-specific signatures. Several putative candidate resistance genes have been identified as over-expressed in the resistant strains. These include two genes encoding P450s, one of which has been shown to confer resistance to other neonicotinoids previously, and genes encoding a GST, a COE and several ABC transporters. The consistency of the over-expression of these genes with thiamethoxam resistance in other B. tabaci strains should now be examined. This, combined with functional expression and analysis of the ability of these enzymes to detoxify thiamethoxam and/or other neonicotinoids, will help to identify precisely which confer resistance. Ultimately, the characterization of the precise molecular mechanisms underlying insecticide resistance in different life stages of thiamethoxam-resistant B. tabaci will facilitate the development of rational approaches to improve the management of this pest and the development of new insecticides for control.
Experimental procedures
Insect material and sample preparation
Two B-type B. tabaci strains, TH-S and TH-R, were used in the microarray experiments and reared as previous described (Feng et al., 2009; Xie et al., 2012a). The TH-R strain exhibited over 70-fold resistance to thiamethoxam in comparison with the TH-S strain (Xie et al., 2012a). Insects were collected from both strains at the following life stages: (1) eggs; (2) fourth instar nymphs; (3) and one-day-old unmated adult females. Insects were frozen at −80 °C and stored for downstream RNA work.
Microarray design
A new B. tabaci 8 × 15k Agilent microarray (Agilent Technologies, Palo Alto, CA, USA) was designed for this experiment. The array was designed using the eArray platform (https://earray.chem.agilent.com/earray/) and full details of the array can be found in ArrayExpress (accession number GSE42337). The array design is based on 8394 B. tabaci ESTs from gene families with putative association to insecticide resistance. These ESTs are presented in Table S1 and include 2014 ESTs generated from the transcriptome of the imidacloprid-resistant B biotype (Y. Wu et al., unpubl. data), 6293 from the B. tabaci B and Q biotype transcriptome (X.W. Wang et al., 2010; Xie et al., 2012b) and 87 from the National Center for Biotechnology Information (NCBI) dbEST database (http://www.ncbi.nlm.nih.gov/dbEST/). In total, the array contains 237 probes replicated 10-fold, 1142 probes in triplicate, 2079 probes as duplicate and 4936 as singular probes.
Microarray labelling and hybridization
Total RNA was isolated from three biological replicates for each life stage of TH-S and TH-R whitefly samples using TRIzol (Invitrogen, Carlsbad, CA, USA) according to the manufacturer’s protocol. For replicates of the egg and nymph preparations around 10 mg of fresh material was extracted. For adults around 450 adults were extracted for each replicate. RNA was purified using the QIAGEN RNeasy Kit (Qiagen, CA, USA) according to the manufacturer’s instructions. RNA integrity was analysed using gel electrophoresis and the yield determined using a Nanodrop ND1000 (Nanodrop, Thermo Scientific, Wilmington, DE, USA). Double-stranded cDNA was synthesized using a T7 promoter primer and Moloney Murine Leukemia Virus (M-MLV) reverse transcriptase (Agilent Technologies). The synthesized products were used as templates to produce cRNA using the T7 RNA polymerase and then labelled with Cy3 [Cy3 N-hydroxysuccinimide (NHS) ester, GE Healthcare, Pittsburgh, PA, USA]. Amplified cRNAs were purified by using a RNeasy Mini Kit (Qiagen) and resuspended in diethylpyrocarbonate-treated water. cDNA quantity and incorporation of the Cy3 label were confirmed by using the Nanodrop ND1000. In each array comparison, the three biological replicates for each treatment (strain and life stage) were compared using the TH-S samples as the reference. Array hybridization, slide washing and scanning were performed according to the manufacturer’s instructions (Agilent Technologies).
Microarray data analysis
Spot finding, signal quantification and spot superimposition were performed using the Agilent Feature Extraction software (Agilent Technologies). Normalization and statistical analyses of the data were performed using the Limma test (Smyth, 2004). For each array, the spot replicates of each gene were merged and expressed as median ratios ±SD before ratios were log-transformed. Mean expression ratios were then subjected to a one-sample Student’s t-test against the baseline value of 1 (equal gene expression in both samples) with multiple testing correction (Benjamini and Hochberg FDR). Statistical significance was assigned to each pairwise comparison between thiamethoxam susceptible and resistant samples within each developmental stage. A FDR of <0.001 and an expression ratio of > twofold or <0.5-fold in either direction (up- and down-regulation) were used as criteria to consider genes differentially expressed between the two strains. The microarray data were deposited into the NCBI GEO database (http://www.ncbi.nlm.nih.gov/geo/) under accession number GSE42337.
Functional annotation of identified transcripts was performed using the GO Annotation Database (http://www.ebi.ac.uk/GOA/). GO terms assigned to each gene were categorized by molecular function, biological process and cellular component, and all identified transcripts were mapped to the KEGG database. A hypergeometic test was applied to KEGG orthology (KO) terms to find significantly enriched pathways associated with differentially expressed transcripts from B. tabaci. The test was applied against the B. tabaci transcriptomic background. The calculating formula for GO and KEGG pathway enrichment analysis was
 |
In this formula, N is the number of all transcripts with GO/KO annotation; n is the number of differentially expressed transcripts in N; M is the number of all transcripts that are annotated to the certain GO/KO terms; m is the number of differentially expressed transcripts in M. Pathways were considered significant if P < 0.05 after Bonferroni multiple testing correction.
qPCR
An additional extraction of total RNA was performed from all samples for qPCR analysis according to the protocol above. This ensured that the microarray results could be validated on independent biological material. cDNA was synthesized using the SYBR PrimeScript reverse transcription-PCR kit (Takara, Kyoto, Japan). qPCRs were carried out on the ABI Prism 7500 real-time PCR system (Applied Biosystems, Foster City, CA, USA) with SYBR green detection following a cycling regime of 95 °C for 3 min, 40 cycles of 95 °C for 30 s, 55 °C for 30 s and 72 °C for 35 s. A selection of target genes were chosen for validation according to the patterns of stage-specific expression. The primers used for real-time PCR are listed in Table S2. Three biological replicates for each sample were used for qPCR analysis, after which the average threshold cycle (Ct) was calculated for each sample. The relative expression levels between the susceptible and resistance strains at different life stages were calculated using the 2-ΔΔCt method (Pfaffl, 2001) using NADPH and EF-1a as endogenous control genes (Li et al., 2012). The expression stability of these two reference genes was confirmed with BestKeeper (Pfaffl et al., 2004). Statistical analysis was performed on ΔCt values using a paired Student’s t-test.
Acknowledgments
The authors are grateful to the editor and anonymous reviewers for their critical comments and suggestions. This research was supported by the National Science Fund for Distinguished Young Scholars (31025020), National Basic Research Program of China (2013CB127602), Beijing Natural Science Foundation (6131002), 863 program (2012AA101502), National Technology Support Program (2012BAD19B06) and Beijing Key Laboratory for Pest Control and Sustainable Cultivation of Vegetables, China.
Supporting Information
Additional Supporting Information may be found in the online version of this article at the publisher’s web-site:
Gene classification in microarray design.
Primers used for qRT-PCR analyses.
All of the differentially expressed genes in three developmental stages.
Gene ontology analysis of Bemisia tabaci in three different developmental stages.
Differentially expressed genes related to metabolic detoxification in three developmental stages.
References
- Alon M, Alon F, Nauen R, Morin S. Organophosphates’ resistance in the B-biotype of Bemisia tabaci (Hemiptera: Aleyrodidae) is associated with a point mutation in an ace1-type acetylcholinesterase and overexpression of carboxylesterase. Insect Biochem Mol Biol. 2008;38:940–949. doi: 10.1016/j.ibmb.2008.07.007. [DOI] [PubMed] [Google Scholar]
- Arbeitman MN, Furlong EE, Imam F, Johnso E, Null BH, White KP, et al. Gene expression during the life cycle of Drosophila melanogaster. Science. 2002;297:2270–2275. doi: 10.1126/science.1072152. [DOI] [PubMed] [Google Scholar]
- Aurade RM, Jayalakshmi SK, Sreeramulu K. P-glycoprotein ATPase from the resistant pest, Helicoverpa armigera: purification, characterization and effect of various insecticides on its transport function. Biochim Biophys Acta. 2010;1798:1135–1143. doi: 10.1016/j.bbamem.2010.02.019. [DOI] [PubMed] [Google Scholar]
- Bariami V, Jones CM, Poupardin R, Vontas J, Ranson H. Gene amplification, ABC Transporters and Cytochrome P450s: unraveling the molecular basis of pyrethroid resistance in the dengue vector, Aedes aegypti. PLoS Negl Trop Dis. 2012;6:1–10. doi: 10.1371/journal.pntd.0001692. [DOI] [PMC free article] [PubMed] [Google Scholar]
- Bass C, Puinean AM, Andrews M, Culter P, Slater R, et al. Mutation of a nicotinic acetylcholine receptor beta subunit is associated with resistance to neonicotinoid insecticides in the aphid Myzus persicae. BMC Neurosci. 2011;12:51–62. doi: 10.1186/1471-2202-12-51. [DOI] [PMC free article] [PubMed] [Google Scholar]
- Bass C, Hebsgaard MB, Hughes J. Genomic resources for the brown planthopper, Nilaparvata lugens: transcriptome pyrosequencing and microarray design. Insect Sci. 2012;19:1–12. [Google Scholar]
- Buss DS, McCaffery AR, Callaghan A. Evidence for p-glycoprotein modification of insecticide toxicity in mosquitoes of the Culex pipiens complex. Med Vet Entomol. 2002;16:218–222. doi: 10.1046/j.1365-2915.2002.00365.x. [DOI] [PubMed] [Google Scholar]
- Cahill M, Gorman K, Day S, Denholm I. Baseline determination and detection of resistance to imidacloprid in Bemisia tabaci (Homoptera: Aleyrodidae) Bull Entomol Res. 1996;86:343–349. [Google Scholar]
- Chu D, Zhang YJ, Brown JK, Cong B, et al. The introduction of the exotic Q biotype of Bemisia tabaci from the Mediterranean region into China on ornamental crops. Fla Entomol. 2006;89:168–174. [Google Scholar]
- Colgan TJ, Carolan JC, Bridgett SJ, et al. Polyphenism in social insects: insights from a transcriptome-wide analysis of gene expression in the life stages of the key pollinator, Bombus terrestris. BMC Genomics. 2011;12:623. doi: 10.1186/1471-2164-12-623. [DOI] [PMC free article] [PubMed] [Google Scholar]
- De Barro PJ, Liu SS, Boykin LM, Dinsdale AB. Bemisia tabaci: a statement of species status. Annu Rev Entomol. 2011;56:1–19. doi: 10.1146/annurev-ento-112408-085504. [DOI] [PubMed] [Google Scholar]
- Dinsdale A, Cook L, Riginos C, Buckley YM, De Barro P. Refined global analysis of Bemisia tabaci (Hemiptera: Sternorrhyncha: Aleyrodoidea: Aleyrodidae) mitochondrial cytochrome oxidase 1 to identify species level genetic boundaries. Ann Entomol Soc Am. 2010;103:196–208. [Google Scholar]
- Ejendal KF, Hrycyna CA. Multidrug resistance and cancer: the role of the human ABC transporter ABCG2. Curr Protein Pept Sci. 2002;3:503–511. doi: 10.2174/1389203023380521. [DOI] [PubMed] [Google Scholar]
- Feng YT, Wu QJ, Xu BY, Wang SL, Chang XL, Zhang YJ, et al. Fitness costs and morphological change of laboratory-selected thiamethoxam resistance in the B-type Bemisia tabaci (Hemiptera: Aleyrodidae) J Appl Entomol. 2008;133:466–472. [Google Scholar]
- Feng YT, Wu QJ, Wang SL, Chang XL, Xie W, Zhang YJ, et al. Cross-resistance study and biochemical mechanisms of thiamethoxam resistance in B-biotype Bemisia tabaci (Hemiptera: Aleyrodidae) Pest Manag Sci. 2009;66:313–318. doi: 10.1002/ps.1877. [DOI] [PubMed] [Google Scholar]
- Gahan LJ, Pauchet Y, Vogel H, Heckel DG. An ABC transporter mutation is correlated with insect resistance to Bacillus thuringiensis Cry1Ac toxin. PLoS Genet. 2010;6:e1001248. doi: 10.1371/journal.pgen.1001248. doi: 10.1371/journal.pgen.1001248. [DOI] [PMC free article] [PubMed] [Google Scholar]
- Glavinas H, Krajcsi P, Cserepes J, Sarkadi B. The role of ABC Transporters in drug resistance, metabolism and toxicity. Curr Drug Deliv. 2004;1:27–42. doi: 10.2174/1567201043480036. [DOI] [PubMed] [Google Scholar]
- Harker BW, Hong YS, Sim C, Dana AN, Collins FH, et al. Transcription profiling associated with life cycle of Anopheles gambiae. J Med Entomol. 2012;49:316–325. doi: 10.1603/me11218. [DOI] [PubMed] [Google Scholar]
- Horowitz AR, Kontsedalov S, Ishaaya I. Dynamics of resistance to the neonicotinoids acetamiprid and thiamethoxam in Bemisia tabaci (Homoptera: Aleyrodidae) J Econ Entomol. 2004;97:2051–2056. doi: 10.1093/jee/97.6.2051. [DOI] [PubMed] [Google Scholar]
- Huang HS, Hu NT, Yao YE, Wu CY, Chiang SW, Sun CN. Molecular cloning and heterologous expression of a glutathione S-transferase involved in insecticide resistance from the diamondback moth, Plutella xylostella. Insect Biochem Mol Biol. 1998;28:651–658. doi: 10.1016/s0965-1748(98)00049-6. [DOI] [PubMed] [Google Scholar]
- Jeschke P, Nauen R. Neonicotinoids-from zero to hero in insecticide chemistry. Pest Manag Sci. 2008;64:1084–1098. doi: 10.1002/ps.1631. [DOI] [PubMed] [Google Scholar]
- Jones CM, Daniels M, Andrews M, Slater R, Denholm I, et al. Age-specific expression of a P450 monooxygenase (CYP6CM1) correlates with neonicotinoid resistance in Bemisia tabaci. Pestic Biochem Physiol. 2011;101:53–58. [Google Scholar]
- Karatolos N, Williamson MS, Denholm I, Gorman K, ffrench-Constant RH, et al. Over-expression of a cytochrome P450 is associated with resistance to pyriproxyfen in the greenhouse whitefly Trialeurodes vaporariorum. Plos ONE. 2012;7:e31077. doi: 10.1371/journal.pone.0031077. [DOI] [PMC free article] [PubMed] [Google Scholar]
- Karunker I, Benting J, Lueke B, Ponge T, Nauen R, Morin S, et al. Over-expression of cytochrome P450 CYP6CM1 is associated with high resistance to imidacloprid in the B and Q biotypes of Bemisia tabaci (Hemiptera: Aleyrodidae) Insect Biochem Mol Biol. 2008;38:634–644. doi: 10.1016/j.ibmb.2008.03.008. [DOI] [PubMed] [Google Scholar]
- Karunker I, Morou E, Nikou D, Nauen R, Vontas J, et al. Structural model and functional characterization of the Bemisia tabaci CYP6CM1vQ, a cytochrome P450 associated with high levels of imidacloprid resistance. Insect Biochem Mol Biol. 2009;39:697–706. doi: 10.1016/j.ibmb.2009.08.006. [DOI] [PubMed] [Google Scholar]
- Li RM, Xie W, Wang SL, Yang NN, Zhang YJ, et al. Reference gene selection for qRT-PCR analysis in the sweetpotato whitefly, Bemisia tabaci (Hemiptera: Aleyrodidae) PLoS ONE. 2012;8:e53006. doi: 10.1371/journal.pone.0053006. [DOI] [PMC free article] [PubMed] [Google Scholar]
- Li XC, Schuler MA, Berenbaum MR. Molecular mechanisms of metabolic resistance to synthetic and natural xenobiotics. Annu Rev Entomol. 2007;52:231–253. doi: 10.1146/annurev.ento.51.110104.151104. [DOI] [PubMed] [Google Scholar]
- Liu B, Jiang G, Zhang Y, Li J, Li X, et al. Analysis of transcriptome differences between resistant and susceptible strains of the citrus red mite Panonychus citri (Acari: Tetranychidae) PLoS ONE. 2011;6:e28516. doi: 10.1371/journal.pone.0028516. [DOI] [PMC free article] [PubMed] [Google Scholar]
- Luo C, Yao Y, Wang RJ, Yan FM, Hu DX, et al. The use of mitochondrial cytochrome oxidase mtCOI gene sequences for the identification of biotypes of Bemisia tabaci (Gennadius) in China. Acta Entomol Sin. 2002;45:759–763. [Google Scholar]
- Luo C, Jones CM, Devine G, Zhang F, Gorman K, et al. Insecticide resistance in Bemisia tabaci biotype Q (Hemiptera: Aleyrodidae) from China. Crop Prot. 2010;29:429–434. [Google Scholar]
- Mitchell SN, Stevenson BJ, Müller P, Wilding CS, Donnelly MJ, et al. Identification and validation of a gene causing cross-resistance between insecticide classes in Anopheles gambiae from Ghana. Pest Manag Sci. 2012;109:6147–6152. doi: 10.1073/pnas.1203452109. [DOI] [PMC free article] [PubMed] [Google Scholar]
- Nauen R, Denholm I. Resistance of insect pests to neonicotinoid insecticides: current status and future prospects. Arch Insect Biochem Physiol. 2005;58:200–215. doi: 10.1002/arch.20043. [DOI] [PubMed] [Google Scholar]
- Nauen R, Elbert A. European monitoring of resistance to common classes of insecticides in Myzus persicae and Aphis gossypii (Homoptera: Aphididae) with special reference to imidacloprid. Bull Entomol Res. 2003;93:47–54. doi: 10.1079/BER2002215. [DOI] [PubMed] [Google Scholar]
- Nauen R, Stumpf N, Elbert A. Toxicological and mechanistic studies on neonicotinoid cross resistance in Q-type Bemisia tabaci (Hemiptera: Aleyrodidae) Pest Manag Sci. 2002;58:868–875. doi: 10.1002/ps.557. [DOI] [PubMed] [Google Scholar]
- Nauen R, Bielza P, Denholm I, Gorman K. Age-specific expression of resistance to a neonicotinoid insecticide in the whitefly Bemisia tabaci. Pest Manag Sci. 2008;64:1106–1110. doi: 10.1002/ps.1654. [DOI] [PubMed] [Google Scholar]
- Pfaffl MW. A new mathematical model for relative quantification in real-time RT-PCR. Nucleic Acids Res. 2001;29:e45. doi: 10.1093/nar/29.9.e45. [DOI] [PMC free article] [PubMed] [Google Scholar]
- Pfaffl MW, Tichopad A, Prgomet C, Neuvians TP. Determination of stable housekeeping genes, differentially regulated target genes and sample integrity: BestKeeper – Excel-based tool using pair-wise correlations. Biotechnol Lett. 2004;26:509–515. doi: 10.1023/b:bile.0000019559.84305.47. [DOI] [PubMed] [Google Scholar]
- Porretta D, Gargani M, Bellini R, Medici A, Punelli F, et al. Defence mechanisms against insecticides temephos and diflubenzuron in the mosquito Aedes caspius: the P-glycoprotein efflux pumps. Med Vet Entomol. 2008;22:48–54. doi: 10.1111/j.1365-2915.2008.00712.x. [DOI] [PubMed] [Google Scholar]
- Puinean AM, Foster SP, Oliphant L, Denholm I, Field LM, et al. Amplification of a cytochrome P450 gene is associated with resistance to neonicotinoid insecticides in the Aphid Myzus persicae. Plos Genet. 2010;6:e1000999. doi: 10.1371/journal.pgen.1000999. [DOI] [PMC free article] [PubMed] [Google Scholar]
- Ranson H, Rossiter L, Ortelli F, Jensen B, Hemingway J, et al. Identification of a novel class of insect glutathione S-transferases involved in resistance to DDT in the malaria vector Anopheles gambiae. Biochem J. 2001;359:295–304. doi: 10.1042/0264-6021:3590295. [DOI] [PMC free article] [PubMed] [Google Scholar]
- Rauch N, Nauen R. Biochemical markers linked to neonicotinoid cross-resistance in Bemisia tabaci (Hemiptera: Aleyrodidae) Arch Insect Biochem Physiol. 2003;54:165–176. doi: 10.1002/arch.10114. [DOI] [PubMed] [Google Scholar]
- Riaz MA, Poupardin R, Reynaud S, Strode C, David JP, et al. Impact of glyphosate and benzo[a]pyrene on the tolerance of mosquito larvae to chemical insecticides. Role of detoxification genes in response to xenobiotics. Aquat Toxicol. 2009;93:61–69. doi: 10.1016/j.aquatox.2009.03.005. [DOI] [PubMed] [Google Scholar]
- Roditakis E, Morou E, Tsagkarakou A, Riga M, Vontas J, et al. Assessment of the Bemisia tabaci CYP6CM1vQ transcript and protein levels in laboratory and field-derived imidacloprid-resistant insects and cross-metabolism potential of the recombinant enzyme. Insect Sci. 2011;18:23–29. [Google Scholar]
- Smyth GK. Linear models and empirical bayes methods for assessing differential expression in microarray experiments. Stat Appl Genet Mol. 2004;3:Article 3. doi: 10.2202/1544-6115.1027. [DOI] [PubMed] [Google Scholar]
- Sun DB, Xu J, Luan JB, Liu SS. Reproductive incompatibility between the B and Q biotypes of the whitefly Bemisia tabaci in China: genetic and behavioural evidence. Bull Entomol Res. 2011;101:211–220. doi: 10.1017/S0007485310000416. [DOI] [PubMed] [Google Scholar]
- Vontas JG, Small GJ, Hemingway J. Glutathione S-transferases as antioxidant defence agents confer pyrethroid resistance in Nilaparvata lugens. Biochem J. 2001;357:65–72. doi: 10.1042/0264-6021:3570065. [DOI] [PMC free article] [PubMed] [Google Scholar]
- Wang XW, Luan JB, Li JM, Bao YY, Zhang CX, et al. De novo characterization of a whitefly transcriptome and analysis of its gene expression during development. BMC Genomics. 2010;11:400–410. doi: 10.1186/1471-2164-11-400. [DOI] [PMC free article] [PubMed] [Google Scholar]
- Wang ZY, Yan HF, Yang YH, Wu YD. Biotype and insecticide resistance status of the whitefly Bemisia tabaci from China. Pest Manag Sci. 2010;66:1360–1366. doi: 10.1002/ps.2023. [DOI] [PubMed] [Google Scholar]
- Xie W, Yang X, Wang SL, Yang NN, Zhang YJ, et al. Gene expression profiling in the thiamethoxam resistant and susceptible B-biotype sweetpotato whitefly, Bemisia tabaci. J Insect Sci. 2012a;12:47–61. doi: 10.1673/031.012.4601. [DOI] [PMC free article] [PubMed] [Google Scholar]
- Xie W, Meng QS, Wu QJ, Wang SL, Zhang YJ, et al. Pyrosequencing the Bemisia tabaci transcriptome reveals a highly diverse bacterial community and a robust system for insecticide resistance. PLoS ONE. 2012b;7:e35181. doi: 10.1371/journal.pone.0035181. [DOI] [PMC free article] [PubMed] [Google Scholar]
- Zhang LP, Zhang YJ, Zhang WJ, Wu QJ, Chu D, et al. Analysis of genetic diversity among different geographical populations and determination of biotypes of Bemisia tabaci in China. J Appl Entomol. 2005;129:121–128. [Google Scholar]
Associated Data
This section collects any data citations, data availability statements, or supplementary materials included in this article.
Supplementary Materials
Gene classification in microarray design.
Primers used for qRT-PCR analyses.
All of the differentially expressed genes in three developmental stages.
Gene ontology analysis of Bemisia tabaci in three different developmental stages.
Differentially expressed genes related to metabolic detoxification in three developmental stages.