

Abstract
We analysed the transformation of synaptic input to the pool of motor neurons into the neural drive to the muscle. The aim was to explain the relations between common oscillatory signals sent to motor neurons and the effective component of the neural signal sent to muscles as output of the spinal cord circuitries. The approach is based on theoretical derivations, computer simulations, and experiments. It is shown theoretically that for frequencies smaller than the average discharge rates of the motor neurons, the pool of motor neurons determines a pure amplification of the frequency components common to all motor neurons, so that the common input is transmitted almost undistorted and the non-common components are strongly attenuated. The effective neural drive to the muscle thus mirrors the common synaptic input to motor neurons. The simulations with three models of motor neuron confirmed the theoretical results by showing that the coherence function between common input components and the neural drive to the muscle tends to 1 when increasing the number of active motor neurons. This result, which was relatively insensitive to the type of model used, was also supported experimentally by observing that, in the low-pass signal bandwidth, the peak in coherence between groups of motor units of the abductor digiti minimi muscle of five healthy subjects tended to 1 when increasing the number of motor units. These results have implications for our understanding of the neural control of muscles as well as for methods used for estimating the strength of common input to populations of motor neurons.
Introduction
Muscles receive a neural activation signal from the pool of innervating motor neurons (Heckman & Enoka, 2004). This neural signal is the sum of the spiking activities of motor neurons and is referred to as neural drive to the muscle. The neural drive to the muscle is generated by the transformation of the synaptic input to the motor neurons into output spike trains.
The transformation of synaptic input by each motor neuron is a non-linear process. Therefore, an oscillatory input passing through a motor neuron generates output oscillatory components not necessarily present at the input (Nakao et al. 1997; Negro & Farina, 2011a). Nonetheless, if a common component is the input to several motor neurons, this component will be present at the output of each motor neuron (together with non-linear components) and therefore will be emphasized, relative to other components, in the neural drive to the muscle (Negro & Farina, 2011a,b2011b, 2012). This observation explains the presence of significant EEG–EMG (Mima & Hallett, 1999) and EMG–EMG coherence (Evans & Baker, 2003; Halliday et al. 2003; Boonstra et al. 2007; Keenan et al. 2012). Moreover, it has also been observed that the force signal expressed by a population of motor units is highly correlated with the common component of the output spike trains, in the low-frequency bandwidth of force variability (Negro et al. 2009), whereas independent components of the output spike trains have a less important influence on force (Negro et al. 2009; Dideriksen et al. 2012).
Common (correlated) inputs to motor neurons determine a certain degree of correlation in the output spike trains (e.g. Sears & Stagg, 1976; Kirkwood & Sears, 1978; Farmer et al. 1993) but the degree of correlation in input and that in output are not linearly associated (Rosenbaum et al. 2011; Negro & Farina, 2012). For this reason, classic measures of correlation between motor unit spike trains, such as the common input strength index (CIS) (Nordstrom et al. 1992), inherently depend (in a non-linear way) on the discharge rate of the pair of motor units used for the measure ( De La Rocha et al. 2007).
In this study, we analyse the transformation of common oscillatory input signals to the pool of motor neurons innervating a muscle, with the aim of explaining the relations between common oscillatory components sent to motor neurons and the motor neuron output. Because accurate control requires that distortion of the control signal is small, we hypothesized that the synaptic input to motor neurons is not distorted in the low-frequency bandwidth of the neural drive to the muscle (effective drive). This hypothesis will be tested for the first time in this study using analytical derivations, accurate simulations and experiments. It will be shown that, for sufficiently high forces, the common input to a population of motor neurons is mirrored in the neural drive to the muscle, as hypothesized. This result has implications in our understanding of the neural control of movement as well as for methods used for extracting the degree of common input from the motor neuron output.
Methods
We proceed by proving theoretically the association between the synaptic input to motor neurons and the cumulative motor neuron spike train. This is performed using the approximation of integrate and fire neurons and analytical equations providing the Fourier transform of the output spike trains of these types of neurons when they receive sinusoidal inputs. We further provide a more intuitive explanation of the same results obtained by the Fourier analysis by considering the transformation made by a motor neuron as a sampling process. Finally, we describe the simulation methods and the experimental procedures.
Theory
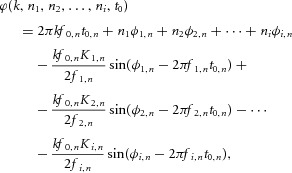
We consider a pool of N motor neurons. Each motor neuron has as input a signal made of the sum of sinusoids, so that the input to the n-th motor neuron can be expressed as:
| 1 |
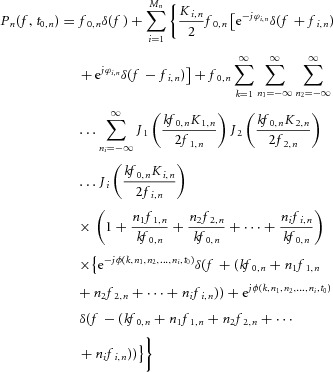
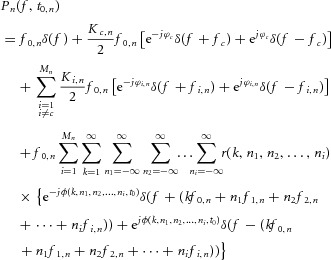
where m0,n is the mean value of the input, mi,n the amplitudes of the Mn sinusoidal input components, fi,n the frequencies of the sinusoids, and ϕi,n the corresponding phases. If we model each motor neuron as a perfect integrate and fire (PIF) neuron, the Fourier transform Pn(f,t0,n) of the output signal for the single motor neuron is given by (Nakao et al. 1997):
 |
2 |
where
 |
Ji(x) are the Bessel functions of i-th order,  is the average discharge rate of the motor neuron,
  is the time instant of the first spike of the train, and Ki,n is the modulation index, defined as:
Equation (2) shows that the response of the single motor neuron n contains components directly related to the input frequencies, as well as components at frequencies that are linear combinations of the input frequencies and of the mean discharge frequency that, in general, are not present in the input. For simplicity, expression (2) can be rewritten as follows:
 |
4 |
where  and
and  are, respectively, the modulus and phase of the interference sinusoids. Let us further assume that, out of the
  components of the input
  , one is also common (in frequency and phase) to the other N – 1 motor neurons in the pool, whereas the other Mn – 1 components are different and independent for each motor neuron. The extension to a subset D > 1 of common components is straightforward and not reported in detail here.
Separating the contribution of the common component from those of the other components, we obtain:
 |
5 |
where fc and ϕc are the frequency and phase of the common component. In the limit where Mn is very large and ϕi,n are randomly distributed, the fourth term of the right-hand side of eqn (5) comprises a large number of contributions whose amplitude [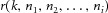 ] decreases with increasing the frequencies of the input sinusoids (see eqn (2) for the expression of
  ) (Rice, 1944). Therefore, the behaviour of the motor neuron is similar to a low-pass filter where the frequencies higher than the average discharge rate are attenuated, as it has been demonstrated previously using a different analytical approach (Knight, 1972).
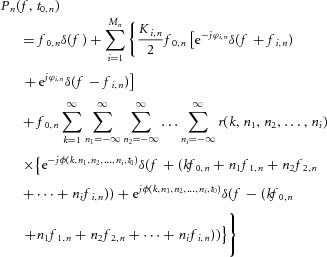
If the input  is transmitted to the N motor neurons, the Fourier transform
  of the cumulative spike train of all active motor neurons is given by (using the linearity of the Fourier transform):
 |
6 |
The first term at the right-hand side of eqn (6) corresponds to the DC component and the second term corresponds to the spectral line of the common sinusoidal component. This spectral line is amplified, with respect to the case of a single motor neuron (eqn (5)), by the factor
that depends only on the amplitude of the input sinusoid and on the neuron mean discharge rate. This gain term does not depend on the frequency value of the oscillatory input so that each input is amplified by a value that does not depend on its frequency. Moreover, the above gain factor increases with the increase in the number of neurons N, and with their discharge frequencies  . For example, if all motor neurons discharge at the same frequency and the common input sinusoids have the same amplitude for each of the N motor neurons, the common component at the cumulative motor neuron output is amplified N times with respect to the case of one motor neuron. All other components in eqn (6) are not amplified by the same amount since they do not sum in phase at the same frequencies (the frequencies of these components are not the same for all motor neurons as long as motor neurons have different discharge rates). Therefore, the common component c progressively increases at the output of the system relative to the other, non-common, components. For N sufficiently large (this will be analysed in the simulations) and for frequencies smaller than the average discharge rate of the motor neurons (thus, for relatively low frequencies), the system output will be mainly made of the common component. Finally, we note from eqn (6) that the motor neuron pool does not introduce any changes in the phase of the common input sinusoid. Therefore, the pool of motor neurons not only acts as a linear filter (Gerstner, 2000) but effectively as an amplifier (pure scaling in signal amplitude, without phase distortion) tuned on the components that are common to all motor neurons. This result extends our previous derivations (Negro & Farina, 2011a) that explained that for N motor neurons the transmission of common input is mostly linear. The present results indicate that the pool of motor neurons is a spatial filter tuned exclusively on the common components and acting with the same gain (see eqn (6) for any common frequency component up to the average discharge rate of the motor neurons. This system exactly reproduces the common synaptic input into the output by a pure amplitude scaling (in the PIF approximation made and for a sufficient number of active motor neurons). From eqn (6), we should finally note that additional spectral components may arise in the output spectral bandwidth relative to the range of motor neuron discharge rates (
 ) (see Discussion) and that are responsible for the attenuation at the high frequencies. In the following, we will focus on the bandwidth from DC to the minimum discharge rate of the active motor neurons, which corresponds to 6–10 Hz. In this bandwidth, the common input is purely transmitted without the spectral lines associated to the discharge rates and the transfer function of the motor neurons is theoretically flat (pure amplification or amplitude scaling). Importantly, this is the bandwidth where most of the energy of the force signal is present and therefore the neural drive within this bandwidth is the effective drive to the muscle (Negro et al. 2009), i.e. the drive that is transformed into force, whereas the drive outside this bandwidth is filtered out by the contractile muscle properties and does not have a large functional impact for force generation. We will refer to the low-pass bandwidth between DC and the minimal motor neuron output frequency as the effective bandwidth and to the motor neuron output within this low-pass bandwidth as the effective neural drive to muscles. From the above observations, the effective neural drive to muscles theoretically tends to mirror the common synaptic input sent to motor neurons when a sufficient number of motor neurons are active.
The above result can be further explained in intuitive terms by considering that the cumulative spike train of the motor neurons (neural drive to the muscle) is the average signal obtained from the samplings of the input signals. Any averaging process enhances the common components. Therefore, any common component at the output of the motor neurons will be enhanced with respect to the others and will be sampled at progressively higher rates with increasing number of motor neurons (Farina & Negro, 2012).
Finally, the force signal is determined by the convolution of each spike train with the corresponding force twitch (Dideriksen et al. 2012). This is approximately the convolution of the cumulative spike train by the average twitch, so that the generated force can be interpreted as the low-pass-filtered version of the common synaptic input to motor neurons.
Simulations
The theoretical derivations proved that the cumulative spike train at the output of a sufficiently large number of PIF motor neuron models corresponds to the amplification of the common synaptic input that the pool of motor neurons receives. We also showed in the above derivations, that the other forms of synaptic input are not transmitted to the output. The theory was derived by assuming a PIF model of motor neurons. It is expected that small deviations from the theoretical results may occur when assuming a more complex motor neuron model. However, the general behaviour should be similar, as previously demonstrated for other types of neurons (Fourcaud-Trocmé et al. 2003). The simulations were based on different models of motor neurons to validate the theoretical predictions.
All the simulations were based on models of pools of motor neurons that received common and independent inputs in varying relative proportions.
A mathematical description of the motor neuron was used, similar to the approach used in previous studies (e.g. Negro & Farina, 2011b). This motor neuron model was based on that described by Cisi & Kohn (2008). It consists of two compartments, six conductances (with three voltage-dependent conductances, Na, Kf and Ks), and four state variables. The pulse-based simplification used in the original model was removed from the present study and a full formulation, previously proposed (Traub & Miles, 1991), was used instead. The motor neuron parameters were the same as used by Cisi & Kohn (2008; their Table 2) and selected according to an exponential distribution over the pool of motor neurons (Fuglevand et al. 1993). The number of motor neurons was set to 300, of which ∼270 motor neurons were fully recruited (discharge rate > 6 pulses s–1) by the offset synaptic input (5 nA) applied in all simulations. This compartmental motor neuron model was used with two ways of simulating the synaptic input: as injection of synaptic current in the soma compartment (model 1) or through synaptic conductances in the dendrite (model 2), generating two modelling approaches. For the synaptic conductances, the synaptic current to the motor neuron was given as the sum of excitatory and inhibitory synapses (ratio equal to 2) in the dendrite compartment. The dynamic of the conductances was simulated as proposed by Rall (1967). The maximal conductances for the excitatory and inhibitory synapses were selected as 600 nS and 500 nS, respectively (Elias et al. 2012). The reversal potentials were 70 mV and –16 mV for excitatory and inhibitory synapses.
A third simulation approach was, as reference, the PIF motor neuron model (no leakage), that matched exactly the theoretical assumptions (model 3). According to this model, when the membrane potential reaches a given threshold, an action potential is generated. The amplitude of the generated action potential was set to an arbitrary value in the simulations with this model. For this model, the threshold of each of 300 motor neurons and the variance of the synaptic noise were selected in order to obtain an average discharge rate of 12 pulses s–1 and a coefficient of variation for the interspike interval (ISI) of ∼15% in all simulations (Maltenfort et al. 1998).
For the PIF model and the soma current input model, the input to motor neurons included a superposition of sinusoids, as described in eqn (1). Some of the sinusoids were assumed as common input, others had random frequency and phase. Non-common-input was obtained by the summation of 80 sinusoids with phase and amplitude independent for each motor neuron, and frequency distributed randomly in the range 1–100 Hz. The amplitude of these sinusoids was tuned to obtain output spike trains with a coefficient of variation for the interspike interval (ISI) of approximately 15% (Maltenfort et al. 1998). A signal-to-noise ratio index was defined as the ratio between the squared amplitude of the common sinusoidal input and the sum of the squared amplitudes of the non-common sinusoidal inputs (power of the common input divided by the power of the non-common input). Representative simulations of model 1 are also shown with a continuous bandwidth input signal rather than the sum of discrete sinusoids. For the conductance-based synaptic model (model 2), the common input was simulated using point processes generated by the PIF model when driven by the sinusoidal inputs previously described that were delivered to the dentritic compartment. To generate physiological discharge rates and coefficient of variation for ISI, a Gaussian synaptic current (0–100 Hz) was also injected into the soma compartment of each motor neuron. This current was simulated as independent for each motor neuron and simulated the variability of the membrane potential generated by other uncorrelated sources. The threshold and input parameters of the PIF model that generated the excitatory and inhibitory inputs were selected to generate discharge rates of the simulated excitatory and inhibitory synaptic inputs equal to 100 pulses s–1 and coefficient of variation for the ISI of ∼1. The signal-to-noise ratio between the common oscillatory input contained in the excitatory and inhibitory synaptic currents and the independent noise (The signal-to-noise ratio between the common oscillatory input contained in the excitatory and inhibitorysynaptic currents and the independent noise (both the independent components present in the excitatory and inhibitory currents injected in the dendritic compartment and the independent components injected into the soma compartment) was selected in order to have an estimated coherence value between pairs of spike trains approximately equal to that of the other models (starting point on the x-axis of Fig.3).
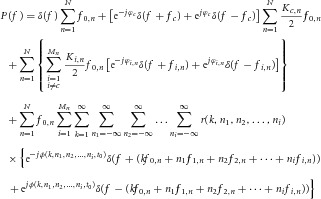
Figure 3. Coherence between the output cumulative spike train (CST) and the common input in simulation.
The coherence value at the common input frequency (5 Hz) is reported as a function of the number of motor neurons (MNs) in the cumulative spike train (CST). Results for three motor neuron models are shown: PIF model (grey lines), compartment model with current input to the soma (continuous line), and compartment model with current injected through synaptic conductances in the dendrites (dashed lines). Three cases of signal-to-noise ratio (SNR) are presented. Each line represents the average value of 50 random combinations of motor neurons in the CST. The three conditions simulated corresponded to a signal-to-noise ratio for the compartment model with input current to the soma of ∼1%, ∼3% and ∼14%. The signal-to-noise ratio for the other two models was adjusted so that the values of coherence when using individual motor units (first point in the curves) were similar (see text for details).
Since the three models used have different ways of simulating the input to the motor neurons, the same signal-to-noise ratio did not correspond to the same level of excitation of the motor neuron population. Therefore, to compare the three models in similar conditions, comparisons are reported in the following not for the same signal-to-noise ratios but for similar levels of coherence between the input signal and individual motor units (not the cumulative spike trains). Three different levels of signal-to-noise ratios (referred to as low, medium and high) were simulated for each model.
The models were implemented in MATLAB. The system of differential equations for the compartment motor neuron model was solved with the Adams–Bashforth–Moulton PECE solver (Shampine & Gordon, 1975), MATLAB command ‘ode113’, using optimized time steps within intervals of 1 ms. The error tolerance was set to 1e-6. Each simulation was 60 s long.
Experiments
The experimental validation of the theoretical derivations and simulations consisted of the premise that if the common synaptic input is transmitted to the output cumulative spike train undistorted, the cumulative spike trains of different sub-sets of motor neurons innervating the same muscle will have the same spectral content, which would correspond to the spectrum of the common input. Therefore, we extracted the spike trains of a relatively large number of motor neurons in a human muscle during voluntary contractions and estimated the coherence function between cumulative spike trains of sub-groups of the detected motor neurons. The coherence was averaged over all the permutations of sub-groups containing from 1 to the maximum number of motor neuron spike trains. The theoretical derivation predicted that such a coherence function would be approximately equal to 1 (perfect association) in the bandwidth of the common input, between DC and the minimal discharge rate of the active motor neurons. The experimental data used for this analysis were collected for the analyses described in Negro et al. (2009).
Five healthy men (mean ± SD, age: 25 ± 4 years) participated in the experiment. The experiment was conducted in accordance with the Declaration of Helsinki and approved by the local ethics committee of Aalborg University (approval number N-20090019) (Negro et al. 2009). All participants signed a written informed consent form before inclusion.
The subject was seated on an adjustable chair with the right arm extended in a force brace (Aalborg University). The fifth finger was fixed in the isometric device for measurement of finger-abduction forces. The forearm and the four digits were fixed with Velcro straps. The force produced by the fifth finger was measured using two force transducers (Interface, Scottsdale, AZ, USA), one in the transverse plane and one in the sagittal plane. The force signal was sampled at 10 kHz and stored on a computer. Visual feedback on the abduction relative force level (% of the maximal voluntary contraction (MVC) force) was provided on an oscilloscope.
Single motor unit action potentials were detected with intramuscular EMG which was recorded using two pairs of Teflon-coated stainless steel wires (diameter 0.1 mm; A-M Systems, Carlsborg, WA, USA) inserted into the muscle with 25-gauge hypodermic needles. The needles were inserted and removed after insertion, leaving the wires inside the muscle. Each wire was cut to expose the cross-section of the tip without insulation. Bipolar intramuscular EMG signals were amplified (Counterpoint EMG, Dantec Medical, Skovlunde, Denmark), band-pass filtered (500 Hz to 5 kHz), and sampled at 10 kHz.
The subjects performed three MVC forces of the abductor digiti minimi muscle with a rest of 2 min in between. The maximum force achieved during the maximal contractions was considered as the reference MVC. The subject then sustained the target force level for 60 s. The target force level analysed in this study corresponded to 5% MVC. The subject had feedback on force during all contractions. During each contraction, the force on the sagittal plane was monitored and contractions during which this force was not negligible were discarded and repeated.
The action potentials of individual motor units were identified from the intramuscular EMG signals recorded from the two locations in the muscle by the use of a decomposition algorithm (McGill et al. 2005). Spike trains across the two locations with peak cross-correlation values higher than 0.5 were assumed to originate from the same motor unit and one of these was discarded from further analysis.
The spike trains of each motor unit were used to extract the average discharge rate and ISI variability of the active units. Moreover, coherence analysis was performed between the cumulative spike trains of two equally sized sub-groups of the identified motor units using the Welch's averaged periodogram method in 5 s non-overlapping windows. All permutations of the detected units in the two groups were used and results were computed varying the number of motor units in each group from 1 to the maximum (half of the number of detected units). The coherence function was investigated between DC and the minimum discharge rate of the detected units, in order to avoid the region of coherence with the spectral components associated to the spiking nature of the motor units (see eqn (6). The peak value of coherence in this bandwidth was computed for all unit permutations. The hypothesis was that this value tended to 1 for an increasing number of motor neurons. A non-parametric Friedman ANOVA, followed by Wilcoxon pair-wise comparisons when needed, was used to compare the z-transformed coherence values varying the number of motor units used for the calculation.
Results
Simulation and experimental results are reported and interpreted with the predictions based on the analytical derivations.
Simulations
Figure1 reports a schematic and representative example of the simulations obtained with the compartmental model with soma current as input (model 1). A sinusoidal input with an oscillatory frequency of 5 Hz is common to five motor neurons. These motor neurons also receive independent inputs. The independent inputs are made of the sum of 80 sinusoids with random phase, amplitude and frequency among motor neurons. The power of the common input is only 3% of the power of the non-common input in this example. Despite this relatively poor signal-to-noise ratio, the neural drive made of the activities of only five motor neurons mainly reflects the common input without phase difference. As reported in the theoretical derivation, the sum of outputs from multiple motor neurons enhances the common components by increasing their sampling rate and rejects the independent components which are asynchronously summed together. Therefore, the signal-to-noise ratio of common input vs. non-common input increases substantially at the output sum of a relatively small number of motor neurons.
Figure 1. Conceptual representation of the simulations.
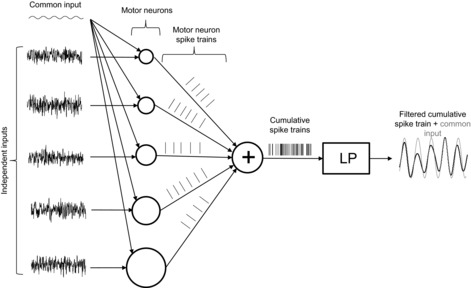
Uncorrelated noise consisting of the sum of 80 sinusoids with random amplitude, frequency and phase is given as the input to each motor neuron (motor neurons are represented by circles). In this example, only five out of the pool of 300 motor neurons are simulated. In addition to the independent noise, a common input (5 Hz sinusoid, shown in the top left corner) is given as input to all motor neurons, with an amplitude corresponding to a signal-to-noise ratio of 0.03 (see text for definition of signal-to-noise ratio). The motor neuron inputs are represented in time intervals of 1 s windows, whereas the motor neuron outputs (spike trains) are shown in intervals of 0.2 s. The summation of the output spike trains (cumulative spike train, CST) represents mainly the common input. This property is best seen by low-pass filtering the output CST in a bandwidth <10 Hz (LP block). The original common input (grey line) is shown superimposed with the low-pass filtered version of the output spike train (black line). LP, low-pass filter.
Figure2 reports a simulation of a pool of motor neurons (model 1), all receiving as current input to the soma the sum of 81 sinusoids. All the sinusoids that constitute the input of each neuron, with the exception of one, have random frequency and phase among motor neurons. The remaining sinusoid has, conversely, the same frequency and phase for all motor neurons, as assumed in the theoretical derivations. The signal-to-noise ratio between common and independent sinusoids was in this example 3%, as in the representative case of Fig.1. The output of the system is the neural drive to the muscle, made of the summation of the motor neuron outputs (Fig.1). The output of a single motor neuron does not allow the identification of the common input to the motor neuron pool (Fig.2A and B). However, the spectral representation of the neural drive to the muscle tends to the spectral content of the common input component (a pure spectral line in this example) when a sufficient number of motor neurons is active (Fig.2C and D represents the case of 10 motor neurons). The simulations are reported for a common input at 5 Hz (Fig.2A and C) and one at 10 Hz (Fig.2B and D), in the same conditions. The two inputs are transmitted with similar gain to the output. The results of these representative simulations are in agreement with the theoretical derivations that predicted that the pool of motor neurons act as a spatial filter tuned on the common input components. The system (input–output from the pool of motor neurons) acts as an amplifier for the common components, with similar gain for each frequency in the effective bandwidth, so that an input with multiple harmonics would not be distorted and would be mirrored at the output.
Figure 2. Simulation according to the scheme in Fig. 1.
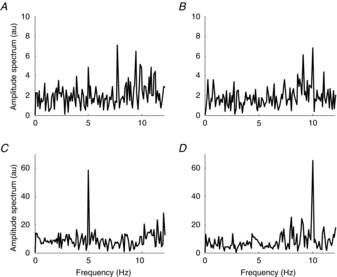
The amplitude spectrum of the spike train of one motor neuron (A and B) and of the cumulative spike train of 10 motor neurons (C and D). All motor neurons received a common input made of a sinusoid of 5 Hz (A and C) and 10 Hz (B and D), respectively. The signal-to-noise ratio between common and non-common inputs is in all cases 0.03. au, arbitrary units.
Figure3 shows the coherence between the effective neural drive to the muscle and the common input component, as a function of the number of motor neurons used for the transmission, for the three numerical models implemented. The three conditions simulated corresponded to a signal-to-noise ratio for model 1 of ∼1%, ∼3% and ∼14%. The signal-to-noise ratio for the other two models was adjusted so that the starting point of the curves (coherence between the common input and one single motor unit) was similar. As predicted by the theoretical derivations, the greater the number of motor neurons, the closer the resemblance of the output signal to the common input, as indicated by an increase in coherence value which tends to the saturation point. Interestingly, in general a relatively small number of motor neurons is sufficient to reach a plateau in coherence. Therefore, when a relatively small number of neurons are active, the cumulative spike train of the active motor neurons approximately replicates the common input signal in the effective bandwidth. The number of neurons needed for reaching this condition depends on the initial signal-to-noise-ratio, i.e. on the strength of common input with respect to the independent inputs, as expected. The three numerical models provided similar results, in agreement with the theoretical predictions (based on the PIF model), suggesting that the conclusions made are model-independent and have general validity. Extensive data analyses (not shown) suggested that none of the following analyses depended on the model chosen, as occurred for the results in Fig.3, and therefore, for clarity, we will only present the results from model 1 in the following.
The above results imply that a common input with a certain bandwidth contained within the effective bandwidth is transmitted without distortion to the motor neuron output, since all its Fourier frequency components will be amplified with a similar gain. Figure4 proves this observation by reporting the transmission of a common input signal with bandwidth between DC and 10 Hz through a pool of motor neurons (compartmental model with input current to the soma, model 1) with the presence of independent noise of greater bandwidth. Contrary to the previous simulations which considered one pure sinusoid as common input, in this simulation the common input has a continuous bandwidth. When derived from a small number of neurons, the output cumulative spike train has substantially different spectral representation with respect to the common synaptic input (Fig.4A). However, the two spectra become very similar for a larger number of neurons (Fig.4A and B), indicating minimal distortion of the common input. This result is in agreement with the observations made in Fig.1. Figure4C shows high similarity between the power spectra of the common synaptic input injected in the motor neurons and of the output cumulative spike train when 50 motor neurons are analysed. This result shows that the effect of the array of motor neurons is approximately a pure amplification of only common components and filtering out of non-common components.
Figure 4. Spectrum of the common synaptic input and of the neural drive to muscle.
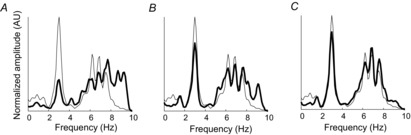
The normalized, smoothed (10 point hamming window) amplitude spectra of the common motor neuron input (thin line), and of one randomly selected motor neuron spike train (thick line; A); and of the cumulative spike trains (CSTs) of 5 (B), and 50 (C) randomly selected motor neurons (thin line). The signal-to-noise ratio in this simulation was 0.14 (advanced motor neuron model with current input to the soma). AU, arbitrary units.
Experiments
The rationale for the experiments was that two subgroups of motor neurons randomly selected would generate two cumulative spike trains with high coherence in the bandwidth between DC and the motor unit discharge rates because both would reflect the common input to the entire pool of motor neurons (in ideal conditions, they would be the same signal). This hypothesis was tested by computing the maximum coherence value between groups of spike trains in a bandwidth between DC and the minimal motor unit discharge rate.
Figure5 shows typical experimental data and the decomposition of the EMG signals into individual motor unit action potentials. The decomposed EMG and the force signals are shown, together with the low-pass-filtered motor unit cumulative spike train. It is interesting to observe the relatively high similarity between force and the smoothed cumulative spike train, with a delay indicating the electromechanical delay. The similarity between these two signals, shown representatively in this example, is in agreement with the concept that the effective drive to the muscle is a low-pass-filtered version of the motor unit cumulative spike train. Since the cumulative spike train is the superposition of the motor neuron spike trains, its low-passed version reproduces mainly common components which reflect the common synaptic input to the motor neurons. Therefore, the observation of similarity between force and filtered cumulative spike train is in agreement with the main theoretical conclusions of this study. Nonetheless, in this study the theoretical observations and simulations were validated in a more direct way using the experimental data, by showing that sufficiently large and separated groups of motor units share similar smoothed cumulative spike trains.
Figure 5. Representative experimental data.
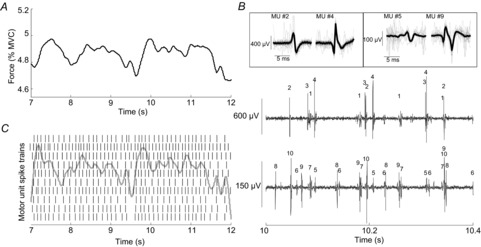
A, force trace for the abductor digiti minimi at 5% MVC. B, decomposition of the two intramuscular EMG signals. Each number on the raw signal traces corresponds to a motor unit. C, the decomposed motor unit spike trains are also shown with, superimposed, the envelope (low-pass-filtered at 10 Hz) of the cumulative spike train comprising all identified motor units spike trains (n = 10) (grey line).
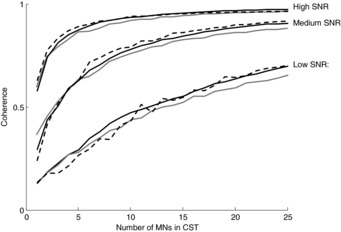
From the group data of the five subjects, the number of reliably detected motor units varied between 7 and 13 per subject. These units had average discharge rates of 10.5 ± 2.4 pulses s–1, and coefficient of variation for the ISI of 25.4 ± 10.2%. Figure6A shows an example of coherence function between sub-groups of motor unit discharge times for one subject. When increasing the number of motor units used for the calculation, the coherence function within a bandwidth of 10 Hz increased and tended to the value of 1 for all frequency values within this bandwidth. To investigate this phenomenon in the group data, we computed the peak value of the coherence function. Figure6B reports the peak coherence values between groups of motor units for all subjects investigated, when varying the number of motor units used for the computation of the cumulative spike trains. From the average data for all subjects, a non-parametric Friedman ANOVA, followed by Wilcoxon pair-wise comparison, indicated that the z-transformed values of coherence were statistically different (P < 0.0001) when using 1–4 motor unit spike trains for coherence estimation, whereas z-transformed coherence values were statistically the same when computed with 4 and 5 units (P = 0.82). The behaviour of coherence with the number of motor units in these experimental data is fully in agreement with the theoretical predictions and with the simulation results (compare Fig.6 with Fig.3). The coherence values tend to 1 when increasing the number of motor neurons with a trend similar to the simulation results reported in Fig.3 with signal-to-noise ratio between 3% and 14%. These observations support, with experimental evidence, the predictions based on the theoretical analysis and the simulations.
Figure 6. Experimental coherence between cumulative motor unit spike trains.
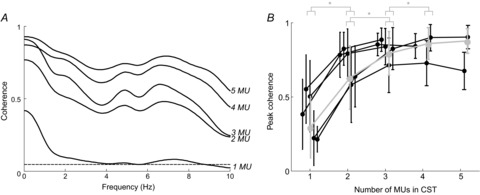
A, representative average coherence between cumulative spike trains consisting of 1–5 motor units (MUs) of one subject. B, peak of coherence values (±SD over all permutations of MU spike trains) as a function of the number of motor units per group in the frequency bandwidth below the minimum discharge rate (effective bandwidth; see text for defininition). The values are presented separately for each of the 5 subjects. In two of the 5 subjects, 7 motor neurons were identified, allowing cumulative spike trains (CSTs) of up to only 3 motor neurons per group, whereas more motor neurons were identified for the other subjects, allowing CSTs of up to 4 and 5 motor neurons, respectively. * (P < 0.05) indicates significant difference between the values of peak coherence obtained in consecutive number of motor units per group.
Discussion
The study showed that the system that associates inputs delivered to a pool of motor neurons with the respective overall pool output (i.e. the transformation between synaptic input to the motor neuron pool into the neural drive to the muscle) is tuned for the transmission of exclusively common input. This transmission is undistorted (equal gain for each Fourier frequency) for inputs with bandwidth lower than the average discharge rate of the pool of motor neurons and for a sufficient number of active motor neurons. The network of motor neurons thus acts as a spatial or ensemble filter that preserves the common input components to the motor neurons and reduces the non-common components. In this view, this study has shown theoretically, by simulation analysis, and experimental analysis, that the neural drive to the muscles in the low frequency bandwidth (the only part effective for force generation) mirrors the common synaptic input to motor neurons in the same bandwidth.
In a previous study, we showed that linear transmission of synaptic input to the output of the motor neuron pool is possible because of the spread of common input to the pool of motor neurons (Negro & Farina, 2011a). In the present study, we have further demonstrated that under the condition of spreading of common input to the motor neurons, the cumulative motor neuron spike train tends to reflect the common input, i.e. the pool of motor neurons not only acts as a linear filter, but it can be viewed as a pure amplifier by transmitting all common input components with approximately the same gain and zero phase shift, thus leaving the common input undistorted (e.g. Fig.4). The condition of pure transmission of common input to the neural drive to the muscle requires a relatively small number of motor neurons (at least for relatively high signal-to-noise ratios; see Fig.3) and therefore it applies to a very large proportion of the working force range of the muscle. Below the required number of motor neurons, the neural drive to the muscle is a noisy version of the common input. These results may indicate a simple way for the central nervous system to control smooth movements out of non-linear basic elements with high synaptic noise (motor neurons), which cannot be avoided because of the synaptic bombardment of excitatory and inhibitory inputs (Berg et al. 2007) and the several sources of synaptic input (Hoffer et al. 1981). In the present study it is indeed shown that transmission through an array of motor neurons substantially increases the signal-to-noise ratio between common and non-common input, even for a relatively small number of motor neurons, so that the output (effective drive) has a much higher signal-to-noise ratio than the input (Figs1 and 4). The motor neuron pool thus performs an extremely effective and selective filtering of the synaptic input.
According to the present results, the muscle control can be divided into two force ranges. For low forces, below the level of saturation in Fig.3, the input–output relation between synaptic input to motor neurons and neural drive to the muscle is non-linear and noisy. This also derives from the observation that the coherence values are low when the number of motor neurons used for the cumulative spike train is small (corresponding to low force values) (Bendat & Piersol, 2010). For higher forces, the noise is attenuated and the motor neuron pool does not further distort the common input signal. The first region corresponds to the most challenging and less accurate control by the central nervous system. The separation point between these two working regions, which is obviously a progressive distinction and not a sharp one, is a force level that depends on the signal-to-noise ratio between common and non-common input and on the number of motor neurons innervating the muscle. The greater this ratio and the total number of motor neurons, the smaller is the relative force that separates the two muscle working regions. Functionally, the force level above which the common input is transmitted with negligible noise to the neural drive to the muscle decreases when the input signal-to-noise ratio increases.
The results of this study are in agreement with the observation that the synaptic noise producing the random variability in spike timing observed in individual motor neurons does not influence substantially the force variability as long as a sufficient number of motor neurons are active (Negro et al. 2009; Dideriksen et al. 2012). The random spike timing variability is indeed due to independent input noise which is filtered by the pool of motor neurons, as demonstrated in the present study. Furthermore, we have previously defined the first common component (FCC) of motor unit spike trains as the first principal component of the low-pass-filtered spike trains (Negro et al. 2009). In the view of the present study, this component not only is the effective neural drive to the muscle, since it reflects the force signal (Negro et al. 2009), but it is also an estimate of the effective control signal. From the present results, we can indeed conclude that the signal FCC previously defined (Negro et al. 2009) is an estimation of the low-frequency components of the common synaptic input received by the motor neurons.
In addition to the common component of the synaptic input, the cumulative spike train also contains spectral components corresponding to the average discharge rates of the motor neurons. This occurs because the discharge rates of different motor neurons are similar if the motor neurons have similar recruitment thresholds and therefore the spectral components at  in eqn (2) are similar for several motor neurons. In the frequency band corresponding to the range of motor neuron discharge rates (∼6 Hz up to 30–40 Hz, depending on the contraction level; Heckman & Enoka, 2004), the transmission of common input is thus distorted by these components, inherently associated to the spiking properties of the motor neurons. However, this bandwidth of the neural drive to the muscle is minimally effective for voluntary force control since the contractile characteristics of the muscle act as a low-pass filter of the neural signal in a bandwidth mainly below 5–6 Hz (Negro et al. 2009). Pathological conditions of tremor in which higher frequency components (5–10 Hz) are enhanced in the generated force are probably due to a resonance of the neural and mechanical system (Lakie et al. 2012), and are not examined in this study.
The present study is limited to low-frequency components of the neural drive to muscle. These components are those directly influencing force generation since greater frequencies are effectively attenuated by the contractile properties of the muscle. Therefore, these components should be controlled by the central nervous system to exert muscle force. Nonetheless, several studies on EEG–EMG coherence showed that this is significant mainly for oscillations at ∼20 Hz (Conway et al. 1995; Salenius et al. 1997; Halliday et al. 1999; Pfurtscheller & Lopes da Silva, 1999; Baker & Baker, 2003). It has been suggested that significant corticomuscular coherence indicates the effective transmission of cortical oscillations along the corticospinal tract and through the monosynaptic connections between cortical neurons and spinal motor neurons (Conway et al. 1995). The absence of EEG–EMG coherence at low frequencies and the observation that in this frequency bandwidth the neural drive is effective for force generation may indicate that the low-frequency oscillatory inputs necessary for force control are transmitted by a higher-frequency carrier, most likely in the beta band. However, there is no evidence for the specific way in which this modulation may occur and how the low-frequency information can be extracted from a higher-frequency carrier in order to be transmitted to the neural drive to muscles.
In addition to investigations on neural connectivity, the present results have also reflections on classic methods used for quantifying the strength of common synaptic input (synchronization) to motor neurons. First, since the effective drive to the muscle is only due to the common input, the functional meaning of the degree of common input to motor neurons (Nordstrom et al. 1992) should be reconsidered (since all effective input is common anyway for most force levels). Although from a different perspective, this conclusion corresponds to the observation that studying the random variability in discharge in individual motor neurons (independent noise) is not informative about the variability in the force signal (i.e. the resulting motor function) for medium to high forces (Negro et al. 2009; Dideriksen et al. 2012). Second, the estimate of the relative strength of common input from correlation analysis of pairs of motor units (Nordstrom et al. 1992) is not possible. Indeed, the common input is not sufficiently well sampled in the pair and the independent input is not linearly transmitted by the pair (see, for example, Fig.2 in the present study).
Limitations
The conclusions of this study were drawn from a combination of theoretical derivations, simulations and experiments. The analytical derivations allowed us to draw general conclusions within the scope of the simple PIF neuron model. Nonetheless, the approach of this study included numerical simulations of a compartmental model in addition to simulations with the PIF model. These simulations could not provide general conclusions, contrary to the analytical derivations, but showed that the analytical solution matched well the results obtained with the more realistic model. Moreover, the theoretical analysis was limited to sinusoidal signals as input, which contrasts with the type of input received by motor neurons that is partially random and with relatively large bandwidth. However, we provided a solution to the input–output relation of the motor neuron for the sum of an arbitrary number of sinusoids, with arbitrary phases and amplitudes (see eqn (1), which is a relevant result because the sum of a sufficient number of sinusoids approximates any signal. Indeed, this aspect was also tested in numerical simulations that included large bandwidth input signals (Fig.4) which provided output cumulative spike trains with spectral properties predicted by the theoretical derivations.
Other choices related to some of the simulations were partly arbitrary. For example, the simulations were designed so that the coefficient of variation for the ISI of the motor neurons was approximately 15% whereas it may be greater in some experimental conditions. However, this choice does not impact the conclusions of the work. Finally, the results from the theory and the simulations were both verified with experimental data. Figure6B, for example, shows the gradual increase in coherence values for the low-frequency bandwidth and its tendency to converge to a constant value of 1 in that bandwidth. This observation is remarkably in agreement with the theory and simulations. The theoretical predictions were thus confirmed by both the numerical simulations and the experiments. By this validation, it was then possible to infer more general results from the theory. The experimental data were limited to low forces (5% MVC) for reliably discriminating motor units. Although at this contraction level the number of recruited motor neurons is relatively small, the experimental data allowed the analysis of up to 10 motor units concurrently (from two recording sites) from which the tendency of coherence to reach the value of 1 was evident.
In conclusion, this study has demonstrated that the common input to motor neurons is mirrored in the low-pass bandwidth of the summed motor neuron outputs, up to frequencies corresponding to the motor neuron discharge rates and for a sufficient (relatively small) number of motor neurons. This range of frequencies is functionally the most relevant due to the low-pass filtering effect of the muscle contraction. The motor neuron pool acts as a pure amplifier, tuned on the common input, with similar gain for different common Fourier frequency components. Based on these results, classic methods based on pairs of motor unit spike trains for estimating the relative strength of common input with respect to other independent inputs have limited relevance both from the functional and the methodological view. Rather, a more meaningful analysis would be the estimate of the input signal-to-noise ratio between common and non-common inputs to the pool of motor neurons (Negro et al. 2013).
Acknowledgments
We are grateful to an anonymous reviewer for the detailed comments and, in particular, for detecting a mistake in one of the equations.
Glossary
- ISI
interspike interval
- MVC
maximal voluntary contraction
- PIF neuron
perfect integrate and fire neuron
Key points
Despite the non-linear property of individual motor neurons, the pool of motor neurons linearizes the relation between their common synaptic input and the neural drive to the muscle, i.e. the ensemble of axonal action potentials reaching the muscle from the spinal cord.
In the frequency bandwidth relevant for force generation, the motor neuron pool attenuates the input signals sent independently to each motor neuron and transfers only the common signal components with a pure scaling.
The effective neural drive to the muscle tends to exactly replicate, without phase distortion, the common synaptic input to motor neurons for increasing number of active motor neurons.
The classic definition and functional meaning of motor unit synchronization are discussed in relation to the role of common input in determining the neural drive to muscle.
Additional information
Competing interests
None declared.
Author contributions
All authors have significantly contributed to the conception and design of the study, analysis and interpretation of data, and drafting of the article. All authors have approved the final version of the manuscript for publication.
Funding
We acknowledge financial support from the European Research Council Advanced Grant DEMOVE (contract no. 267888; to D.F.).
References
- Baker MR. Baker SN. The effect of diazepam on motor cortical oscillations and corticomuscular coherence studied in man. J Physiol. 2003;546:931–942. doi: 10.1113/jphysiol.2002.029553. [DOI] [PMC free article] [PubMed] [Google Scholar]
- Bendat JS. Piersol AG. Random Data: Analysis and Measurement Procedures. Wiley Press; 2010. [Google Scholar]
- Berg RW, Alaburda A. Hounsgaard J. Balanced inhibition and excitation drive spike activity in spinal half-centers. Science. 2007;315:390–393. doi: 10.1126/science.1134960. [DOI] [PubMed] [Google Scholar]
- Boonstra TW, Daffertshofer A, van As E, van der Vlugt S. Beek PJ. Bilateral motor unit synchronization is functionally organized. Exp Brain Res. 2007;178:79–88. doi: 10.1007/s00221-006-0713-2. [DOI] [PubMed] [Google Scholar]
- Cisi RR. Kohn AF. Simulation system of spinal cord motor nuclei and associated nerves and muscles, in a Web-based architecture. J Comput Neurosci. 2008;25:520–542. doi: 10.1007/s10827-008-0092-8. [DOI] [PubMed] [Google Scholar]
- Conway BA, Halliday DM, Farmer SF, Shahani U, Maas P, Weir AL. Rosenberg JR. Synchronization between motor cortex and spinal motoneuronal pool during the performance of a maintained motor task in man. J Physiol. 1995;489:917–924. doi: 10.1113/jphysiol.1995.sp021104. [DOI] [PMC free article] [PubMed] [Google Scholar]
- De La Rocha J, Doiron B, Shea-Brown E, Josić K. Reyes A. Correlation between neural spike trains increases with firing rate. Nature. 2007;448:802–806. doi: 10.1038/nature06028. [DOI] [PubMed] [Google Scholar]
- Dideriksen JL, Negro F, Enoka RM. Farina D. Motor unit recruitment strategies and muscle properties determine the influence of synaptic noise on force steadiness. J Neurophysiol. 2012;107:3357–3369. doi: 10.1152/jn.00938.2011. [DOI] [PMC free article] [PubMed] [Google Scholar]
- Elias LA, Chaud VM. Kohn AF. Models of passive and active dendrite motoneuron pools and their differences in muscle force control. J Comput Neurosci. 2012;33:515–531. doi: 10.1007/s10827-012-0398-4. [DOI] [PubMed] [Google Scholar]
- Evans CMB. Baker SN. Task-dependent intermanual coupling of 8-Hz discontinuities during slow finger movements. Eur J Neurosci. 2003;18:453–456. doi: 10.1046/j.1460-9568.2003.02751.x. [DOI] [PubMed] [Google Scholar]
- Farina D. Negro F. Accessing the neural drive to muscle and translation to neurorehabilitation technologies. IEEE Rev Biomed Eng. 2012;5:3–14. doi: 10.1109/RBME.2012.2183586. [DOI] [PubMed] [Google Scholar]
- Farmer SF, Swash M, Ingram DA. Stephens JA. Changes in motor unit synchronization following central nervous lesions in man. J Physiol. 1993;463:83–105. doi: 10.1113/jphysiol.1993.sp019585. [DOI] [PMC free article] [PubMed] [Google Scholar]
- Fourcaud-Trocmé N, Hansel D, van Vreeswijk C. Brunel N. How spike generation mechanisms determine the neuronal response to fluctuating inputs. J Neurosci. 2003;23:11628–11640. doi: 10.1523/JNEUROSCI.23-37-11628.2003. [DOI] [PMC free article] [PubMed] [Google Scholar]
- Fuglevand AJ, Winter DA. Patla AE. Models of recruitment and rate coding organization in motor-unit pools. J Neurophysiol. 1993;70:2470–2488. doi: 10.1152/jn.1993.70.6.2470. [DOI] [PubMed] [Google Scholar]
- Gerstner W. Population dynamics of spiking neurons: fast transients, asynchronous states, and locking. Neural Comput. 2000;12:43–89. doi: 10.1162/089976600300015899. [DOI] [PubMed] [Google Scholar]
- Halliday DM, Christensen LOD, Hansen NL, Petersen NP, Conway BA. Nielsen JB. Functional coupling of motor units is modulated during walking in human subjects. J Neurophysiol. 2003;89:960–968. doi: 10.1152/jn.00844.2002. [DOI] [PubMed] [Google Scholar]
- Halliday DM, Conway BA, Farmer SF. Rosenberg JR. Load-independent contributions from motor-unit synchronization to human physiological tremor. J Neurophysiol. 1999;82:664–675. doi: 10.1152/jn.1999.82.2.664. [DOI] [PubMed] [Google Scholar]
- Heckman CJ. Enoka RM, Eisen A. Neurophysiology of Motor Neuron Diseases, Handbook of Clinical Neurophysiology. Vol. 4. Amsterdam: Elsevier B.V; 2004. Physiology of the motor neuron and the motor unit; pp. 119–147. Vol., ed. [Google Scholar]
- Hoffer JA, O'Donovan MJ, Pratt CA. Loeb GE. Discharge patterns of hindlimb motoneurons during normal cat locomotion. Science. 1981;213:466–467. doi: 10.1126/science.7244644. [DOI] [PubMed] [Google Scholar]
- Keenan KG, Massey WV, Walters TJ. Collins JD. Sensitivity of EMG-EMG coherence to detect the common oscillatory drive to hand muscles in young and older adults. J Neurophysiol. 2012;107:2866–2875. doi: 10.1152/jn.01011.2011. [DOI] [PubMed] [Google Scholar]
- Kirkwood PA. Sears TA. The synaptic connexions to intercostal motoneurones as revealed by the average common excitation potential. J Physiol. 1978;275:103–134. doi: 10.1113/jphysiol.1978.sp012180. [DOI] [PMC free article] [PubMed] [Google Scholar]
- Knight BW. Dynamics of encoding in a population of neurons. J Gen Physiol. 1972;59:734–766. doi: 10.1085/jgp.59.6.734. [DOI] [PMC free article] [PubMed] [Google Scholar]
- Lakie M, Vernooij CA, Osborne TM. Reynolds RF. The resonant component of human physiological hand tremor is altered by slow voluntary movements. J Physiol. 2012;590:2471–2483. doi: 10.1113/jphysiol.2011.226449. [DOI] [PMC free article] [PubMed] [Google Scholar]
- McGill KC, Lateva ZC. Marateb HR. EMGLAB: An interactive EMG decomposition program. J Neurosci Methods. 2005;149:121–133. doi: 10.1016/j.jneumeth.2005.05.015. [DOI] [PubMed] [Google Scholar]
- Maltenfort MG, Heckman CJ. Rymer WZ. Decorrelating actions of Renshaw interneurons on the firing of spinal motoneurons within a motor nucleus: a simulation study. J Neurophysiol. 1998;80:309–323. doi: 10.1152/jn.1998.80.1.309. [DOI] [PubMed] [Google Scholar]
- Mima T. Hallett M. Corticomuscular coherence: a review. J Clin Neurophysiol. 1999;16:501–511. doi: 10.1097/00004691-199911000-00002. [DOI] [PubMed] [Google Scholar]
- Nakao M, Norimatsu M, Mizutani Y. Yamamoto M. Spectral distortion properties of the integral pulse frequency modulation model. IEEE Trans Biomed Eng. 1997;44:419–426. doi: 10.1109/10.568918. [DOI] [PubMed] [Google Scholar]
- Negro F, Dideriksen JL, Yavuz U. Farina D. San Diego, CA, USA: Society for Neuroscience; 2013. Motor unit synchronization revisited: Estimation of the strength of common synaptic input to populations of motor neurons. Program No. 746.01/TT12. 2013 Neuroscience Meeting Planner. [Google Scholar]
- Negro F. Farina D. Linear transmission of cortical oscillations to the neural drive to muscles is mediated by common projections to populations of motoneurons in humans. J Physiol. 2011a;589:629–637. doi: 10.1113/jphysiol.2010.202473. [DOI] [PMC free article] [PubMed] [Google Scholar]
- Negro F. Farina D. Decorrelation of cortical inputs and motoneuron output. J Neurophysiol. 2011b;106:2688–2697. doi: 10.1152/jn.00336.2011. [DOI] [PubMed] [Google Scholar]
- Negro F. Farina D. Factors influencing the estimates of correlation between motor unit activities in humans. PLoS One. 2012;7:e44894. doi: 10.1371/journal.pone.0044894. [DOI] [PMC free article] [PubMed] [Google Scholar]
- Negro F, Holobar A. Farina D. Fluctuations in isometric muscle force can be described by one linear projection of low-frequency components of motor unit discharge rates. J Physiol. 2009;587:5925–5938. doi: 10.1113/jphysiol.2009.178509. [DOI] [PMC free article] [PubMed] [Google Scholar]
- Nordstrom MA, Fuglevand AJ. Enoka RM. Estimating the strength of common input to human motoneurons from the cross-correlogram. J Physiol. 1992;453:547–574. doi: 10.1113/jphysiol.1992.sp019244. [DOI] [PMC free article] [PubMed] [Google Scholar]
- Pfurtscheller G. Lopes da Silva FH. Event-related EEG/MEG synchronization and desynchronization: Basic principles. Clin Neurophysiol. 1999;110:1842–1857. doi: 10.1016/s1388-2457(99)00141-8. [DOI] [PubMed] [Google Scholar]
- Rall W. Distinguishing theoretical synaptic potentials computed for different soma-dendritic distributions of synaptic input. J Neurophysiol. 1967;30:1138–1168. doi: 10.1152/jn.1967.30.5.1138. [DOI] [PubMed] [Google Scholar]
- Rice SO. Mathematical analysis of random noise. Bell Syst Tech J. 1944;23:282–332. [Google Scholar]
- Rosenbaum R, Trousdale J. Josić K. The effects of pooling on spike train correlations. Front Neurosci. 2011;5:10. doi: 10.3389/fnins.2011.00058. [DOI] [PMC free article] [PubMed] [Google Scholar]
- Salenius S, Portin K, Kajola M, Salmelin R. Hari R. Cortical control of human motoneuron firing during isometric contractions. J Neurophysiol. 1997;77:3401–3405. doi: 10.1152/jn.1997.77.6.3401. [DOI] [PubMed] [Google Scholar]
- Sears TA. Stagg D. Short-term synchronization of intercostal motoneurone activity. J Physiol. 1976;263:357–381. doi: 10.1113/jphysiol.1976.sp011635. [DOI] [PMC free article] [PubMed] [Google Scholar]
- Shampine LF. Gordon MK. Computer Solution of Ordinary Differential Equations: The Initial Value Problem. San Francisco: W. H. Freeman; 1975. [Google Scholar]
- Traub RD. Miles R. Neuronal Networks of the Hippocampus. Cambridge University Press; 1991. [Google Scholar]