

Abstract
Circulating Ang II activates an aldosterone-mineralocorticoid receptor (MR) – angiotensin II (Ang II) – angiotensin type 1 receptor (AT1R) pathway in the hypothalamus. To obtain insights into the actual neuronal projections involved, adeno-associated virus carrying small interfering RNA against either AT1aR (AAV-AT1aR-siRNA) or MR (AAV-MR-siRNA) were infused into the paraventricular nucleus (PVN) in Wistar rats. Intra-PVN infusion of AAV-AT1aR-siRNA or AAV-MR-siRNA decreased AT1R or MR expression in the PVN but not in the subfornical organ (SFO) or supraoptic nucleus (SON). Subcutaneous infusion of Ang II at 500 ng kg−1 min−1 for 2 weeks increased mean arterial pressure by 60–70 mmHg, and increased AT1R and MR expression in the SFO, SON and PVN. Intra-PVN AT1aR-siRNA prevented the Ang II-induced increase in AT1R but not MR expression in the PVN, and MR-siRNA prevented MR but not AT1R expression in the PVN. The increases in AT1R and MR expression in both the SFO and the SON were not changed by the two AAV-siRNAs. Specific knockdown of AT1R or MR in the PVN by AAV-siRNA each prevented most of the Ang II-induced hypertension. Prevention of the subcutaneous Ang II-induced increase in MR but not the increase in AT1R by knockdown of MR and vice versa suggests an independent regulation of MR and AT1R expression in the PVN. Both AT1R and MR activation in the PVN play a critical role in Ang II-induced hypertension in rats.
Introduction
The brain renin–angiotensin–aldosterone system (RAAS) plays a crucial role in the regulation of blood pressure (BP) by the circulating RAAS. A chronic increase in circulating Ang II by systemic infusion of Ang II causes neuronal activation in forebrain and hypothalamic nuclei (Davern & Head 2007; Huang et al. 2010), increases hypothalamic aldosterone content (Huang et al. 2010) and leads to progressive hypertension (Li et al. 1996; Fink, 1997; King & Fink, 2006; Huang et al. 2010; Xue et al. 2011). Chronic intra-cerebroventricular (icv) infusion of an aldosterone synthase (AS) inhibitor or a mineralocorticoid receptor (MR) blocker markedly attenuates Ang II-induced activation of magnocellular and parvocellular neurons in the paraventricular nucleus (PVN) but not the neuronal activation in the subfornical organ (SFO) or supraoptic nucleus (SON) (Huang et al. 2010). Intra-cerebroventricular infusion of an AS inhibitor (Huang et al. 2010), an MR blocker (Huang et al. 2010; Xue et al. 2011), Digibind to bind endogenous ouabain (EO) (Huang et al. 2010) or an angiotensin II type 1 receptor (AT1R) blocker (Zimmerman et al. 2004) prevents most of the progressive increase in BP by Ang II. We proposed that a chronic increase in circulating Ang II activates an aldosterone–MR–EO neuromodulatory mechanism which maintains increased activity in angiotensinergic pathways from the PVN to the rostral ventrolateral medulla (RVLM)/intermediolateral nucleus (IML), and is essential for the CNS component of the progressive hypertension (Huang et al. 2010, 2013b; Gabor & Leenen, 2012).
A variety of studies have shown that the forebrain circumventricular organs, SFO and organum vasculosum of the lamina terminalis (OVLT), relay signals of circulating Ang II to downstream nuclei (Collister & Hendel, 2005; Vieira et al. 2010), which depends on increased reactive oxygen species (ROS) in the SFO (Lob et al. 2013). Projections from the SFO/OVLT to the PVN (Ferguson, 2009) appear to play a critical role in the Ang II-induced neurogenic hypertension. Chronic subcutaneous (sc) infusion of Ang II increases AT1R expression in both magnocellular and parvocellular regions of the PVN as assessed by immunofluorescence (Wei et al. 2009), and MR and AS mRNA expression in the PVN as assessed by RT-PCR (Xue et al. 2012). Bilateral PVN infusion of the AT1R blocker candesartan for 10 min fully reverses the Ang II-induced hypertension (Gabor & Leenen, 2013). Whether this AT1R stimulation in the PVN is caused by Ang II released from angiotensinergic projections from the SFO/OVLT (Bains et al. 1992; Wright et al. 1993; Ku et al. 1999) has not yet been studied.
Where and how the aldosterone–MR–EO neuromodulatory mechanism interacts with angiotensinergic pathways has not yet been resolved. MRs are distributed throughout the hypothalamus and appear prominent in magnocellular neurons of the PVN and SON and less in parvocellular neurons of the PVN (Amin et al. 2005). Intra-cerebroventricular infusion of aldosterone increases AT1R expression and AT1R densities in both magnocellular and parvocellular regions of the PVN (Zhang et al. 2008; Huang et al. 2011), which is prevented by icv infusion of an MR blocker or Digibind (Huang et al. 2011). Intra-cerebroventricular infusion of an MR blocker both prevents (Huang et al. 2010) and reverses (Gabor & Leenen, 2013) Ang II-induced hypertension, and normalizes BP responses to an AT1R blocker in the PVN (Gabor & Leenen, 2013). However, studies using icv infusions of agonists or antagonists do not pinpoint the primary location of action and which actions are secondary. We hypothesized (Huang et al. 2010) that a chronic increase in circulating Ang II increases neuronal activity in the SFO and OVLT, which is relayed directly to pre-sympathetic parvocellular neurons in the PVN, and also relayed to magnocellular neurons in the SON or PVN causing local production of aldosterone. This aldosterone via MR increases EO in magnocellular neurons of the PVN (Yoshika et al. 2011), and thereby enhances AT1R expression and signalling in parvocellular neurons of the PVN. To test this concept, we used recombinant adeno-associated virus carrying small interfering RNA (AAV-siRNA) to selectively and persistently knockdown MR or AT1R in the PVN. siRNA silencing with AAV vector for AT1R or MR has been studied icv (Xue et al. 2011), but not locally to knockdown AT1R or MR in specific nuclei such as the PVN. siRNA silencing with adenovirus for NADPH oxidase NOX2 or NOX4 in the PVN attenuates aldosterone-salt hypertension in mice (Xue et al. 2012a).
In the present study, we infused AAV carrying siRNA to knockdown AT1R or MR in the PVN of Wistar rats, and examined (1) whether this induces a chronic, dose-related and localized knockdown of AT1R or MR in the PVN, by assessing both mRNA and protein expression of AT1R and MR in the PVN as well as SON and SFO; and (2) whether this knockdown prevents the increase in AT1R and MR expression and in BP by chronic sc infusion of Ang II.
Methods
Ethical approval
All experiments were approved by the University of Ottawa Animal Care Committee, and conform to the Guide for the Care and Use of Laboratory Animals published by the US National Institutes of Health (8th edn, 2011).
Animals
Male Wistar rats weighing 200–250 g were obtained from Charles River Breeding Laboratories (Montreal, Quebec, Canada), housed on a 12 h light/dark cycle at constant room temperature, and provided with a standard laboratory chow (120 μmol Na+ g–1) and tap water ad libitum. For all surgeries including sc placement of minipumps, rats were anaesthetized with 2% isoflurane in oxygen. Post-operative pain was managed by one sc injection of 1.0 mg kg−1 of slow release buprenorphine 30 min before surgery which provides adequate analgesia for 3 days. Only one dose of regular buprenorphine (0.5 mg kg−1) was injected pre-surgery for arterial cannulation.
Post-operatively, after chest closure in layers, isoflurane was stopped and rats remained ventilated with oxygen until they started breathing on their own. Rats were then placed in a temporary cage which was ventilated with oxygen and were provided with Transgel (ClearH2O, Portland, ME, USA) and Cheerios (General Mills, Inc., Minneapolis, MN, USA). Two to 3 h later, they were transferred to their regular cages.
Adeno-associated virus (AAV)
AAV-mediated siRNA against either MR or AT1aR, or control vector AAV-SCM-siRNA were purchased from GeneDetect (Bradenton, FL, USA). The siRNA sequence for MR is 5′-CCAACAAGGAAGCCTGAGC-3′ (position in gene sequence: nucleotides 842–860) (Wang et al. 2006), and for AT1aR is 5′-AAAGGCCAAGTCCCACTCAAG-3′ (position in gene sequence: nucleotides 966–987) (Vázquez et al. 2005). All three viral vectors contained enhanced green fluorescent protein (eGFP). AAV-SCM-siRNA, AAV-MR-siRNA and AAV-AT1aR-siRNA were used for intra-PVN infusion of 2.5 and 5.0 × 10⁷ (MR-siRNA) and 2.5, 5.0 and 25 × 107 (AT1aR-siRNA) genomic particles in 1 μl. The viral vectors were diluted with sterilized artificial cerebrospinal fluid, and for all studies infused at a rate of 0.1 μl min−1 for 10 min. These concentrations were extrapolated from studies by Keen-Rhinehart et al (2005) and de Backer et al (2010). Jöhren & Saavedra (1996) and Lenkei et al. (1998) showed high AT1aR mRNA expression but no AT1bR mRNA expression in the PVN of rats, and AAV-siRNA against AT1aR was used in the present study.
Protocol I: gene knockdown by intra-PVN infusion of AAV
Rats were anaesthetized and mounted on a stereotaxic frame and two small holes with a diameter of 1 mm were drilled through the top of the skull about 2 mm posterior and 0.5 mm lateral to bregma. Because the micro-punches are very small, separate groups of rats were used for total RNA and protein extraction. A pair of 29 G stainless steel cannulae was then inserted through the holes bilaterally into the PVN 1.8 mm posterior, 0.4 mm lateral and 7.9 mm ventral to bregma. The cannulae were connected to two 10 μl Hamilton micro-syringes via a pair of PE10 tubings, which were mounted on an infusion pump (model 2400-003, Harvard Apparatus, Holliston, MA, USA) for intra-PVN infusion at a rate of 0.1 μl min−1 for 10 min of: (1) AAV-SCM-siRNA or (2) AAV-MR-siRNA at 2.5 × 10⁷ genomic particles. Infusions were begun 5 min after the cannulae were inserted. The cannulae were left in place for at least 10 min after the infusion and then withdrawn slowly to minimize diffusion up the cannula track (Keen-Rhinehart et al. 2005).
In the second experiment, AAV-SCM-siRNA and AAV-AT1aR-siRNA were infused bilaterally into the PVN. Afterwards, the cannulae were withdrawn, and a 23 G stainless steel cannula was inserted through the left side PVN infusion point with its lower tip about 0.5 mm above the PVN (7.4 mm ventral to the skull surface) as a guide cannula for subsequent infusions. The guide cannula was fixed in position by two jewelry screws and dental cement on the skull, and sealed with a stainless steel cap.
About 2 weeks following the AAV infusions in the afternoon the left femoral artery was cannulated with a PE-50/10 tubing filled with heparin (1000 U ml−1 in 0.9% NaCl). The next morning, rats were placed in a small cage and the intra-arterial catheter was connected to a pressure transducer for recordings of BP and heart rate (HR) via a personal computer equipped with AcqKnowledge software (ACQ 3.2). An ‘L’-shaped injection cannula (30 G) was then lowered into the PVN through the guide cannula (tip extended 0.5 mm past the guide cannula), and connected to a micro-syringe via a PE10 tubing for intra-PVN infusion. Basal BP and HR were recorded after a 20 min rest, followed by microinfusions of Ang II (100, 300 or 600 ng/100 nl min−1), each for 5 min at 30 min intervals.
Protocol II: gene knockdown and Ang II-induced hypertension
Ang II-induced AT1R and MR expression
In four groups of rats (n = 5–7 per group), AAV-SCM-siRNA (in two groups), AAV-AT1aR-siRNA and AAV-MR-siRNA, all at 5 × 10⁷ genomic particles, were infused bilaterally into the PVN as described in protocol I. About 10 days after the infusion, in three groups osmotic minipumps (Alzet, Cupertino, CA, USA; model 2002) filled with Ang II were implanted sc for a 2 week infusion at 500 ng kg−1 min−1. The fourth group of rats received sc infusion of saline. Sc infusion of Ang II at the rate of 500 ng kg−1 min−1 for 2 weeks increases plasma Ang II concentration 4–5-fold and mean arterial pressure (MAP) by ∼60 mmHg (Huang et al. 2010). At the end of the Ang II infusion, resting BP and HR were recorded in all four groups of rats via an intra-arterial line placed 18 h earlier as described in Protocol I.
Ang II-induced hypertension assessed by telemetry
Under anaesthesia, a telemetry probe (Data Sciences International, St Paul, MN, USA; model TA11PA-C40) was placed into the abdominal cavity and secured to the ventral abdominal wall with the catheter inserted into the abdominal aorta. The telemetry signal was obtained using an analog adapter and data acquisition system, which was set to calculate and store the mean values of resting BP and HR. Rats were housed in regular cages placed on the telemetry receivers. After 3 days, BP and HR data collection began using Scheduled Sampling Mode with duration of 1 min and interval of 1 h. After recording resting BP and HR for 3 days, AAV-SCM-siRNA (n = 6), AAV-AT1aR-siRNA at low and high concentration (2.5 (n = 4) or 25 (n = 5) × 107 genomic particles) or AAV-MR-siRNA (n = 6) at 5 × 10⁷ genomic particles was infused bilaterally into the PVN. About 7–10 days after the infusions, osmotic minipumps filled with Ang II were implanted sc for a 2 week infusion at 500 ng kg−1 min−1. This experiment was repeated with a lower dose of Ang II, 150 ng kg−1 min−1, causing an increase in MAP by 15–20 mmHg (Huang et al. 2010).
Brain tissue collection
At the end of all experiments, rats were anaesthetized via an intra-peritoneal injection of pentobarbital and perfused transcardially with diethylpyrocarbonate (DEPC; Sigma-Aldrich Canada Ltd, Oakville, ON, Canada) treated phosphate-buffered saline (PBS, pH 7.4). Whole brains were removed, frozen rapidly in −20 to −30°C pre-chilled methylbutane, and stored at −80°C. Using a cryostat, several 100 μm (for assessment of MR and AT1R expression) and 5 μm (for eGFP expression) coronal sections were made for the PVN, SFO and SON. For the PVN, about ten 100 μm sections were obtained from −0.92 to −2.12 mm (posterior to bregma) and three 5 μm sections were obtained at −0.82, −1.82 and −2.30. When robust eGFP expression was detected only in the section at −1.82 but not at −0.82 or −2.30, and no eGFP fluorescence was detected in the SON and SFO, micro-punching was performed on 100 μm sections from the same rat for assessment of MR and AT1R expression.
Verification of distribution of the intra-PVN infusion
For all 5 μm sections, eGFP fluorescence was observed under a Zeiss (Oberkochen, Germany) AX10 fluorescence microscope. Intra-PVN infusion resulting in eGFP fluorescence within the PVN only and none outside the PVN or in the SFO or SON was considered successful. The overall success rate of the PVN infusion was ∼70%, and rats with incorrect infusion sites were excluded from the study.
Real-time RT-PCR for MR and AT1R mRNA
Using the 100 μm thick coronal cryosections, the PVN, SON and SFO were micro-punched for total RNA isolation as described previously (Wang et al. 2010). DNase I-treated total RNA (500 ng) was used for cDNA synthesis by incubation with 200 U Superscript II RNase H reverse transcriptase (Invitrogen, Burlington, ON, Canada) at 42°C for 50 min. The primers, PCR conditions and external standards for MR and the housekeeping gene phosphoglycerate kinase 1 (PGK 1) were the same as previously described (Wang et al. 2010). Specific AT1R primers (forward: 5′-GCACACTGGCAATGTAATGC-3′, reverse: 5′-GTTGAACAGAACAAGTGACC-3′) were designed for PCR amplification. Real-time PCR was performed using LightCycler 480 SYBR Green I (Roche Diagnostics, QC, Canada). The PCR conditions were set as follows: an initial step at 95°C for 10 min followed by 45 cycles of denaturation at 95°C for 10 s, annealing at 62°C for 10 s and extension at 72°C for 15 s. The 345 bp PCR fragment was cloned into pCR II TA vector (Invitrogen). AT1R plasmid concentrations were quantified by absorbance at 260 nm. Serial 10-fold dilutions of plasmid were used to generate an external standard with the same PCR conditions as described above. Expression was normalized to PGK 1 levels as an endogenous reference.
Western blotting for MR and AT1R protein
Immunoblotting was performed using 35 μg of total protein from the SFO, SON and PVN for MR and AT1R. Brain punches were homogenized in ice-cold RIPA buffer containing 1% protease inhibitor cocktail (Sigma). The homogenate was spun at 4000g for 20 min at 4°C, the supernatant was collected and total protein was measured using the Micro BCA assay (Pierce, Rockford, IL, USA). Proteins were separated by SDS-PAGE (10% gel), and then transferred onto PVDF membranes (Bio-Rad, Reinach, Switzerland). After blocking for 1 h with 5% milk in Tris-buffered saline with Tween 20 (TBST), the membranes were probed with either rabbit polyclonal anti-MR (1:500, SC-11412; Santa Cruz Biotechnology, Santa Cruz, CA, USA) or anti-AT1R (1:500, SC-1173; Santa Cruz Biotechnology). Goat anti-rabbit IgG-HRP (1:20,000, Santa Cruz) was used as secondary antibody for both AT1R and MR. The signal was developed with ECL+ chemiluminescence reagents (Perkin Elmer, Shelton, CT, USA) and visualized with an Alpha Innotech imager (Alpha Innotech, San Leandro, CA, USA). Band densities were quantified using Alpha Ease software. The membranes were then stripped and re-probed with anti-β-actin (1:5000, no. A2228, Sigma-Aldrich) overnight at 4°C, and sheep anti-mouse IgG-HRP conjugate (1:10,000, GE Healthcare, Piscataway, NJ, USA). The expression of each protein was calculated as the ratio of its band density relative to the density of the β-actin band in the same sample.
Statistical analysis
Values are expressed as means ± standard error of the mean (SEM). MAP was calculated with the equation: MAP = diastolic blood pressure (DBP) +1/3 [systolic blood pressure (SBP) − DBP]. For sequential responses over time, the area under each curve was calculated with SigmaPlot. For comparisons of the expression, peak responses or areas under the curve among multiple treatments, one-way analysis of variance (ANOVA) was used. When F values were significant, Newman–Keuls test was applied as a post hoc test. For comparisons of responses versus baseline BP, one way repeated-measures ANOVA was performed. The level of significance was set at P < 0.05.
Results
Effects of gene expression knockdown on MR and AT1R expression in the PVN
Two weeks after bilateral intra-PVN infusion of AAV-MR-siRNA at 2.5 × 10⁷ genomic particles, MR mRNA and protein expression in the PVN were reduced significantly by 56 and 31%, respectively, compared with rats infused with AAV-SCM-siRNA, but were not changed in the SON (Fig.1). Bilateral intra-PVN infusion of AAV-AT1aR-siRNA at 2.5 or 5 × 10⁷ genomic particles reduced AT1R mRNA expression in the PVN in a dose-related manner, but did not change expression in the SFO or SON (Fig.1). Robust eGFP expression was detected in both neurons and glia in both magnocellular and parvocellular divisions of the PVN but not in the SFO or SON, indicating that the AAV-siRNA infused into the PVN did not leak into the cerebral ventricles. There was no eGFP expression in brain sections from rats without AAV infusion (Fig.2).
Figure 1. MR mRNA and protein expression and AT1R mRNA in the PVN, SON and SFO.

MR mRNA and protein expression (A, B) and AT1R mRNA (C) in the PVN, SON and SFO 2 weeks after intra-PVN infusion of AAV-SCM-siRNA (n = 4), AAV-AT1R-siRNA (n = 5), 2.5 or 5 × 10⁷ genomic particles or AAV-MR-siRNA (n = 5), 2.5×10⁷ genomic particles. Values are means ± SEM, normalized with PGK 1 (mRNA) or β-actin (protein). Values for MR/β-actin in the SCM-siRNA + saline group were normalized to 1. *P < 0.05 versus other(s); a, P < 0.05 versus 2.5×10⁷ genomic particles.
Figure 2. Representative images of eGFP fluorescence in the PVN.

eGFP expression was evaluated in brain sections of a rat infused in the PVN with AAV-AT1aR-siRNA at 25 × 107 genomic particles. Red arrows indicate eGFP fluorescence in the PVN, and the white arrows point to the SFO or SON. The higher magnification image shows eGFP expression in both neurons and glia in the PVN. Control image was obtained from a rat without any AAV infusion.
Two weeks after intra-PVN infusion, there were no significant differences in basal MAP and HR among rats with AAV-SCM-siRNA, and AAV-AT1aR-siRNA at 2.5 and 5 × 10⁷ genomic particles (MAP: 116 ± 2, 110 ± 2 and 116 ± 3 mmHg; HR: 384 ± 11, 395 ± 12 and 375 ± 10 b.p.m.). Increases in MAP and HR by intra-PVN infusion of Ang II were inhibited by treatment with AAV-AT1aR-siRNA in a dose-related manner (Fig.3).
Figure 3. MAP and HR after intra-PVN infusion of Ang II.

Maximal increases in MAP and HR after intra-PVN infusion of Ang II at 100, 300 or 600 ng min−1 for 5 min at 2 weeks after intra-PVN infusion of AAV-SCM-siRNA or AAV-AT1R-siRNA at 2.5 or 5 × 10⁷ genomic particles. Values are means ± SEM (n = 4 per group). *P < 0.05 versus resting values; a, P < 0.05 versus others.
Effects of gene knockdown on Ang II-induced gene expression and hypertension
MR and AT1R expression in the PVN, SON and SFO
Subcutaneous infusion of Ang II at 500 ng kg−1 min−1 for 2 weeks significantly increased MR and AT1R protein expression in all three nuclei in rats treated with AAV-SCM-siRNA. Intra-PVN infusion of either AAV-MR-siRNA or AAV-AT1aR-siRNA had no effect on the Ang II-induced increases in MR or AT1R protein expression in the SFO and SON (Table1). In rats treated with AAV-AT1aR-siRNA, after sc Ang II infusion MR protein was similarly increased in the PVN as in other nuclei, whereas AT1R protein was markedly decreased only in the PVN (Table1, Fig.4). In rats treated with AAV-MR-siRNA, after sc Ang II infusion AT1R protein was similarly increased in the PVN as in other nuclei, whereas MR protein was markedly decreased only in the PVN (Table1, Fig.4). MR mRNA and AT1R mRNA followed a similar pattern and decreased in the PVN, but not in the SFO or SON (Fig.5).
Table 1.
Resting MAP and HR, and MR and AT1R protein expression in the PVN, SON and SFO in rats with intra-PVN infusion of AAV-SCM-siRNA, AAV-AT1R-siRNA or AAV-MR-siRNA (5 × 10⁷ genomic particles for all), and subsequent sc infusion of Ang II (500 ng kg−1 min−1) or saline for 2 weeks
| AAV-SCM-siRNA | AAV-SCM-siRNA | AAV-AT1R-siRNA | AAV-MR-siRNA | |
|---|---|---|---|---|
| (n = 5) | (n = 5) | (n = 7) | (n = 7) | |
| Saline | Ang II | Ang II | Ang II | |
| MAP (mmHg) | 113 ± 2 | 192 ± 7* | 158 ± 8*,a,b | 121 ± 6a |
| HR (b.p.m.) | 377 ± 8 | 416 ± 15 | 411 ± 12 | 377 ± 12 |
| Protein expression (normalized with β-actin) | ||||
| MR | ||||
| PVN | 1.00 ± 0.08 | 1.41 ± 0.15* | 1.34 ± 0.07* | 0.79 ± 0.02c |
| SON | 1.00 ± 0.17 | 1.48 ± 0.17* | 1.43 ± 0.15* | 1.39 ± 0.13* |
| SFO | 1.00 ± 0.09 | 1.58 ± 0.16* | 1.43 ± 0.07* | 1.64 ± 0.17* |
| AT1R | ||||
| PVN | 1.00 ± 0.05 | 1.43 ± 0.19* | 0.57 ± 0.15 c | 1.47 ± 0.10* |
| SON | 1.00 ± 0.06 | 1.59 ± 0.8* | 1.53 ± 0.08* | 1.57 ± 0.06* |
| SFO | 1.00 ± 0.09 | 1.59 ± 0.13* | 1.40 ± 0.09* | 1.64 ± 0.16* |
Data are means ± SEM (n = 5–7 per group). Values for MR or AT1R/β-actin in the SCM-siRNA + saline group were normalized to 1. *P < 0.05 versus AAV-SCM-siRNA + saline; a, P < 0.05 versus AAV-SCM-siRNA+Ang II; b, P < 0.05 versus AAV-MR-siRNA+Ang II; c, P < 0.05 versus MR or AT1R expression in others. For MAP, F = 29.4, P = 0.0001; for HR, F = 2.55, P = 0.06; for PVN, MR: F = 24.3, P = 0.0001; AT1R: F = 90.3, P = 0.0001; for SON, MR: F = 5.55, P = 0.006; AT1R: F = 15.9, P = 0.0001; for SFO, MR: F = 4.67, P = 0.01; AT1R: F = 5.42, P = 0.007.
Figure 4. AT1R and MR protein expression in the PVN.
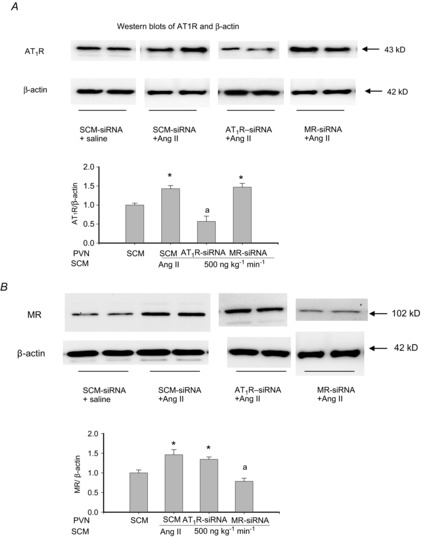
AT1R and MR protein expression in the PVN after intra-PVN infusion of AAV-SCM-siRNA, AAV-AT1R-siRNA or AAV-MR-siRNA at 5 × 10⁷ genomic particles, and sc infusion of Ang II at 500 ng kg−1 min−1 or saline for 2 weeks. Values are means ± SEM, normalized with β-actin (n = 5 per group). Values for AT1R or MR/β-actin in the SCM-siRNA + saline group were normalized to 1. *P < 0.05 versus others; a, P < 0.05 versus SCM-siRNA.
Figure 5. AT1R and MR mRNA expression in the PVN, SFO and SON.

AT1R and MR mRNA expression in the PVN, SFO and SON after intra-PVN infusion of AAV-SCM-siRNA at 5 × 10⁷ genomic particles, AAV-AT1R-siRNA at 2.5 (low) or 25 (high) × 107 genomic particles or AAV-MR-siRNA at 5 × 10⁷ genomic particles, followed by sc infusion of Ang II at 500 ng kg−1 min−1 for 2 weeks. Values are means ± SEM, normalized with PGK (n = 4–5 per group). *P < 0.05 versus others.
Ang II-induced hypertension assessed by intra-arterial line
In rats with AAV-SCM-siRNA, sc infusion of Ang II at 500 ng kg−1 min−1 for 2 weeks significantly increased MAP by ∼80 mmHg. The hypertension was prevented in rats with AAV-MR-siRNA, and attenuated significantly by 40% in rats with AAV-AT1aR-siRNA at 5 × 10⁷ genomic particles (Table1). There were no significant differences in resting HR among the four groups of rats (data not shown). Similar to our previous study (Huang et al. 2013b), the Ang II infusion did not increase water intake (48 ± 5 vs. 52 ± 5 ml day−1 on day 11 of infusion).
Ang II-induced hypertension assessed by telemetry
In all four groups of rats, intra-PVN infusion of AAV did not change baseline BP or HR (data not shown). In rats with AAV-SCM-siRNA, sc infusion of Ang II at 500 ng kg−1 min−1 markedly increased MAP, reaching maximal levels of +75 mmHg on day 10. In rats with AAV-AT1aR-siRNA at just 2.5 × 10⁷ genomic particles, increases in MAP after sc Ang II were similar to those in rats with AAV-SCM-siRNA, both in the profile and in maximal increases. In contrast, in rats with AAV-AT1R-siRNA at the higher dose of 25 × 107 genomic particles, Ang II increased MAP by only 9–11 mmHg (P < 0.05 versus baseline). After AAV-MR-siRNA at 5 × 10⁷ genomic particles, sc Ang II increased MAP by only 5–8 mmHg (n.s. versus baseline) (Fig.6). In rats infused with AAV-SCM-siRNA in the PVN, sc infusion of Ang II at 150 ng kg−1 min−1 caused a gradual, modest increase in MAP, reaching maximal increases by ∼20 mmHg. After AAV-MR-siRNA in the PVN, this dose of Ang II did not increase BP (Fig.6).
Figure 6. Responses of MAP to sc infusion of Ang II.

Responses of MAP to sc infusion of Ang II at 150 or 500 ng kg−1 min−1 for 2 weeks after intra-PVN infusion of AAV-SCM-siRNA, AAV-AT1R-siRNA at 2.5 (low) or 25 (high) × 107 genomic particles, or AAV-MR-siRNA at 5 × 10⁷ genomic particles. Values are means ± SEM (n = 4–6). *P < 0.05 versus AAV-AT1R-siRNA at 25 × 107 or AAV-MR-siRNA; a, P < 0.05 versus baseline.
In all groups of rats, HR did not change significantly after sc Ang II at either dose (data not shown).
Discussion
The present study provides new findings that in Wistar rats on regular salt intake: (1) a 2 week sc infusion of Ang II increases both AT1R and MR protein expression in the SFO, SON and PVN; (2) intra-PVN infusion of AAV-AT1aR-siRNA prevents the increase in AT1R but neither the increase in MR expression in the PVN nor the AT1R and MR increases in SFO and SON induced by sc Ang II. Similarly, the AAV-MR-siRNA knocks down MR expression only in the PVN, and (3) either AT1R or MR knockdown in the PVN prevents most of the progressive increase in BP caused by chronic sc infusion of Ang II. These findings suggest that PVN activation is downstream of Ang II-induced activation of the SFO or SON, and that MR and AT1R expression appear to be regulated independently. These findings also indicate that both increased MR and AT1R activation in the PVN play a critical role in the development of Ang II-induced hypertension in rats on regular salt intake.
Subcutaneous infusion of Ang II at 500 ng kg−1 min−1 for 2 weeks increased AT1R protein expression 40–60% in the SFO, SON and PVN. These results are consistent with studies by others (Wei et al. 2009; Sriramula et al. 2011; Yu et al. 2013) showing upregulation of AT1R mRNA and protein expression by ∼50% in the SFO and PVN. Subcutaneous infusion of Ang II for 2 weeks also increased MR protein expression by 50% in the SFO, SON and PVN. Xue et al. (2012) reported that sc infusion of Ang II increased MR mRNA expression by 30% in the PVN. Effects of sc Ang II on AT1R expression in the SON and on MR expression in the SFO and SON appear not to have been reported previously. Whereas in normal rats AT1Rs are predominantly expressed in parvocellular regions of the PVN (Lenkei et al. 1998; Oldfield et al. 2001), sc infusion of Ang II (Wei et al. 2009) or icv infusion of aldosterone (Zhang et al. 2008; Huang et al. 2011) increases AT1R expression in both magnocellular and parvocellular regions of the PVN. Given that PVN activation by sc Ang II infusion appears to depend on aldosterone-MR (Huang et al. 2010; Gabor & Leenen, 2012, 2013), one might expect that increased MR expression and activation may contribute to the increase in AT1R expression in the PVN. Specific knockdown of MR or AT1R in the PVN can provide insights into such interactions. We used AAV delivery of siRNA for selective knockdown of AT1aR or MR in the PVN. AT1aR and AT1bR subtypes share 95% homology in mRNA and amino acid sequences and have similar Ang II binding characteristics (Chiu et al. 1993). In rats, there is a high AT1aR but no AT1bR mRNA expression in the PVN (Jöhren & Saavedra 1996; Lenkei et al. 1998). Bilateral intra-PVN infusion of specific AAV-siRNA selectively decreased AT1aR or MR expression in the PVN but not in the SFO or SON. The location of AAV delivery in the PVN was further confirmed by eGFP expression, which was detected in the PVN but not in the SFO or SON. For both MR and AT1R, mRNA and protein data were consistent, indicating that the decrease in protein is indeed secondary to knockdown of its mRNA. Previously, Xue et al. (2011) showed that icv injection of
AAV-AT1aR- or AAV-MR-siRNA significantly decreased AT1aR or MR expression in the PVN and attenuated aldosterone-salt-induced hypertension in rats. Effects of icv infused AAV on receptor expression in other nuclei such as the SON and SFO were not reported.
Subcutaneous Ang II increased AT1R and MR expression in the SFO, PVN and SON. In the PVN, Ang II appears to upregulate AT1R by activating intracellular p44/42 mitogen-activated protein kinase (MAPK) and c-Jun N-terminal kinase (JNK) signalling pathways (Wei et al. 2009; Yu et al. 2013). Central aldosterone also upregulates AT1R mRNA and protein in the PVN (Zhang et al. 2008; Huang et al. 2011). In vascular smooth cells, some of the signalling pathways activated by AT1R are dependent on MR and vice versa (Jaffe & Mendelsohn, 2005; Rautureaua et al. 2011). However, in the PVN, MR activation does not seem to be involved in the AT1R upregulation by circulating Ang II as knockdown of MR by siRNA in the PVN does not affect the increase in AT1R expression. The mechanisms of central MR upregulation by circulating Ang II have not yet been studied. In the PVN, knockdown of AT1R did not affect the Ang II-induced MR upregulation, suggesting an AT1R-independent regulatory mechanism. Aldosterone itself may play an important intermediary role in this regard. Aldosterone binds to the ligand-binding domain of MR and induces a specific transcriptionally active conformational change (Hella-Levy et al. 2000). This conformational change may recruit co-regulators to form a transcriptional factor complex (Meijer, 2002) to facilitate mRNA expression also for MR. Altogether, it appears that there is no cross-talk between MR and AT1R contributing to the upregulation of MR or AT1R by circulating Ang II, at least in the PVN.
Subcutaneous Ang II also increases MR expression in the SFO and SON, and intra-PVN infusion of AAV-MR-siRNA knocks down MR in the PVN without affecting up-regulation of MR in the SFO and SON. Further studies are needed to clarify a possible role for MR up-regulation in the SFO and SON in the activation of central pathways by circulating Ang II.
Knockdown of AT1R or MR gene expression in the PVN did not change resting BP, consistent with the concept that AT1R and MR in the PVN do not play a tonic role in maintaining resting sympathetic tone and BP in normotensive rats. Infusion of AAV-AT1R siRNA in the PVN inhibited pressor responses to acute intra-PVN infusion of Ang II and sc Ang II-induced hypertension in a dose-related manner, but the dose–response relationships were quite different. AAV-AT1R-siRNA at 2.5 × 10⁷ genomic particles blocked the pressor response to intra-PVN infusion of 300 ng Ang II but had no effects on sc Ang II-induced hypertension. AAV-AT1R-siRNA at 5 × 10⁷ genomic particles blocked the pressor response to intra-PVN infusion of 600 ng Ang II and inhibited sc Ang II-induced hypertension by ∼40%. AAV-AT1R siRNA at 25 × 107 genomic particles largely prevented sc Ang II-induced hypertension. These findings indicate that compared with the AT1R mRNA knockdown needed to inhibit pressor responses to acute increases in exogenous Ang II in the PVN, more marked knockdown is required to inhibit sc Ang II-induced AT1R activation in the PVN. Chronic sc Ang II upregulates AT1R expression and intracellular signalling in the PVN, and as a result more AAV-AT1R siRNA and greater knockdown of AT1R appear to be needed to prevent the sc Ang II-induced hypertension.
Knockdown of AT1R or of MR mRNA and protein expression in the PVN by 50–60% (Figs 4 and 5) similarly abolishes most of the Ang II-induced hypertension (Fig.6), indicating that both MR and AT1R activation in the PVN are essential. Although MR and AT1R expression in the PVN appear to be regulated independently by sc Ang II, MR and AT1R activation in the PVN are probably involved in the same pathway. Functional studies show that central blockade of either MR or AT1R similarly prevents Ang II-induced hypertension (Zimmerman et al. 2004; Huang et al. 2010), and sc or icv aldosterone-induced hypertension both also depend on central MR and AT1R activation, particularly in the PVN (Hwang et al. 2006; Xue et al. 2011). Intra-cerebroventricular infusion of an MR blocker normalizes BP responses to AT1R blockade in the PVN in rats with sc Ang II-induced hypertension (Gabor & Leenen, 2012). Taken together, these findings suggest that an increase in circulating Ang II activates efferents from the SFO and OVLT to the PVN which increases AT1R and MR expression and signalling in the PVN. It appears that this MR activation does not regulate AT1R activation by increasing AT1R expression per se, but rather by enhancing intracellular signalling, i.e. upregulating NADPH oxidase subunits and ROS (Huang et al. 2011). The present study does not address the source of the AT1R and MR agonists, presumably Ang II and aldosterone. Ang II may be released from angiotensinergic efferents from SFO/OVLT neurons, or possibly produced locally in the PVN (Li et al. 2014). In addition, once severe hypertension develops, the blood–brain barrier permeability may increase and circulating Ang II then accesses PVN neurons (Biancardi et al 2014). Regarding aldosterone, Ang II may increase local production in the CNS (Huang et al. 2010, 2013b; Xue et al. 2012), but an increase in plasma aldosterone by higher rates of sc infusion of Ang II (Huang et al. 2010) may also exert CNS effects (Xue et al. 2011), possibly through MR in the SFO (Huang et al. 2013a).
Subcutaneous infusion of Ang II at 500 ng kg−1 min−1 causes a 4-fold increase in plasma concentration of Ang II (Huang et al. 2010), and presumably exerts renal and vascular effects contributing to the increase in BP. Without the central component these peripheral effects appear to cause only a modest increase in BP (Huang et al. 2010; Fig.6). However, in rats with icv infusion of Ang II (Huang et al. 2013b), the central component alone causes a rapid increase in BP without the progressive increase in BP as caused by sc infusion of Ang II (Huang et al. 2010). These findings suggest that the peripheral actions exert an important amplifier effect for the central actions of Ang II, and both together are responsible for the progressive increase in BP. Previous studies concluded that these peripheral actions would cause the initial increase in BP by sc Ang II, and an increase in sympathetic activity contributes to the pressor response only after a delay of several days following onset of sc Ang II infusion (Fink, 1997). However, several recent studies in rats (current study, Huang et al. 2010; Xue et al. 2011) or mice (Zimmerman et al. 2004; Cao et al. 2012) clearly demonstrate that central blockades of, for example, MR, AT1R or superoxide production prevents (most of) the pressor response within 2–3 days following the start of sc Ang II, suggesting that central mechanisms contribute to the pressor response even in the early phase of sc Ang II-induced hypertension, e.g. by causing increased AVP release (Veltmar et al. 1984).
Limitation of the study
The present study did not assess the cellular or the subdivision localization of the MR and AT1R in the PVN. MR appear to be more expressed in the magnocellular than in the parvocellular neurons of the PVN (Amin et al. 2005), but in which cell types MRs are increased by sc Ang II has not been studied. AT1Rs are predominantly expressed in parvocellular regions of the PVN in normal rats (Lenkei et al. 1998; Oldfield et al. 2001) but sc Ang II increases the expression in both magnocellular and parvocellular regions of the PVN (Wei et al. 2009). AT1R and MR are also expressed in brain astrocytes (Hwang et al. 2006; Füchtbauer et al. 2011), and the functional effects of aldosterone or Ang II on neurons may involve the activation of such non-neuronal AT1R and MR. Further studies are needed to determine the role of MR and AT1R in neurons or glia, and if in neurons, whether in magnocellular or parvocellular neurons in the PVN.
Conclusions
Whereas an increase in circulating Ang II increases MR and AT1R expression in the SFO, SON and PVN, activation of AT1R and MR specifically in the PVN appear to be essential and key events for sc Ang II-induced hypertension. Functionally, MR activation appears essential for AT1R activation in the PVN (Gabor & Leenen, 2013). However, prevention of the Ang II-induced increases in MR but not AT1R expression by knockdown of MR, and vice versa, suggests that there is an independent regulation of MR and AT1R expression in the PVN. Further studies are required to clarify the role of MR and AT1R in the SON and SFO, and more specifically their role in MR and AT1R expression and activation in the PVN, in Ang II-induced hypertension in rats.
Acknowledgments
F.H.H.L. holds the Pfizer Chair in Hypertension Research, an endowed chair supported by Pfizer Canada, University of Ottawa Heart Institute Foundation, and Canadian Institutes of Health Research. The authors would like to acknowledge Danielle Oja for her excellent skills in assisting in the preparation and formatting of this paper
Glossary
- AAV
adeno-associated virus
- AAV-siRNA
adeno-associated virus carrying small interfering RNA
- Ang II
angiotensin II
- AS
aldosterone synthase
- AT1R
angiotensin II type 1 receptor
- BP
blood pressure
- DBP
diastolic blood pressure
- DEPC
diethylpyrocarbonate
- eGFP
enhanced green fluorescent protein
- EO
endogenous ouabain
- icv
intra-cerebroventricular
- IML
intermediolateral nucleus
- MAP
mean arterial pressure
- MR
mineralocorticoid receptor
- OVLT
organum vasculosum of the lamina terminalis
- PBS
phosphate-buffered saline
- PGK 1
phosphoglycerate kinase 1
- PVN
paraventricular nucleus
- RAAS
renin–angiotensin–aldosterone system
- ROS
reactive oxygen species
- RVLM
rostral ventrolateral medulla
- SBP
systolic blood pressure
- SCM
scrambled
- SFO
subfornical organ
- SON
supraoptic nucleus
- sc
subcutaneous
Key points
Chronic subcutaneous infusion of Ang II causes a progressive increase in blood pressure (BP) associated with significant increases in angiotensin type 1 receptor (AT1R) and mineralocorticoid receptor (MR) expression in hypothalamic nuclei.
Intra-paraventricular nucleus (PVN) infusion of AAV- AT1aR-siRNA or of AAV-MR-siRNA markedly knockdown AT1a-R or MR expression in the PVN but not in the subfornical organ; or supraoptic nucleus, and prevent most of the increase in BP.
These findings indicate that increased MR and AT1R activation in the PVN play a critical role in Ang II-induced hypertension in rats on regular salt intake.
Additional Information
Competing interests
None.
Author contributions
All experiments were carried out at the Hypertension Unit, University of Ottawa Heart Institute, Ottawa, Ontario, Canada. F.H.H.L. designed experiments, interpreted the data and revised drafts of the manuscript. A.C. and B.S.H. performed some of the experiments, analysed and interpreted the data, wrote parts of the first draft of the manuscript, and revised further drafts of the manuscript. H.W.W. designed and developed experiments in molecular biology, analysed and interpreted the data, wrote parts of the first draft of the manuscript and revised further drafts. M.A. designed and performed some of the experiments, calculated data and critically revised drafts of the manuscript.
Funding
This study was supported by operating grants FRN:MOP-74432 and FRN:MOP-13182 from the Canadian Institutes of Health Research.
References
- Amin MS, Wang HW, Reza E, Whitman SC, Tuana BS. Leenen FHH. Distribution of epithelial sodium channels and mineralocorticoid receptors in cardiovascular regulatory centers in rat brain. Am J Physiol Heart Circ Physiol. 2005;289:R1787–H1797. doi: 10.1152/ajpregu.00063.2005. [DOI] [PubMed] [Google Scholar]
- Bains JS, Potyok A. Ferguson AV. Angiotensin II actions in paraventricular nucleus: functional evidence for neurotransmitter role in efferents originating in subfornical organ. Brain Res. 1992;599:223–229. doi: 10.1016/0006-8993(92)90395-p. [DOI] [PubMed] [Google Scholar]
- Biancardi VC, Son SJ, Ahmadi S, Filosa JA. Stern JE. Circulating angiotensin II gains access to the hypothalamus and brain stem during hypertension via breakdown of the blood–brain barrier. Hypertension. 2014;63:572–579. doi: 10.1161/HYPERTENSIONAHA.113.01743. [DOI] [PMC free article] [PubMed] [Google Scholar]
- Cao X, Peterson JR, Wang G, Anrather J, Young CN, Guruju MR, Burmeister MA, Iadecola C. Davisson RL. Angiotensin II-dependent hypertension requires cyclooxygenase 1-derived prostaglandin E2 and EP1 receptor signalling in the subfornical organ of the brain. Hypertension. 2012;59:869–876. doi: 10.1161/HYPERTENSIONAHA.111.182071. [DOI] [PMC free article] [PubMed] [Google Scholar]
- Chiu AT, Dunscomb J, Kosierowski J, Burton CR, Santomenna LD, Corjay MH. Benfield P. The ligand binding signatures of the rat AT1a, AT1b and the human AT1 receptors are essentially identical. Biochem Biophys Res Commun. 1993;197:440–449. doi: 10.1006/bbrc.1993.2499. [DOI] [PubMed] [Google Scholar]
- Collister JP. Hendel MD. Chronic effects of angiotensin II and AT1 receptor antagonists in subfornical organ-lesioned rats. Clin Exp Pharmacol Physiol. 2005;32:462–466. doi: 10.1111/j.1440-1681.2005.04212.x. [DOI] [PubMed] [Google Scholar]
- Davern PJ. Head GA. Fos-related antigen immunoreactivity after acute and chronic angiotensin II-induced hypertension in the rabbit brain. Hypertension. 2007;49:1170–1177. doi: 10.1161/HYPERTENSIONAHA.106.086322. [DOI] [PubMed] [Google Scholar]
- de Backer MWA, Brans MAD, Luijendijk MC, Garner KM. Adan RAH. Optimization of adeno-associated viral vector-mediated gene delivery to the hypothalamus. Hum Gene Ther. 2010;21:673–682. doi: 10.1089/hum.2009.169. [DOI] [PubMed] [Google Scholar]
- Ferguson AV. Angiotensinergic regulation of autonomic and neuroendocrine outputs: critical roles for the subfornical organ and paraventricular nucleus. Neuroendocrinology. 2009;89:370–376. doi: 10.1159/000211202. [DOI] [PubMed] [Google Scholar]
- Fink GD. Long-term sympatho-excitatory effect of angiotensin II: a mechanism of spontaneous and renovascular hypertension. Clin Exp Pharmacol Physiol. 1997;24:91–95. doi: 10.1111/j.1440-1681.1997.tb01789.x. [DOI] [PubMed] [Google Scholar]
- Füchtbauer L, Groth-Rasmussen M, Holm TH, Løbner M, Toft-Hansen H, Khorooshi R. Owens T. Angiotensin II Type 1 receptor (AT1) signalling in astrocytes regulates synaptic degeneration-induced leukocyte entry to the central nervous system. Brain Behav Immun. 2011;25:897–904. doi: 10.1016/j.bbi.2010.09.015. [DOI] [PubMed] [Google Scholar]
- Gabor A. Leenen FHH. Central neuromodulatory pathways regulating sympathetic activity in hypertension. J Appl Physiol. 2012;113:1294–1303. doi: 10.1152/japplphysiol.00553.2012. [DOI] [PMC free article] [PubMed] [Google Scholar]
- Gabor A. Leenen FHH. Central mineralocorticoid receptors and the role of angiotensin II and glutamate in the paraventricular nucleus of rats with angiotensin II-induced hypertension. Hypertension. 2013;61:1083–1090. doi: 10.1161/HYPERTENSIONAHA.111.00797. [DOI] [PubMed] [Google Scholar]
- Hellal-Levy C, Fagart J, Souque A, Rafestin-Oblin ME. Mechanistic aspects of mineralocorticoid receptor activation. Kidney Int. 2000;57:1250–1255. doi: 10.1046/j.1523-1755.2000.00958.x. [DOI] [PubMed] [Google Scholar]
- Huang BS, Ahmadi S, Ahmad M, White RA. Leenen FH. Central neuronal activation and pressor responses induced by circulating ANG II: role of the brain aldosterone–‘ouabain’ pathway. Am J Physiol Heart Circ Physiol. 2010;299:H422–H430. doi: 10.1152/ajpheart.00256.2010. [DOI] [PubMed] [Google Scholar]
- Huang BS, Ahmad M, Chen A, White RA. Leenen FHH. Aldosterone-salt hypertension depends on the SFO, central aldosterone synthase and MR specifically in the PVN. Hypertension. 2013a;62:A441. (abstract) [Google Scholar]
- Huang BS, White RA, Ahmad M. Leenen FHH. Role of brain corticosterone and aldosterone in central angiotensin II- induced hypertension. Hypertension. 2013b;62:564–571. doi: 10.1161/HYPERTENSIONAHA.113.01557. [DOI] [PubMed] [Google Scholar]
- Huang BS, Zheng H, Tan J, Patel KP. Leenen FH. Regulation of hypothalamic renin–angiotensin system and oxidative stress by aldosterone. Exp Physiol. 2011;96:1028–1038. doi: 10.1113/expphysiol.2011.059840. [DOI] [PMC free article] [PubMed] [Google Scholar]
- Hwang IK, Yoo KY, Nam YS, Choi JH, Lee IS, Kwon YG, Kang TC, Kim YS. Won MH. Mineralocorticoid and glucocorticoid receptor expressions in astrocytes and microglia in the gerbil hippocampal CA1 region after ischemic insult. Neurosci Res. 2006;54:319–327. doi: 10.1016/j.neures.2005.12.012. [DOI] [PubMed] [Google Scholar]
- Jaffe IZ. Mendelsohn ME. Angiotensin II and aldosterone regulate gene transcription via functional mineralocortocoid receptors in human coronary artery smooth muscle cells. Circ Res. 2005;96:643–650. doi: 10.1161/01.RES.0000159937.05502.d1. [DOI] [PubMed] [Google Scholar]
- Jöhren O. Saavedra JM. Expression of AT1A and AT1B angiotensin II receptor messenger RNA in forebrain of 2-wk-old rats. Am J Physiol Endocrinol Metab. 1996;271:E104–E112. doi: 10.1152/ajpendo.1996.271.1.E104. [DOI] [PubMed] [Google Scholar]
- Keen-Rhinehart E, Kalra SP. Kalra PS. AAV-mediated leptin receptor installation improves energy balance and the reproductive status of obese female Koletsky rats. Peptides. 2005;26:2567–2578. doi: 10.1016/j.peptides.2005.05.027. [DOI] [PubMed] [Google Scholar]
- King AJ. Fink GD. Chronic low-dose angiotensin II infusion increases venomotor tone by neurogenic mechanisms. Hypertension. 2006;48:927–933. doi: 10.1161/01.HYP.0000243799.84573.f8. [DOI] [PubMed] [Google Scholar]
- Ku YH, Jia YF. Chang YZ. Mechanisms underlying pressor response of subfornical organ to angiotensin II. Peptides. 1999;20:171–176. doi: 10.1016/s0196-9781(98)00161-2. [DOI] [PubMed] [Google Scholar]
- Lenkei Z, Palkovits M, Corvol P, Llorens-Cortes C. Distribution of angiotensin type-1 receptor messenger RNA expression in the adult rat brain. Neuroscience. 1998;82:827–841. doi: 10.1016/s0306-4522(97)00328-x. [DOI] [PubMed] [Google Scholar]
- Li W, Peng H, Mehaffey EP, Kimball CD, Grobe JL, van Gool JM, Sullivan MN, Earley S, Danser AH, Ichihara A. Feng Y. Neuron-specific (pro)renin receptor knockout prevents the development of salt-sensitive hypertension. Hypertension. 2014;63:316–323. doi: 10.1161/HYPERTENSIONAHA.113.02041. [DOI] [PMC free article] [PubMed] [Google Scholar]
- Li Q, Dale WE, Hasser EM. Blaine EH. Acute and chronic angiotensin hypertension: neural and nonneural components, time course, and dose dependency. Am J Physiol. 1996;271:R200–R207. doi: 10.1152/ajpregu.1996.271.1.R200. [DOI] [PubMed] [Google Scholar]
- Lob HE, Schultz D, Marvar PJ, Davisson RL. Harrison DG. Role of the NADPH oxidases in the subfornical organ in angiotensin II-induced hypertension. Hypertension. 2013;61:382–387. doi: 10.1161/HYPERTENSIONAHA.111.00546. [DOI] [PMC free article] [PubMed] [Google Scholar]
- Meijer OC. Coregulator proteins and corticosteroid action in the brain. J Neuroendocrinol. 2002;14:499–505. doi: 10.1046/j.1365-2826.2002.00795.x. [DOI] [PubMed] [Google Scholar]
- Oldfield BJ, Davern PJ, Giles ME, Allen AM, Badoer E. McKinley MJ. Efferent neural projections of angiotensin receptor (AT1) expressing neurones in the hypothalamic paraventricular nucleus of the rat. J Neuroendocrinol. 2001;13:139–146. doi: 10.1046/j.1365-2826.2001.00597.x. [DOI] [PubMed] [Google Scholar]
- Rautureaua Y, Paradisa P. Schiffrin EL. Cross-talk between aldosterone and angiotensin signalling in vascular smooth muscle cells. Steroids. 2011;76:834–839. doi: 10.1016/j.steroids.2011.02.015. [DOI] [PubMed] [Google Scholar]
- Sriramula S, Cardinale JP, Lazartigues E. Francis J. ACE2 overexpression in the paraventricular nucleus attenuates angiotensin II-induced hypertension. Cardiovasc Res. 2011;92:401–408. doi: 10.1093/cvr/cvr242. [DOI] [PMC free article] [PubMed] [Google Scholar]
- Vázquez J, Adjounian MFC, Sumners C, González A, Diez-Freire C. Raizada MK. Selective silencing of angiotensin receptor subtype 1a (AT1aR) by RNA interference. Hypertension. 2005;45:115–119. doi: 10.1161/01.HYP.0000150161.78556.c6. [DOI] [PubMed] [Google Scholar]
- Veltmar A, Culman J, Qadri F, Rascher W. Unger T. Involvement of adrenergic and angiotensinergic receptors in the paraventricular nucleus in the angiotensin II-induced vasopressin release. J Pharmacol Exp Ther. 1984;263:1253–1260. [PubMed] [Google Scholar]
- Vieira AA, Nahey DB. Collister JP. Role of the organum vasculosum of the lamina terminalis for the chronic cardiovascular effects produced by endogenous and exogenous ANG II in conscious rats. Am J Physiol Regul Integ Comp Physiol. 2010;299:R1564–R1571. doi: 10.1152/ajpregu.00034.2010. [DOI] [PubMed] [Google Scholar]
- Wang HW, Amin MS, El-Shahat E, Huang BS, Tuana BS. Leenen FHH. Effects of central sodium on epithelial sodium channels in rat brain. Am J Physiol Regul Integ Comp Physiol. 2010;299:R222–R233. doi: 10.1152/ajpregu.00834.2009. [DOI] [PubMed] [Google Scholar]
- Wang X, Skelley L, Cade R. Sun Z. AAV delivery of mineralocorticoid receptor shRNA prevents progression of cold-induced hypertension and attenuates renal damage. Gene Ther. 2006;13:1097–1103. doi: 10.1038/sj.gt.3302768. [DOI] [PubMed] [Google Scholar]
- Wei SG, Yu Y, Zhang ZH. Felder RB. Angiotensin II upregulates hypothalamic AT1 receptor expression in rats via the mitogen-activated protein kinase pathway. Am J Physiol Heart Circ Physiol. 2009;296:H1425–H1433. doi: 10.1152/ajpheart.00942.2008. [DOI] [PMC free article] [PubMed] [Google Scholar]
- Wright JW, Roberts KA, Stubley LA, Hanesworth JM. Harding JW. Hypothalamic angiotensin release in response to AII or glutamic acid stimulation of the SFO in rats. Brain Res Bull. 1993;31:649–654. doi: 10.1016/0361-9230(93)90136-y. [DOI] [PubMed] [Google Scholar]
- Xue B, Beltz TG, Johnson RF, Guo F, Hay M. Johnson AK. PVN adenovirus-siRNA injections silencing either NOX2 or NOX4 attenuate aldosterone/NaCl-induced hypertension in mice. Am J Physiol Heart Circ Physiol. 2012a;302:H733–H741. doi: 10.1152/ajpheart.00873.2011. [DOI] [PMC free article] [PubMed] [Google Scholar]
- Xue B, Beltz TG, Yu Y, Guo F, Gomez-Sanchez CE, Hay M. Johnson AK. Central interactions of aldosterone and angiotensin II in aldosterone- and angiotensin II-induced hypertension. Am J Physiol Heart Circ Physiol. 2011;300:H555–H564. doi: 10.1152/ajpheart.00847.2010. [DOI] [PMC free article] [PubMed] [Google Scholar]
- Xue B, Zhang Z, Roncari CF, Guo F. Johnson AK. Aldosterone acting through the central nervous system sensitizes angiotensin II-induced hypertension. Hypertension. 2012;60:1023–1030. doi: 10.1161/HYPERTENSIONAHA.112.196576. [DOI] [PMC free article] [PubMed] [Google Scholar]
- Yoshika M, Komiyama Y. Takahashi H. An ouabain-like factor is secreted from immortalized hypothalamic cells in an aldosterone-dependent manner. Neurochem Int. 2011;59:104–108. doi: 10.1016/j.neuint.2011.04.019. [DOI] [PubMed] [Google Scholar]
- Yu Y, Xue BJ, Zhang ZH, Wei SG, Beltz TG, Guo F, Johnson AK. Felder RB. Early interference with p44/42 mitogen-activated protein kinase signalling in hypothalamic paraventricular nucleus attenuates angiotensin II-induced hypertension. Hypertension. 2013;61:842–849. doi: 10.1161/HYPERTENSIONAHA.111.00080. [DOI] [PMC free article] [PubMed] [Google Scholar]
- Zhang ZH, Yu Y, Kang YM, Wei SG. Felder RB. Aldosterone acts centrally to increase brain renin-angiotensin system activity and oxidative stress in normal rats. Am J Physiol Heart Circ Physiol. 2008;294:H1067–H1074. doi: 10.1152/ajpheart.01131.2007. [DOI] [PubMed] [Google Scholar]
- Zimmerman MC, Lazartigues E, Sharma RV. Davisson RL. Hypertension caused by angiotensin II infusion involves increased superoxide production in the central nervous system. Circ Res. 2004;95:210–216. doi: 10.1161/01.RES.0000135483.12297.e4. [DOI] [PubMed] [Google Scholar]