

Abstract
Striatal dopamine (DA) is critically involved in major brain functions such as motor control and deficits such as Parkinson's disease. DA is released following stimulation by two pathways: the nigrostriatal pathway and the cholinergic interneuron (ChI) pathway. The timing of synaptic transmission is critical in striatal circuits, because millisecond latency changes can reverse synaptic plasticity from long-term potentiation to long-term depression in a DA-dependent manner. Here, we determined the temporal components of ChI-driven DA release in striatal slices from optogenetic ChAT-ChR2-EYFP mice. After a light stimulus at room temperature, ChIs fired an action potential with a delay of 2.8 ms. The subsequent DA release mediated by nicotinic acetylcholine (ACh) receptors had a total latency of 17.8 ms, comprising 7.0 ms for cholinergic transmission and 10.8 ms for the downstream terminal DA release. Similar latencies of DA release were also found in striatal slices from wild-type mice. The latency of ChI-driven DA release was regulated by inhibiting the presynaptic vesicular ACh release. Moreover, we describe the time course of recovery of DA release via the two pathways and that of vesicle replenishment in DA terminals. Our work provides an example of unravelling the temporal building blocks during fundamental synaptic terminal–terminal transmission in motor regulation.
Introduction
Dopamine (DA) is essential in determining the brain states of mental health and is involved in diseases such as depression, drug addiction and Parkinson disease (Kandel et al. 2000). Most DA neurons are located in the midbrain and project axons to the distant striatum. The action potential (AP) firing of midbrain DA neurons propagates along the medial forebrain bundle via the ascending nigrostriatal pathway, and evokes DA release in the striatum (Nicola et al. 2000). Cholinergic activity is reported to regulate dopaminergic transmission (Zhou et al. 2001; Rice & Cragg, 2004; Zhang & Sulzer, 2004). Using fast cyclic voltammetry (FCV) for DA recording, it was recently reported that the activity of cholinergic interneurons (ChIs), terminals of which target on the DA terminals, drive DA release independent of ascending activity from the nigrostriatal pathway (Cachope et al. 2012; Threlfell et al. 2012). The ChI pathway comprises a complex structure of synaptic terminal–terminal connection which triggers cholinergic transmission-induced dopaminergic transmission. Generally, there are three types of synapses in neuronal circuits (axo-somatic type I, axo-dendritic type II and axo-axonic type III). Type I and II synapses have one axon terminal, while type III synapses have one presynaptic axon terminal on another axon terminal (Kandel et al. 2000). Type I and II synapses have been intensively studied, while little is known about the properties of the type III synapse, because it is technically difficult to selectively stimulate one of the two axonal terminals within the synapse. In the striatum, ultrastructural evidence suggests that the cholinergic interneuron forms axo-axonic contacts (Descarries et al. 1997). This cholinergic transmission could be ‘wiring transmission’ via classical specialized synaptic contacts (Wainer et al. 1984; Phelps et al. 1985) or ‘volume transmission’ via either activating extrasynaptic nicotinic acetylcholine receptors (nAChRs) by acetylcholine (ACh) spillover from the synaptic cleft or diffusion from asynaptic axonal varicosities (Descarries & Mechawar, 2000; Dani & Bertrand, 2007). In either case, the cholinergic axo-axonic contacts may be considered functionally equal to the type III synapse in transmitting signal.
The timing of synaptic transmission is critical to determine whether long-term potentiation (LTP) or long-term depression (LTD) forms in a synapse (Markram et al. 1997; Dan & Poo, 2006). The total latency of synaptic transmission includes the temporal components of AP propagation to the presynaptic terminal, Ca2+ influx, transmitter release, transmitter diffusion across the synaptic cleft and generation of postsynaptic current (Augustine et al. 1987; Sabatini & Regehr, 1999). At room temperature, the latency of cholinergic synaptic transmission at the neuromuscular junction is ∼1 ms in frog (Katz & Miledi, 1965), while glutamatergic synaptic transmission requires ∼1 ms in squid axon (Augustine et al. 1985), and 1–5 ms in the rodent locus coeruleus (Huang et al. 2007) and cerebellum (Sabatini & Regehr, 1996). In striatal DA terminals, however, the temporal components of ChI-driven DA release remain unknown, because the temporal resolution of FCV (100 ms) is too low (Cachope et al. 2012; Threlfell et al. 2012).
Neurotransmission includes neurotransmitter release from presynaptic vesicles. Vesicles can be grouped into different vesicle pools according to such factors as their Ca2+ dependence, release latency, release probability and replenishment rate. It is well known that different vesicle pools exist even in a single adrenal chromaffin cell or presynaptic terminal (Sorensen et al. 2003; Rizzoli & Betz, 2005; Neher & Sakaba, 2008; Liu et al. 2011; Zhang et al. 2011). After presynaptic vesicular release, the vesicle pool must be replenished within seconds or minutes to support the next run of synaptic transmission (for reviews see Sudhof, 2004; Wu, 2004; Rizzoli & Betz, 2005). Given the importance of the timing of dopaminergic transmission in its postsynaptic effects (Arbuthnott & Wickens, 2007) and behaviours, such as cue detection, movement and reward (Schultz, 2007), it is critical to determine the timing of striatal DA release via different pathways, as well as the replenishment of vesicle pools after depletion induced by the preceding release. Part of the present study has been submitted in abstract form (Wang et al. 2013).
Methods
Animals
ChAT-ChR2-EYFP transgenic mice (Ren et al. 2011; Zhao et al. 2011) and wild-type C57BL/6 mice of either sex were used following a protocol approved by the Peking University Animal Use and Care Committee. Electrochemical recording was performed in slices from mice 3–10 weeks old, patch-clamp recording was performed in slices from mice 3–4 weeks old and immunofluorescence staining was performed in slices from adult mice.
Acute brain slices
Brain slices were prepared as previously described (Huang et al. 2007; Zhao et al. 2011; Zhang et al. 2012). After anaesthesia by injection of chloral hydrate (350 mg kg−1, i.p.) as previously described (Liu et al. 2011), mice were transcardially perfused with 5–10 ml ice-cold dissection solution of the following composition (in mm): 92 N-methyl-d-glucamine, 2.5 KCl, 0.5 CaCl2, 10 MgSO4, 1.2 NaH2PO4, 30 NaHCO3, 25 glucose, 20 Hepes, 5 (l)-ascorbic acid and 3 sodium pyruvate (adjusted to pH 7.3–7.4 with concentrated HCl) (saturated with 95% O2 and 5% CO2). Mice were then decapitated and the brain removed into the dissection solution. Horizontal striatal or coronal midbrain slices (300 μm) were prepared with a vibratome (VT1200s, Leica Microsystems AG, Wetzlar, Germany) in ice-cold dissection solution. Slices were allowed to recover for 10–15 min at 33°C in dissection solution and incubated thereafter for at least 1 h at room temperature in artificial cerebrospinal fluid (ACSF) of the following composition (in mm): 112 NaCl, 2.5 KCl, 2 CaCl2, 2 MgSO4, 1.2 NaH2PO4, 30 NaHCO3, 12.5 glucose, and 20 Hepes (saturated with 95% O2 and 5% CO2). The ACSF was supplemented with 5 mm (l)-ascorbic acid, 3 mm sodium pyruvate, 100 units ml−1 penicillin G sodium and 100 μg ml−1 streptomycin sulfate. Slices were superfused (1–2 ml min−1) with ACSF (without the supplements) at room temperature during electrophysiological experiments. All chemicals were from Sigma-Aldrich (St Louis, MO, USA) except when specified otherwise.
Electrophysiological recordings
Whole-cell patch-clamp recordings were performed at room temperature (22–25°C), using an EPC9/2 amplifier (HEKA Elektronik, Lambrecht/Pfalz, Germany) as described (Chen et al. 2005; Huang et al. 2007). The resistances of patch pipettes were 3–4 MΩ. Intracellular recording solution contained (in mm): 130 potassium gluconate, 5 KCl, 4 MgCl2, 10 Hepes, 10 Na2-phosphocreatine, 0.2 EGTA, 2 Mg-ATP and 0.4 Na3-GTP (adjusted to pH 7.2 with KOH). Whole-cell recordings were obtained under differential interference contrast visual control with a BX51WI microscope (Olympus, Tokyo, Japan). To keep the ChIs silent, a small hyperpolarizing current (−200 pA) was injected in the current-clamp experiments. Signals were low-pass filtered at 2.9 kHz and digitized at 20 kHz. The liquid junction potential was not corrected. A drug-puffing device (MPS1, Yibo Instruments Inc., Wuhan, China) with a fast exchange time (<100 ms) among eight channels was used to deliver drugs to the recording site.
Electrochemical recordings
Standard carbon-fibre electrodes (ProCFEs, Dagan Instruments, Minneapolis, MN, USA) were used to detect DA as described previously (Huang et al. 2007; Wang et al. 2011) with some modifications of insulation (glass), carbon-fibre size (7 μm in diameter) and sensor length. The exposed tip (200–300 μm in length) was inserted into the subsurface of the striatal slice (laterodorsal striatum). Voltammetry was performed with a triangular waveform (−0.4 to 1.0 V vs. Ag/AgCl, 300 V s–1) at 16 Hz. The electrode was held at −0.4 V between scans. The output signal was low-pass filtered at 2.9 kHz and digitized at 20 kHz. Amperometry was performed at a holding potential of 780 mV. The amperometric current (Iamp) output signal was low-pass filtered at 100 Hz and digitized at 2 kHz. The electrochemical experiments were performed at room temperature, except for that shown in Fig.3H and I, which were performed at 17–32°C.
Figure 3. Regulation of the latency of cholinergic interneuron-driven DA release by presynaptic cholinergic transmission, stimulation intensity and temperature.
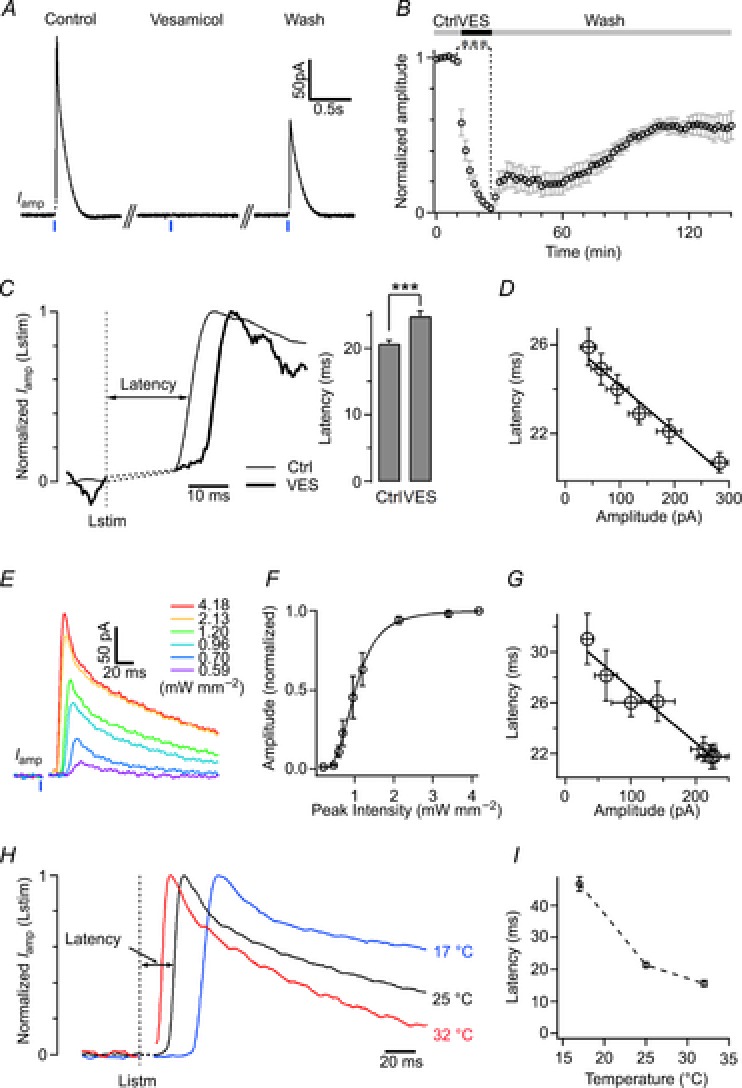
A, depletion of vesicular ACh by 30 μm vesamicol (VES, an inhibitor of the vesicular ACh transporter) greatly reduced the amplitude of Lstim-induced DA release to 3.0 ± 0.9% of control (paired t test, P < 0.001, n = 7). B, time course of the effect of VES on the amplitude of DA release. C, application of VES for 8 min reversibly prolonged the latency of Lstim-induced DA release from 20.7 ± 0.5 ms in control to 24.9 ± 0.7 ms with VES (paired t test, P < 0.001, n = 6). Iamp(Lstim) traces were normalized for latency determination. D, the latency was in inverse proportion to the amplitude (y = −20.8x + 26.2, where y is the latency in ms, and x is the amplitude in pA, R2 = 0.957). E, representative traces of DA release induced by Lstim at different intensities (n = 7). F, intensity–response dependence of Lstim-induced DA release (n = 3–7). Data points are fitted by a Hill function:  , where base = −0.00796, max = 1, xhalf = 1.01, rate = 3.53. G, the latency was in inverse proportion to the amplitude when Iamp(Lstim) was obtained at different light intensities (y = −43.3x + 31.5, where y is latency in ms, and x is amplitude in pA, R2 = 0.957). H, representative amperometric traces of Lstim-induced DA release recorded at 17, 25 and 32°C in striatal slices. To compare the latencies, all traces were normalized by peak amplitude. I, the latency of Lstim-induced DA release plotted as a function of temperature (n = 6 for 17°C, 8 for 25°C and 5 for 32°C).
Optogenetic stimulation
A 470 nm light-emitting diode (Yibo Instruments) was used for optogenetic stimulation following standard procedures (Boyden et al. 2005). The output light was coupled to the microscope and focused onto the tissue by a 60× water-immersion objective lens. The diameter of the light stimulus spot was 440 μm and the maximal light intensity reaching the tissue was ∼4.2 mW mm–2. The stimulation time of light pulses was controlled by a 5 V TTL signal from the EPC9/2 amplifier.
Electrical stimulation
Bipolar platinum electrodes (150 μm in diameter) with a tip separation of 20 μm were used for local electrical field stimulation. For electrochemical experiments, both the stimulating electrode and carbon-fibre electrodes (CFEs) were placed parallel at 100 μm separation in the horizontal laterodorsal striatum slices. For patch-clamp recording of AP firing in DA neurons, both the stimulating electrode and the patch pipette were placed parallel at 100 μm separation in the coronal substantia nigra pars compacta (SNc) slices. Field pulses (0.2 ms, 0.3–1.4 mA) generated by a stimulator with an isolation unit (S88K, Grass Instruments, Warwick, RI, USA) were used to induce DA release or AP firing. The stimulation time of field pulses was controlled by a 5 V TTL signal from the EPC9/2 amplifier.
Immunohistochemistry
Immunostaining was performed as previously described (Huang et al. 2007). Briefly, adult mice were anaesthetized and transcardially perfused with normal saline followed by 4% paraformaldehyde. Brains were dissected, post-fixed overnight in 4% paraformaldehyde, cryoprotected in 30% sucrose and frozen in tissue-freezing medium (Tissue-Tek). The slices were sectioned at 50 μm on a cryostat and floated in PBS. Sections were rinsed with 0.2% Triton X-100 in PBS for 30 min, and then blocked with 2% bovine serum albumin (BSA) in PBS for 1 h at room temperature. Sections were then incubated with primary antibodies in BSA at 4°C overnight. The primary antibodies were: goat anti-ChAT (1:500, EMD Millipore, Billerica, MA). Sections were rinsed and incubated for 3 h at room temperature with the second antibodies Alexa546-conjugated donkey anti-goat (1:500, Life Technologies Inc., Carlsbad, CA, USA), rinsed again, stained with 1 μm DAPI (Life Technologies) and mounted on slides with mounting solution (Dako, Glostrup, Denmark). Immunofluorescence-labelled sections were imaged under a confocal laser scanning microscope (Zeiss LSM 700, Carl Zeiss, Göttingen, Germany).
Theory of replenishment components within terminal–terminal transmission
Synaptic transmission between the axons of two neurons is mediated by an axo-axonic synapse (type III terminal–terminal structure), which consists of axon terminal A (presynapse of cell A) on another axon terminal B (presynapse of cell B, also postsynaptic to cell A). Following depletion of the vesicle pool by the first of a pair of stimuli, the recovery of terminal–terminal synaptic transmission can be tested by the second stimulus. For dopaminergic transmission in the striatum, paired stimuli with a short interpulse interval cause a dramatic depression of DA release (Schmitz et al. 2002; Cragg, 2003; Zhang & Sulzer, 2004).
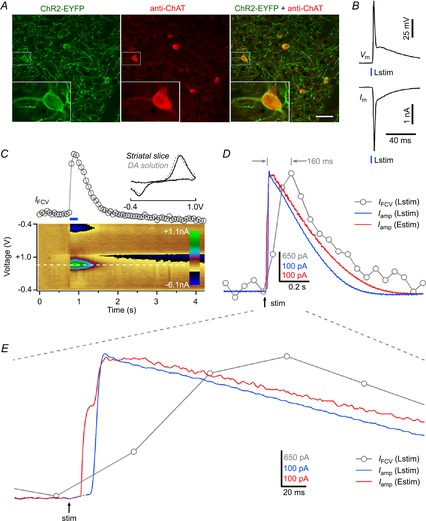
Paired-pulse ratio (PPR) is commonly used to study recovery of release in chromaffin cells, glutamate synapses and dopaminergic terminals (Cragg, 2003; Zhang & Sulzer, 2004; Neher & Sakaba, 2008; Zhang et al. 2011). There are several hypotheses to interpret the recovery of vesicle release, including Ca2+-dependent release probability (Rice & Cragg, 2004), G protein-coupled receptor-mediated auto-inhibition (Schmitz et al. 2002) and vesicle pool replenishment (Neher & Sakaba, 2008; Zhang et al. 2011). To quantitatively interpret our PPR results, we use the vesicle pool hypothesis. Sa(t) and Sb(t) are defined as transmitter release of terminals A and B, respectively. The activation of terminal A induces the final transmitter release signal from terminal B (S(t)):
 |
1 |
where S(t) is the transmitter release signal from terminal B that was triggered by the activation of terminal A. S(t) (but not Sa(t) or Sb(t)) can be directly detected. TARP is the refractory time during which Sa(t) is a sub-threshold input to induce AP firing or transmitter release at terminal B, which is determined by both replenishment of the vesicle pool in terminal A and nAChR-induced DA release in terminal B. The ChI-driven DA release signal pathway consists of terminal A release, nAChR activation and terminal B release. Each of terminals A and B processes gradual vesicle release, while their linker, nAChR-induced DA release, behaves as a ‘step-like component’ in eqn (1). The strength of the input to terminal B is determined not only by terminal A but also by nAChRs on terminal B. Thus, although S(t) is vesicle release from terminal B, S(t) = Sb′(t) ≠ Sb (t) even for t ≥ TARP, unless the cholinergic transmission and nAChRs are fully recovered within TARP.
Regarding the individual terminals A and B, we assume (1) every stimulus triggers the same Ca2+ signal, and (2) the replenishment of vesicle pools in terminals A and B consists of components of the established  format (termed the ‘classical component’ (Otsuka et al. 1962; Elmqvist & Quastel, 1965; Katz, 1969; Dittman & Regehr, 1998; Neher & Sakaba, 2008; Pan & Zucker, 2009)). Assuming terminals A and B contain only a single component, we have:
| 2 |
| 3 |
Equation (2) (or eqn (3)) describes the ‘classical law’ of vesicle pool replenishment for a single synaptic terminal. Note, for simplicity, that we further assume the replenishment (measured by the release signal following the second stimulus) in eqns (1)–(3) to be S = Sa = Sb = 0 immediately after stimulation (t = 0), or the vesicle pools are assumed to be fully depleted by the AP induced by the first of the paired stimuli. More generally, if the depletion level of a vesicle pool is α (0 ≤ α ≤ 1), such as the pool in eqn (2), the vesicle pool component has the general form  . Note the assumptions upon using eqns (1)–(3).
Data analysis
Pulse v8.80 software (HEKA Elektronik) was used for data acquisition in both patch-clamp and amperometry experiments. Patchmaster v2.20 software (HEKA Elektronik) was used for acquisition of FCV data. Igor Pro 6.22 software (Wavemetrics, Lake Oswego, OR, USA) was used to analyse the patch-clamp, amperometry and FCV data. Stimulation (Estim and Lstim)-induced transient artifacts in the amperometric traces were removed for clarity. The latency of DA release signals/AP events was defined by the interval between stimulus onset and time at 50% response. Data are presented as mean ± standard error of the mean (SEM). Statistical differences between two groups were evaluated with Student's t test. P < 0.05 was considered statistically significant.
Results
Selective excitation of cholinergic interneurons triggered DA release from striatum
We used ChAT-ChR2-EYFP transgenic mice to selectively stimulate ChIs in horizontal striatal slices. Immunofluorescence staining showed that ChR2-EYFP was strongly and specifically expressed in both the somata and processes of ChIs in the dorsal striatum. The interneurons were identified by the expression of choline acetyltransferase (ChAT, Fig.1A). ChR2-EYFP was not expressed in DA neurons identified by an antibody against tyrosine hydroxylase in either the striatum or the ventral midbrain (data not shown).
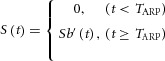
Figure 1. Optogenetic stimulation induces DA release triggered by cholinergic transmission in the striatum.
A, ChR2-EYFP (green) was strongly and selectively expressed in cholinergic interneurons (ChIs) (labelled with anti-ChAT, red) in the dorsal striatum of ChAT-ChR2-EYFP mice. Scale bar: 50 μm. B, A transient light stimulus (470 nm, 1 ms) immediately triggered a single AP (Vm, recorded under current-clamp, n = 11) and a fast inward current (Im, recorded under voltage-clamp, n = 12) in a ChI. C, representative FCV trace of Lstim-induced DA release via the ChI pathway (n = 9). Upper, FCV-derived IFCV–time plot. IFCV is the peak oxidative current at 665 mV; lower, I–V–t pseudocolour plot (Phillips et al. 2003) with time corresponding to the upper IFCV. Lstim was applied for 200 ms. Inset, normalized background-subtracted FCV voltammograms of DA release in the striatal slice (continuous line) vs. in 10 μm DA in vitro (dashed line). D, representative amperometric traces of DA release induced by a light stimulus (Iamp(Lstim), n = 25) or an electrical stimulus (Estim, Iamp (Estim), n = 19) vs. the IFCV–time trace of DA release induced by Lstim (FCV(Lstim), n = 9). E, expanded view of the traces shown in D.
To determine whether a light stimulus (Lstim) selectively and effectively excited ChIs, we performed whole-cell patch-clamp measurements. A standard blue light pulse at 470 nm, 1 ms in duration, rapidly and reproducibly elicited a single AP under current-clamp and a fast inward current under voltage-clamp in ChIs in the dorsal striatum (Fig.1B). Repetitive patterned Lstim pulses (5–20 Hz) evoked trains of APs (data not shown). This Lstim-induced AP firing was sensitive to tetrodotoxin (data not shown). By contrast, no APs were elicited in DA neurons in the SNc or the ventral tegmental area (VTA, data not shown), indicating that Lstim selectively stimulated ChIs in the dorsal striatum but not DA neurons in the midbrain.
We used both electrochemical FCV and amperometry to assess DA release in the laterodorsal striatum. Immediately after a single Lstim, an abrupt increase of extracellular DA overflow was detected by standard FCV with a micro-CFE (sampling rate ≤16 Hz, Fig.1C). After subtracting the background current in the cyclic voltammograms, an oxidative peak (+650 mV) and a reductive peak (−200 mV) were detected in the striatal slice; these were identical to the FCV of 10 μm DA applied in vitro, indicating that DA release was responsible for the Lstim-induced electrochemical signal (Fig.1C). To achieve higher temporal resolution, we changed the recording mode from FCV to amperometry with the CFE at a constant holding potential of +780 mV. We used a 2 kHz sampling rate, which is >100 times higher than that by FCV, to record DA release as amperometric current (Iamp). Lstim-induced Iamp(Lstim) represented ChI-driven DA release (Iamp(ChID) = Iamp(Lstim), Fig.1D and E). The relationship between Iamp(Lstim) and light intensity was fitted with a Hill function (see Fig.3F) and the profile of Iamp(Lstim) was similar to the DA release induced by a conventional local electrical stimulus (Estim) (Iamp(Estim), Fig.1D and E). Due to the low temporal resolution of FCV (sampling interval ≥62 ms), the precise onset timing of the evoked DA release could not be accurately measured, while the Iamp signal provided the necessary resolution to investigate the millisecond timing information of the striatal DA release (Fig.1C–E; see also Phillips et al. 2003).
Timing of cholinergic transmission-induced DA release
In contrast to the DA release induced by Lstim that selectively activated the ChI pathway, local Estim activated both the ChI pathway (activation of ChIs or their axons) and the nigrostriatal pathway (activation of DA axons in the striatum), and induced a mixed DA release with a biphasic onset shown in Iamp(Estim) (Figs 1E and 2A and B; see Wang et al. 2013). The phase I component represented DA release via the ascending nigrostriatal pathway, while phase II represented DA release via the ChI pathway, because a specific antagonist of β2-containing nAChRs, DHβE, blocked only the phase II but not the phase I component of Iamp(Estim) (Fig.2B). This is consistent with previous studies showing that DHβE abolishes the ChI-driven DA release induced by Lstim (Cachope et al. 2012; Threlfell et al. 2012). In addition, the latency of phase II of Iamp(Estim) was equal to the latency of Iamp(Lstim) (Fig.2B), which also confirmed the dual pathway origin of the biphasic onset of Iamp(Estim).
Figure 2. Timing of presynaptic and postsynaptic signals during cholinergic interneuron-driven DA release.
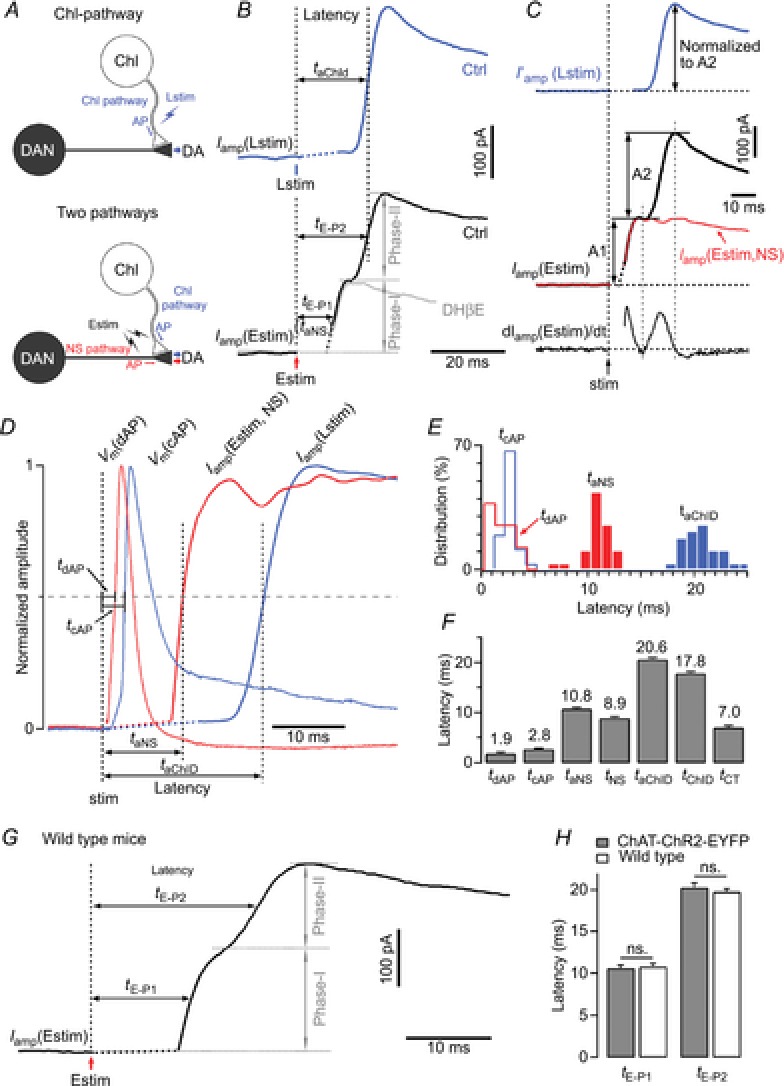
A, schema of Lstim-induced DA release via the ChI pathway and Estim-induced DA release via both the nigrostriatal (NS) and ChI pathways. ChI, cholinergic interneuron; DAN, DA neuron. B, Lstim-induced DA release (Iamp(Lstim)) showed a monophasic onset (n = 25), while Estim-induced DA release (Iamp(Estim)) showed a biphasic onset (n = 19). Iamp(Estim) = Iamp(Estim, NS) + Iamp(Estim, ChID). Iamp(Estim, NS) and Iamp(Estim, ChID) corresponded to the nigrostriatal DA release component (phase I) and the ChI-driven DA release component (phase II), respectively. The total latency of DA release was determined by the interval between stimulus onset and time at 50% response. The latency (tE-P2) of Iamp (Estim, ChID) and the latency (taChID) of Iamp(Lstim) were nearly identical, both of which were longer than the latency (tE-P2 or taNS) of Iamp (Estim, NS). DHβE (1 μm), a specific antagonist of β2-containing nAChRs, selectively blocked the phase II but not the phase I component of Iamp(Estim) (n = 4). C, the typical Estim-induced biphasic DA release signal Iamp(Estim) contained a phase I component (amplitude A1, Iamp(Estim, NS)) and a phase II component (amplitude A2, Iamp(Estim, ChID)). The pure nigrostriatal component of Estim-induced DA release (phase I, Iamp(Estim, NS)) was mathematically isolated by subtracting Iamp(Estim, ChID) from total Iamp(Estim): Iamp(Estim, NS) = Iamp(Estim) − Iamp(Estim, ChID). Iamp(Estim, ChID) was estimated by direct measurement of Lstim-induced Iamp(Lstim): Iamp(Estim, ChID) = I′amp(Lstim) = Iamp(Lstim) × (A2/amplitude of Iamp(Lstim)). D, latencies of APs in a DA neuron (tdAP), a ChI (tcAP), and the total latencies of nigrostriatal (taNS) and ChI-driven DA releases (taChID). The latency taNS was obtained from the mathematically isolated traces of nigrostriatal DA release (Iamp(Estim, NS). E, distribution of observed tdAP, tcAP, taNS and iaChID. F, from the same data as in D, summary of the latencies of AP firing in DA neurons (tdAP, n = 16), ChIs (tcAP, n = 36), total latency of nigrostriatal DA release (taNS, n = 27), latency of nigrostriatal DA release after AP firing (tNS = taNS − tdAP), total latency of ChI-driven DA release (taChID, n = 27) and latency of ChI-driven DA release after AP firing (tChID = taChID − tcAP), as well as the difference between tChID and taNS (tCT = taChID − taNS − tcAP, n = 18). G, representative amperometric trace of Estim-induced DA release (Iamp(Estim)) in a striatal slice from a wild-type C57BL/6 mouse. tE-P1, latency of phase I of Iamp(Estim); tE-P2, latency of phase II of Iamp(Estim). H, summary of the latency of Iamp(Estim) in ChAT-ChR2-EYFP mice (n = 16) vs. wild-type C57BL/6 mice (unpaired t test, n = 13).
Next, we investigated the temporal components during the initiation of ChI-driven DA release. We recorded the APs with whole-cell patch-clamp and the DA release signals with amperometry in the laterodorsal striatum in horizontal striatal slices. Following Lstim, the latency of APs in ChIs (tcAP) was 2.8 ± 0.1 ms (as measured at the somata of ChIs in dorsal striatum slices), the total latency of Iamp(Lstim) via the ChI pathway (taChID, ‘aChID’ denotes AP + ChI-driven DA release (ChID)) was 20.6 ± 0.3 ms, and the ChID latency from cholinergic AP firing to DA release (tChID = taChID−tcAP) was 17.8 ± 0.3 ms (Fig.2E and F). Following Estim, the latency of APs in DA neurons (tdAP) was 1.9 ± 0.2 ms (as measured at the somata of DA neurons in SNc slices). To calculate the total latency of Iamp(Estim, NS) via the nigrostriatal pathway (taNS), phase I of Iamp(Estim) was mathematically isolated as shown in Fig.2C. The taNS was 10.8 ± 0.2 ms, and the latency of nigrostriatal DA release (tNS, from dopaminergic AP firing to release) was 8.9 ± 0.2 ms (Fig.2D–F). Notably, there was a gap of 7.0 ± 0.4 ms between tChID and taNS. Since terminal DA release is initiated after the preceding cholinergic transmission has been accomplished, the 7.0 ms gap between tChID and taNS should represent the latency of cholinergic transmission in the ChI pathway (tCT = tChID − taSN = taChID − taNS − tcAP, ‘CT’ denotes cholinergic transmission). In addition to factors downstream of Ca2+, the latency between a cholinergic excitatory postsynaptic current (EPSC) and DA release also depends on whether the EPSC induces an AP in the DA terminal. Note, in the DA terminal of ChI-driven DA release in Fig.2B, we considered that the phase I DA signal was produced by the Estim-induced first AP via the nigrostriatal pathway. However, whether the phase II DA signal via the ChI pathway was triggered by the fractional Ca2+ influx through nAChRs (Zhou & Neher, 1993) with (as assumed in Fig.2B) or without the second AP remained unknown. tCT would be slightly longer (extended for <taAP) if the Estim-induced cholinergic EPSC did not trigger the second AP for the phase II DA signal in Fig.2B.
In addition to ChAT-ChR2-EYFP transgenic mice, we also recorded the Estim-induced DA release from dorsal striatum slices in wild-type C57BL/6 mice. The biphasic onset of Iamp(Estim) was also found in these mice (Fig.2G). The latencies of DA release via the two pathways were nearly identical in the wild-type and transgenic mice (Fig.2H). Thus, overexpression of the vesicular ACh transporter (VAChT) in ChAT-ChR2-EYFP mice did not affect the timing of DA release in brain slices, although some behaviours are changed in wild-type versus ChAT-ChR2-EYFP mice (Kolisnyk et al. 2013). Regarding temperature dependence, Iamp(Lstim) latencies were 46.9 ± 2.3 ms at 17°C, 21.3 ± 0.8 ms at 25°C and 15.5 ± 1.0 ms at 32°C, indicating that ChI-driven DA release was accelerated at higher temperature (32°C) (Fig.3H and I).
Regulation of the latency of ChI-driven DA release by cholinergic presynaptic mechanisms
To investigate the mechanism of how cholinergic transmission affects the latency of ChI-driven DA release, we examined the effects on latency of depleting the cholinergic vesicle pool. Vesamicol, an inhibitor of the VAChT (Enomoto, 1988; Lupa, 1988), inhibits Estim-induced DA release (Zhou et al. 2001), suggesting that endogenous ACh has a regulatory effect on DA release. Lstim-induced DA release gradually declined to 3.0 ± 0.9% of control after puffing 30 μm vesamicol from 2 to 16 min, and recovered to 64 ± 14% after 2 h washout (Fig.3A and B), suggesting that the ChI pathway DA release is mediated by vesicular ACh release. Meanwhile, the normalized amperometric recordings showed that the latency of Iamp(Lstim) was extended from 20.7 ± 0.5 to 24.9 ± 0.7 ms after vesamicol treatment (Fig.3C), and recovered to 22.7 ± 0.7 ms after washout. The increase in latency was in parallel with the reduction of the amplitude during the application of vesamicol (Fig.3D), suggesting that the latency is dependent on the amount of ACh released from presynaptic terminals. We also tested the correlation of latency and amplitude of Iamp(Lstim) by varying the intensity of light stimulation. Both the latency and the amplitude of Iamp(Lstim) were dependent on the intensity of Lstim (Fig.3E). Similar to the data shown in Fig.3D, the correlation between latency and amplitude was fitted by a linear function (Fig.3G). Thus, presynaptic ACh release concurrently regulates the quantity and the timing of subsequent DA release.
Replenishment of the dopaminergic vesicle pool
In a single terminal synapse, transmission requires replenishment of the presynaptic vesicle pool. In the complex synapse of ChI-driven DA release, a recovery period is required to recruit the depleted presynaptic vesicle pools in the two cascade terminals (i.e. ACh and DA pools) before it is ready to reproduce the same level of DA release as the previous one. Next, we examined the recovery of the ChI pathway after stimulation.
The recovery rate of the DA release was determined with PPR tests (Betz, 1970; Kusano & Landau, 1975; Schmitz et al. 2002). We applied paired Lstim for the recovery rate (PPRLstim) of ChI-driven DA release, and paired Estim for the recovery rate (PPREstim) of the mixed (nigrostriatal and ChI-driven) DA release (Fig.4A and B). The Iamp(Lstim) evoked by the second pulse at a 1 s interval in paired Lstim was amost completely suppressed (PPRLstim = 2.0 ± 0.5%), while the Iamp(Estim) evoked by the second pulse in paired Estim at a 1 s interval recovered to 9.2 ± 1.2% (PPREstim = 9.2 ± 1.2%). Both Iamp(Lstim) and Iamp(Estim) fully recovered (PPRLstim = PPREstim = 100%) within 120 s after the first pulse. PPRLstim and PPREstim are plotted in Fig.4B. A notable difference between the recovery rates of PPRLstim and PPREstim was that within the initial 1 s after the first pulse, the PPRLstim was in an absolute refractory period (ARP, time period when PPRLstim <2%), but PPREstim partially remained (Fig.4B). After the ARP (TARP = 1 s), the PPRLstim recovered following a single exponential function with τChID = 21 s (Fig.4B). This result differs from a previous finding that ARP is absent in the nucleus accumbens, although the PPR (100 s) is ∼85% (Cachope et al. 2012), which is similar to that in the dorsal striatum (Fig.4B). In addition, as reported before (Threlfell et al. 2012), we confirmed that neither D2 receptors nor mAChRs are responsible for the ARP (data not shown).
Figure 4. Pared-pulse ratio of dopamine release following optogenetic light stimulation and electrical field stimulation.
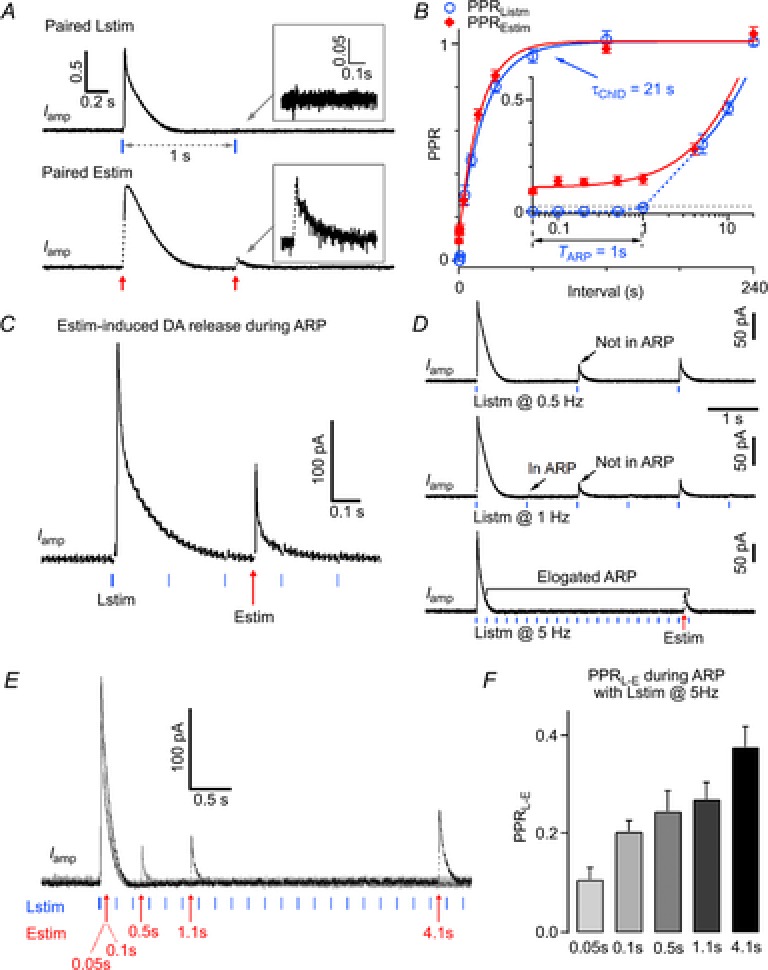
A, representative normalized Iamp traces of DA release induced by paired Lstim (upper) and paired Estim (lower) at a 1 s interpulse interval. Inset, expanded display of Iamp by the second pulse. B, PPR recovery time course of DA release after Lstim (n = 5) and Estim (n = 4). The PPR change within the initial 10 s was magnified (Inset). The PPR of DA release induced by Lstim (PPRLstim) had two components, a preceding absolute refractory period (TARP = 1 s, when PPRLstim <2%), and a subsequent single-exponential recovery (τChID = 21 s). Data points of PPRLstim after 1 s were fitted by a single exponential function: 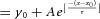 , where y0 = 1.01, A = −0.704, x0 = 5, τ = 20.8 s. The PPR of DA release induced by Estim (PPREstim) can be fitted by a constant component (10%) and a single exponential recovery component (90%):
  , where y0 = 1.01, A = −0.903, x0 = 0.05, τ = 17.1 s. C, a representative trace showing Estim-induced DA release during the ARP, while the repeated Lstim (the second to the last) failed to induce DA release (n = 7). D, representative amperometric traces of DA release induced by repeated Lstim at 0.5 Hz (top, n = 3), 1 Hz (middle, n = 3) and 5 Hz (bottom n = 7). The duration of the ARP depended on the frequency of the Lstim (ARP <2 s for 0.5 Hz, 1 s <ARP <2 s for 1 Hz, ATP >4.2 s for 5 Hz). E, five overlapping recordings as in C, but at different intervals (0.05, 0.1, 0.5, 1.1 and 4.1 s). The Estim during the ARP induced larger DA releases as the interval increased. F, summary of the PPRL-E (PPRL-E = Iamp(Estim)/Iamp(Lstim1)) at different times during the ARP (n = 7).
To determine whether the suppression of ChI-driven DA release is caused by full depletion of the dopaminergic vesicle pool or by a failure of cholinergic transmission, and to further investigate the time course of dopaminergic pool replenishment following Lstim, we designed a protocol with mixed Lstim and Estim. Lstim at 5 Hz was applied to continually deplete the cholinergic transmission. During the refractory period from the second to the last pulse of the 5 Hz Lstim, DA release could not be induced by Lstim but was induced by Estim (Fig.4C). This Estim-induced DA release during the ARP could be either from the remaining/recycled dopaminergic vesicles in DA terminals after the Lstim or from DA terminals that were only controlled by Estim but not Lstim. However, the duration of the ARP was prolonged to >4 s by repeated Lstim at 5 Hz (Fig.4D). When the frequency of Lstim was low, the second pulse of 0.5 Hz Lstim and the third pulse of 1 Hz Lstim still induced DA release (Fig.4D). These results indicate that the ARP was elongated by high frequency of Lstim, and suggest that cholinergic transmission is responsible for the ARP (Fig.4D). When the interval between the first Lstim and the Estim increased from 0.05 to 4.1 s, the amplitude of Estim-induced DA release during the ARP increased from 29.5 ± 7.2 to 105.0 ± 1.9 pA (Fig.4E), and the PPRL-E (PPRL-E = Iamp(Estim)/Iamp(Lstim1)) also increased from 0.11 ± 0.02 to 0.38 ± 0.04 (Fig.4E and F), suggesting that this Estim-induced DA release was indeed from a dopaminergic vesicle pool that was undergoing replenishment after partial depletion by the preceding Lstim. Taken together, these results suggest that the ARP of ChI-driven DA release is produced by a cholinergic mechanism, but not by the depletion of dopaminergic vesicles in DA terminals.
We then determined the time course of replenishment of the dopaminergic vesicle pool with paired Lstim–Estim (Fig.5). As shown above, the increase in Iamp(Estim) after the preceding Lstim reflected the DA release from the replenished dopaminergic vesicle pool (Fig.4E and F). To measure the replenishment of the DA vesicle pool after ChI-driven DA release, we defined the PPR of the DA terminal (PPRDT) as PPRDT = Iamp(Estim, NS)/Iamp(Estim0, NS). Iamp(Estim, NS) was the nigrostriatal component of Iamp(Estim) induced by a test Estim at different intervals (0.05–120 s) following the first Lstim, while the control Iamp(Estim0, NS) was isolated from Iamp(Estim) when the DA vesicle pool was intact in resting conditions. Iamp(Estim, NS) after Lstim was reduced to 18 ± 3 and 93 ± 3% of control at the intervals 0.05 and 120 s, respectively (PPRDT(0.05 s) = 18 ± 3%, PPRDT(120 s) = 93 ± 3%), indicating that 81% (i.e. (93%−18%)/93%) of Iamp(Estim, NS) at the 120 s interval was from replenished dopaminergic vesicles (Fig.5A). The increase of PPRDT reflected replenishment of the dopaminergic vesicle pool after Lstim-induced depletion. To describe the time course of replenishment, PPRDT data points were fitted by a single exponential function with τDT = 15 s (Fig.5B).
Figure 5. Replenishment of dopaminergic vesicle pool following cholinergic transmission.
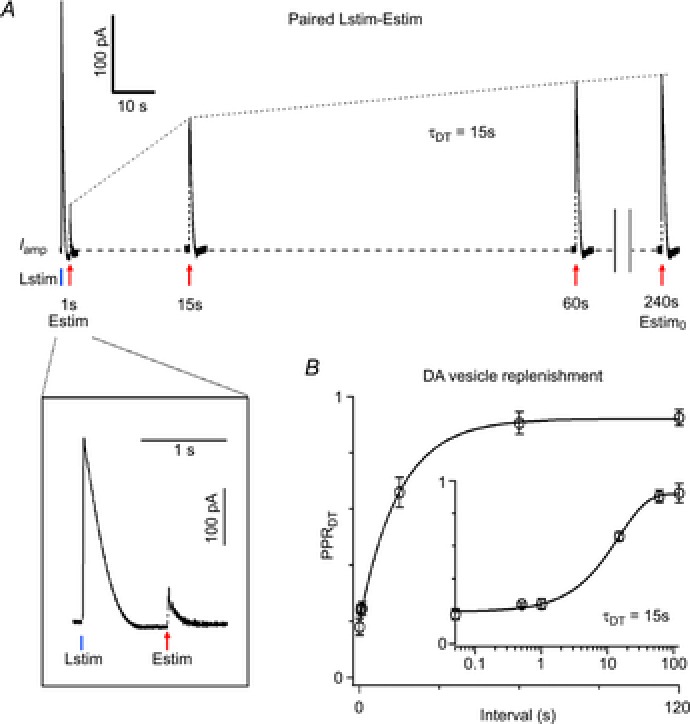
A, superimposed traces of Iamp induced by paired Lstim–Estim with intervals from 1 to 240 s. The control Estim0 was defined as an Estim with an interval ≥4 min. Inset, expanded display of Iamp induced by paired Lstim–Estim with a 1 s interval. For clarity, the nigrostriatal DA release Iamp(Estim, NS) estimated from Iamp(Estim) is shown. The percentage replenishment of the dopaminergic vesicle pool was determined by PPRDT = Iamp (Estim, NS)/Iamp (Estim0, NS). B, plot of PPRDT
vs. interval (0.05–120 s) between the first Iamp(Lstim) and Iamp(Estim, NS) (n = 7 for 0.5 s point, n = 8 for other points). Inset, PPRDT was plotted with horizontal log axis to magnify the change of PPRDT within the initial 10 s. Replenishment of the dopaminergic vesicle pool had a single exponential time constant of τDT = 15 s. Data points of PPRDT were fitted by a single-exponential function: 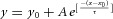 , where y0 = 0.922, A = −0.722, x0 = 0.05, τ = 14.7 s.
Together, from the three types of paired stimuli experiments (Lstim–Lstim, Estim–Estim and Lstim–Estim), we determined the time course of dopaminergic vesicle pool replenishment in a single DA terminal (τDT = 15 s), as well as the recovery of the ChI pathway (with refractory time TARP = 1 s, and replenishment time constant τChID = 21 s) in the complex synapse. We found that replenishment of the dopaminergic vesicle pool via the two different pathways had similar time constants (τDT = 15 s, τChID = 21 s), while the cholinergic mechanism caused an additional ARP in the recovery of the final ChI-driven DA release.
Discussion
In the present work, by selectively stimulating ChIs and measuring DA release with CFEs, we investigated the timing of DA release and replenishment through both the nigrostriatal and the ChI pathways in striatal slices. We determined the individual components that contributed to the timing of DA release and replenishment of the dopaminergic vesicle pool for ChI-driven DA release.
Timing of striatal synaptic transmission
One major goal of the present work was to determine the timing of DA release via ACh terminal – DA terminal synaptic transmission. Taking advantage of selective optogenetic stimulation, we separated the DA release via two different pathways. We measured the latencies of the sequential events in striatal neurotransmission, both within the nigrostriatal pathway and within the ChI pathway, as summarized in Fig.6A. The latency of DA release via the ChI pathway (taChID = 20.6 ms) was 1.9 times that via the nigrostriatal pathway (taNS = 10.8 ms, Fig.2D–F).
Figure 6. Model of DA release via the cholinergic interneuron pathway in the striatum.
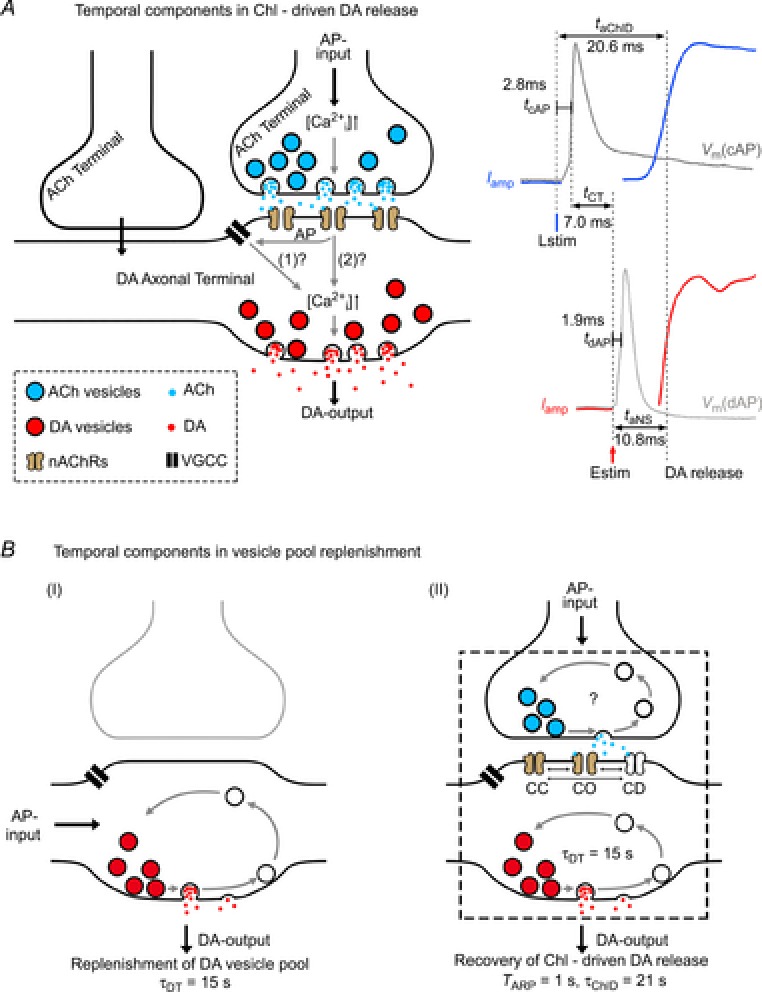
A, temporal components in DA release via the ChI pathway. Lstim selectively activates ChR2, elicits action potential (AP) firing in ChIs within 2.8 ± 0.1 ms (tcAP) and induces cholinergic synaptic transmission (tCT = 7.0 ± 0.4 ms). Following the synchronized ACh release from multiple ACh terminals (Threlfell et al. 2012), the local postsynaptic nAChRs on DA terminals (local axons) are activated, leading to Ca2+ influx into the DA terminal either through activating a dopaminergic AP (tdAP = 1.9 ± 0.2 ms) and voltage-gated Ca2+ channels or directly through the nAChRs. The increased [Ca2+]i triggers DA release (DA-output) and finishes dopaminergic transmission (estimated from Iamp(Estim, NS), taNS = 10.8 ± 0.2 ms) as well as ChI-driven DA release (tChID = 17.8 ± 0.3 ms). Total Lstim-induced DA release takes time taChID = tcAP + tChID, while Estim-induced DA release takes time taNS. B, temporal components in vesicle pool replenishment after ChI-driven DA release. I, for a DA terminal, with AP input and DA output, the PPR recovery follows the classical law (eqn (3)) with a single exponential time constant of τDT = 15 s. II, for a complex terminal–terminal synapse, the PPR recovery follows a non-classical format (eqn (1), with a preceding 1 s absolute refractory period (TARP = 1 s) and a subsequent classical time constant of τChID = 21 s. CC, nAChR channel closed; CO, channel open; CD, channel desensitized.
We estimated the two components of the 17.8 ms ChID latency, the latency of cholinergic transmission (tCT, from cholinergic AP to nAChR activation on the DA terminal) and the latency of dopaminergic transmission (tcDT, from nAChR activation to DA release, ‘cDT’ denotes cholinergic receptor-induced dopaminergic transmission). As indicated in Fig.6A (a complex synapse may include one or multiple ACh terminals on one DA terminal and part of the axon), cholinergic transmission can trigger a local AP in the DA terminal. In addition to Ca2+ influx through nAChRs (Zhou & Neher, 1993), the AP leads to Ca2+ influx through voltage-gated Ca2+ channels. Under this assumption, the latency of dopaminergic transmission remains the same between the nigrostriatal (taNS = tdAP + tNS = 10.8 ms) and ChI pathways (tcDT = taNS = tdAP + tNS = 10.8 ms), and the latency of the corresponding cholinergic transmission is tCT = tChID − tcDT = 7.0 ms, where 1.9 ms (tdAP) is for the AP firing in the DA neuron and 2.8 ms (tcAP) is for the AP firing in the ChI, assuming the same latency for the somatic and terminal APs. Alternatively, if a local AP is not generated in the DA terminal during ChI-driven DA release, and Ca2+ influx occurs only through the nAChRs, the latency of dopaminergic transmission is tcDT = tNS = taNS − tdAP = 8.9 ms, and the latency of the corresponding cholinergic transmission would be tCT = tChID − tcDT = 8.9 ms, which is 1.9 ms longer than tCT proposed in Fig.6A. Since the latency of cholinergic transmission (tCT) was only 7–9 ms at room temperature, which is quite close to glutamate synaptic transmission (1–5 ms; Sabatini & Regehr, 1996; Huang et al. 2007). Regarding previous anatomical works on cholinergic synaptic structures in the dorsal striatum, the present physiological finding is consistent with some observations (Wainer et al. 1984; Phelps et al. 1985) but not others (Descarries et al. 1997; Descarries & Mechawar, 2000). Future work should determine whether synaptic or asynaptic cholinergic transmission is responsible for ChI-driven DA release.
The total latency of ChI-driven DA release (taChID) could be regulated by presynaptic vesicular ACh release. After inhibition of VAChT with vesamicol, the Lstim-induced DA release was completely blocked and the latency of Iamp(Lstim) was prolonged (Fig.3A–D). Vesamicol also totally blocked the phase II component of Iamp(Estim) (data not shown), which is consistent with its effect on the Lstim-induced DA release. Vesamicol reduced the amplitude of the phase I component of Iamp(Estim) by ∼30%, which might be an indirect effect (data not shown). Thus, presynaptic vesicular release not only influenced the strength of the postsynaptic response but also regulated the latency of DA release via the terminal–terminal connection.
Considering that the expression level of VAChT is enhanced in ChAT-ChR2-EYFP transgenic mice (Kolisnyk et al. 2013), we recorded the Estim-induced DA release in wild-type C57BL/6 mice. A biphasic onset of Iamp(Estim) was also found in these mice (Fig.2G). The latency of DA release via the two pathways, which can be estimated by the latency of the two phases of Iamp(Estim), showed no significant difference between wild-type and transgenic mice (Fig.2H). These results suggest that the overexpression of VAChT in ChAT-ChR2-EYFP mice does not affect the timing of DA release in striatal brain slices, although some behaviours of the transgenic mice are changed (Kolisnyk et al. 2013). Note that, considering Estim-induced artifacts were right before Iamp signal (Methods), 10.8 ms is upper limit of phase-I latency (Figs. 2 and 6).
We measured DA release by amperometry and FCV. Transient increases in local DA concentration [DA]e (or ‘DA overflow’) from DA release can be detected by both FCV and amperometry (Wightman, 2006; Wang et al. 2011). [DA]e recorded by FCV mimics the real profile of native [DA]e, because DA molecules are first oxidized and then reduced by the CFE at a changing voltage during a cyclical voltage scanning period. In contrast, amperometry detects [DA]e at a constant voltage (Wightman et al. 1991; Chow et al. 1992; Zhou & Misler, 1995). Therefore, amperometry has a temporal resolution >100-fold higher than FCV (0.5 vs. 100 ms) in [DA]e recording. This greater time resolution is key to determining the temporal components during synaptic transmission in brain slices at the millisecond level (Figs 1 and 2; see also Bruns & Jahn, 1995; Wightman, 2006; Huang et al. 2007).
Timing of vesicle pool replenishment
Our second major finding was the time courses of the components of DA vesicle replenishment in the nigrostriatal and ChI pathways. Threlfell et al. (2012) have shown that the DA release evoked by a single light flash (and APs in ChIs) is unresponsive to subsequent light flashes in short trains of APs lasting 10–1000 ms. We extended this and found that Iamp(Lstim) had an ARP, which was 1000 ms, because after 1000 ms the ChI-driven DA release started to recover with a time constant of 21 s (Fig.4B). Threlfell et al. (2012) identified that this refractory mechanism does not occur for DA release driven directly from DA axons by activity in DA neurons. In the present work, we further found that the ARP was prolonged from 1 to >4 s by 5 Hz Lstim but not by 0.5 or 1 Hz Lstim. Because the frequency could only affect cholinergic transmission, the ARP elongation suggests that cholinergic transmission is responsible for the ARP (Figs 4D and 6). The elongation further implicates that Lstim-induced ACh release exists even during ARP. During the ARP, the amplitude of Iamp(Estim) increased as the interval increased (Fig.4E and F), confirming that Estim-induced DA release during the ARP was indeed from a dopaminergic vesicle pool that was being replenished after partial depletion by the preceding Lstim. These findings suggest a simple hypothesis for the refractory mechanism: for a short period after the first successful ChI-driven DA release, the cholinergic transmission is decreased to a sub-threshold level such that the intra-terminal Ca2+ is unable to release DA, even though the dopaminergic vesicle pool is still available.
The existence of the ARP suggests that the complex synapse (terminal–terminal structure) as a whole does not follow the classical law of vesicle pool replenishment for the single-terminal synapse (eqn (3)). Instead, the ARP follows a theoretical prediction that the complex type III synapse has two replenishment components ( , (t ≤ TARP);
  (t > TARP); see eqn (1)). Within the ARP, the vesicles in DA terminals probably ‘see’ only sub-threshold Ca2+ signals following the second Lstim of paired Lstim–Lstim. Alternatively, the ARP could also be due to desensitization of nAChRs and/or temporal modifications of the vesicle-fusion machinery.
In the ChI pathway, the cholinergic terminal in eqn (1) is the presynaptic component, while the DA terminal is the postsynaptic component. Although the complex synapse as a whole did not follow the classical law of the single-terminal synapse (eqn (3), the DA terminal itself did follow this law. When the DA terminal was examined in terms of the PPR made by paired Lstim–Estim (Fig.5), the vesicle pool replenishment had a single classical component (τDT = 15 s). Immediately after the first non-classical replenishment component ARP (TARP = 1 s), the second replenishment component of ChI-driven DA release fitted the classical law (eqn (3) for single-vesicle pool replenishment (τChID = 21 s, see Fig.4B). According to eqn (1), after the ARP, the recovery time constant of the ChI-driven DA release would be determined by the DA terminal, S(t) = Sb(t), or τChID = τDT. In fact, the τChID (21 s) was slightly slower but close to τDT (15 s).
Thus, the replenishment of the DA terminal has a single classical component (τDT), while the replenishment of the ‘complex terminal’ has a non-classical component (TARP) followed by a classical component (τChID, Fig.6B). Note that although here we used the hypothesis of vesicle pool replenishment to quantitatively interpret our PPR data about recovery of transmitter release, the recovery of release can also be due to mechanisms other than replenishment of the pool.
Physiological relevance of synaptic terminal–terminal transmission
In the striatum, to conduct DA-dependent behavioural tasks under physiological conditions, DA release can be triggered by any of three modes: (i) the ascending pathway via the nigrostriatal projection, (ii) the ChI pathway via cholinergic terminal–dopaminergic terminal transmission, or (iii) both pathways. Different modes of DA release may act differently in behavioural tasks. The timing of DA release may produce behavioural outputs such as cocaine self-administration (a latency of 1–3 s for DA release preceding action (Phillips et al. 2003)) and food seeking (a latency of 0.2 s for DA release preceding action (Roitman et al. 2004)).
Temporally precise DA neuronal signalling codes reward prediction error, and drives reward-related learning (Schultz et al. 1997; Steinberg et al. 2013). The control of corticostriatal synaptic plasticity is thought to be an important mechanism underlying this process (Reynolds et al. 2001; Surmeier et al. 2007). Furthermore, it is well known that the critical time window to form LTP or LTD is about ±50 ms (Caporale & Dan, 2008). The timing of presynaptic and postsynaptic firing determines the direction of the synaptic plasticity (spike-timing-dependent plasticity, STDP) (Markram et al. 1997; Caporale & Dan, 2008). For example, postsynaptic firing with a 10 ms delay after presynaptic firing (Δt = 10 ms) normally induces LTP, whereas the reverse order of firing (Δt = −10 ms) induces LTD. In many brain regions, including the striatum, DA controls the induction of STDP and even reverses it (i.e. LTP at Δt = −10 ms) (Pawlak & Kerr, 2008; Shen et al. 2008; Zhang et al. 2009), implying that precise DA signalling is essential for determining synaptic plasticity, and for learning and memory. In the present work, we demonstrated that the temporal components within a single case of DA synaptic transmission are ∼10 or ∼20 ms, both of which are within the critical time window. Although the exact temporal relationship between the DA signal and LTP/LTD formation is unclear, the temporal components of synaptic transmission via both the nigrostriatal and the ChI pathways will be helpful to reveal the relationship in future studies.
This work was mainly carried out at room temperature. The transmitter release and vesicle pool replenishment would be faster at physiological temperature (Sabatini & Regehr, 1996). Therefore, we studied the correlation of the latency of ChI-driven DA release vs. temperature. The latency of Iamp(Lstim) was reduced as the temperature was increased, suggesting that the ChI-driven DA release is faster at a near-physiological temperature than at room temperature (Fig.3H and I).
We have discovered distinct timing features for both release latency and replenishment of the ChI pathway, which may impact DA-dependent circuits and thus be relevant to DA-related behaviours such as smoke seeking.
Acknowledgments
We thank Drs Guoping Feng and Minmin Luo for providing ChAT-ChR2-EYFP mice and help, and Drs Luyang Wang and Iain C. Bruce for comments on the manuscript.
Glossary
- ACh
acetylcholine
- ACSF
artificial cerebrospinal fluid
- AP
action potential
- ARP
absolute refractory period
- BSA
bovine serum albumin
- CFE
carbon-fibre electrode
- ChAT
choline acetyltransferase
- ChI
cholinergic interneuron
- DA
dopamine
- EPSC
excitatory postsynaptic current
- FCV
fast cyclic voltammetry
- LTD
long-term depression
- LTP
long-term potentiation
- nAChR
nicotinic acetylcholine receptor
- PPR
paired pulse ratio
- SNc
substantia nigra pars compacta
- STDP
spike-timing-dependent plasticity
- VAChT
vesicular ACh transporter
Key points
The timing of synaptic transmission is critical to synaptic plasticity in the striatum.
However, the timing of striatal dopamine (DA) release induced by cholinergic interneurons (ChIs) in the striatum is unclear.
In this study, we focused on the temporal components of DA release and replenishment triggered by different pathways.
We show that stimulation of ChIs induces DA release with a total delay of 20.6 ms, including 2.8 ms for action potential firing of ChIs, 7.0 ms for cholinergic transmission between acetylcholine terminals and DA terminals, and 10.8 ms for downstream DA release. The delay of DA release via this ChI pathway is 1.9 times that via the nigrostriatal pathways.
We describe the time course of recovery of DA release via the two pathways and that of vesicle replenishment in DA terminals.
Our work provides an example of unravelling the temporal building blocks during fundamental synaptic terminal–terminal transmission.
Additional information
Competing interests
The authors declare no competing interests.
Author contributions
L.W., X.Z., H.X., L.Z., R.J., W.L., F.Z., X.K., B.L., S.T., Q.W., M.L., H.D., P.Z., C.W. and S.W. carried out the experiments. Z.Z. and L.W. planned the work and wrote the paper.
Funding
This work was supported by grants from the National Basic Research Program of China (2012CB518006), the National Natural Science Foundation of China (31228010, 31171026, 31100597, 31327901, 31221002 and 31330024), the National Key Technology R&D Program (SQ2011SF11B01041) and a ‘985’ grant from the Department of Education of China.
References
- Arbuthnott GW. Wickens J. Space, time and dopamine. Trends Neurosci. 2007;30:62–69. doi: 10.1016/j.tins.2006.12.003. [DOI] [PubMed] [Google Scholar]
- Augustine G, Charlton M. Smith S. Calcium entry and transmitter release at voltage-clamped nerve terminals of squid. J Physiol. 1985;367:163–181. doi: 10.1113/jphysiol.1985.sp015819. [DOI] [PMC free article] [PubMed] [Google Scholar]
- Augustine GJ, Charlton MP. Smith SJ. Calcium action in synaptic transmitter release. Ann Rev Neurosci. 1987;10:633–693. doi: 10.1146/annurev.ne.10.030187.003221. [DOI] [PubMed] [Google Scholar]
- Betz WJ. Depression of transmitter release at the neuromuscular junction of the frog. J Physiol. 1970;206:629–644. doi: 10.1113/jphysiol.1970.sp009034. [DOI] [PMC free article] [PubMed] [Google Scholar]
- Boyden ES, Zhang F, Bamberg E, Nagel G. Deisseroth K. Millisecond-timescale, genetically targeted optical control of neural activity. Nat Neurosci. 2005;8:1263–1268. doi: 10.1038/nn1525. [DOI] [PubMed] [Google Scholar]
- Bruns D. Jahn R. Real-time measurement of transmitter release from single synaptic vesicles. Nature. 1995;377:62–65. doi: 10.1038/377062a0. [DOI] [PubMed] [Google Scholar]
- Cachope R, Mateo Y, Mathur BN, Irving J, Wang HL, Morales M, Lovinger DM. Cheer JF. Selective activation of cholinergic interneurons enhances accumbal phasic dopamine release: setting the tone for reward processing. Cell Rep. 2012;2:33–41. doi: 10.1016/j.celrep.2012.05.011. [DOI] [PMC free article] [PubMed] [Google Scholar]
- Caporale N. Dan Y. Spike timing-dependent plasticity: a Hebbian learning rule. Ann Rev Neurosci. 2008;31:25–46. doi: 10.1146/annurev.neuro.31.060407.125639. [DOI] [PubMed] [Google Scholar]
- Chen XK, Wang LC, Zhou Y, Cai Q, Prakriya M, Duan KL, Sheng ZH, Lingle C. Zhou Z. Activation of GPCRs modulates quantal size in chromaffin cells through Gβγ and PKC. Nat Neurosci. 2005;8:1160–1168. doi: 10.1038/nn1529. [DOI] [PubMed] [Google Scholar]
- Chow RH, von Ruden L. Neher E. Delay in vesicle fusion revealed by electrochemical monitoring of single secretory events in adrenal chromaffin cells. Nature. 1992;356:60–63. doi: 10.1038/356060a0. [DOI] [PubMed] [Google Scholar]
- Cragg SJ. Variable dopamine release probability and short-term plasticity between functional domains of the primate striatum. J Neurosci. 2003;23:4378–4385. doi: 10.1523/JNEUROSCI.23-10-04378.2003. [DOI] [PMC free article] [PubMed] [Google Scholar]
- Dan Y. Poo MM. Spike timing-dependent plasticity: from synapse to perception. Physiol Rev. 2006;86:1033–1048. doi: 10.1152/physrev.00030.2005. [DOI] [PubMed] [Google Scholar]
- Dani JA. Bertrand D. Nicotinic acetylcholine receptors and nicotinic cholinergic mechanisms of the central nervous system. Ann Rev Pharmacol Toxicol. 2007;47:699–729. doi: 10.1146/annurev.pharmtox.47.120505.105214. [DOI] [PubMed] [Google Scholar]
- Descarries L, Gisiger V. Steriade M. Diffuse transmission by acetylcholine in the CNS. Prog Neurobiol. 1997;53:603–625. doi: 10.1016/s0301-0082(97)00050-6. [DOI] [PubMed] [Google Scholar]
- Descarries L. Mechawar N. Ultrastructural evidence for diffuse transmission by monoamine and acetylcholine neurons of the central nervous system. Prog Brain Res. 2000;125:27–47. doi: 10.1016/S0079-6123(00)25005-X. [DOI] [PubMed] [Google Scholar]
- Dittman JS. Regehr WG. Calcium dependence and recovery kinetics of presynaptic depression at the climbing fibre to Purkinje cell synapse. J Neurosci. 1998;18:6147–6162. doi: 10.1523/JNEUROSCI.18-16-06147.1998. [DOI] [PMC free article] [PubMed] [Google Scholar]
- Elmqvist D. Quastel DM. A quantitative study of end-plate potentials in isolated human muscle. J Physiol. 1965;178:505–529. doi: 10.1113/jphysiol.1965.sp007639. [DOI] [PMC free article] [PubMed] [Google Scholar]
- Enomoto K. Post-and presynaptic effects of vesamicol (AH5183) on the frog neuromuscular junction. Eur J Pharmacol. 1988;147:209–215. doi: 10.1016/0014-2999(88)90779-0. [DOI] [PubMed] [Google Scholar]
- Huang HP, Wang SR, Yao W, Zhang C, Zhou Y, Chen XW, Zhang B, Xiong W, Wang LY, Zheng LH, Landry M, Hokfelt T, Xu ZQ. Zhou Z. Long latency of evoked quantal transmitter release from somata of locus coeruleus neurons in rat pontine slices. Proc Natl Acad Sci U S A. 2007;104:1401–1406. doi: 10.1073/pnas.0608897104. [DOI] [PMC free article] [PubMed] [Google Scholar]
- Kandel ER, Schwartz JH. Jessell TM. Principles of Neural Science. New York: McGraw-Hill; 2000. Vol. 4. [Google Scholar]
- Katz B. The Release of Neural Transmitter Substances. Liverpool: Liverpool University Press; 1969. [Google Scholar]
- Katz B. Miledi R. The measurement of synaptic delay, and the time course of acetylcholine release at the neuromuscular junction. Proc R Soc Lond B Biol Sci. 1965;161:483–495. doi: 10.1098/rspb.1965.0016. [DOI] [PubMed] [Google Scholar]
- Kolisnyk B, Guzman MS, Raulic S, Fan J, Magalhaes AC, Feng G, Gros R, Prado VF. Prado MA. ChAT-ChR2-EYFP mice have enhanced motor endurance but show deficits in attention and several additional cognitive domains. J Neurosci. 2013;33:10427–10438. doi: 10.1523/JNEUROSCI.0395-13.2013. [DOI] [PMC free article] [PubMed] [Google Scholar]
- Kusano K. Landau EM. Depression and recovery of transmission at the squid giant synapse. J Physiol. 1975;245:13–32. doi: 10.1113/jphysiol.1975.sp010832. [DOI] [PMC free article] [PubMed] [Google Scholar]
- Liu T, Shang SJ, Liu B, Wang CH, Wang YS, Xiong W, Zheng LH, Zhang CX. Zhou Z. Two distinct vesicle pools for depolarization-induced exocytosis in somata of dorsal root ganglion neurons. J Physiol. 2011;589:3507–3515. doi: 10.1113/jphysiol.2011.208777. [DOI] [PMC free article] [PubMed] [Google Scholar]
- Lupa MT. Effects of an inhibitor of the synaptic vesicle acetylcholine transport system on quantal neurotransmitter release: an electrophysiological study. Brain Res. 1988;461:118–126. doi: 10.1016/0006-8993(88)90730-5. [DOI] [PubMed] [Google Scholar]
- Markram H, Lubke J, Frotscher M. Sakmann B. Regulation of synaptic efficacy by coincidence of postsynaptic APs and EPSPs. Science. 1997;275:213–215. doi: 10.1126/science.275.5297.213. [DOI] [PubMed] [Google Scholar]
- Neher E. Sakaba T. Multiple roles of calcium ions in the regulation of neurotransmitter release. Neuron. 2008;59:861–872. doi: 10.1016/j.neuron.2008.08.019. [DOI] [PubMed] [Google Scholar]
- Nicola SM, Surmeier J. Malenka RC. Dopaminergic modulation of neuronal excitability in the striatum and nucleus accumbens. Ann Rev Neurosci. 2000;23:185–215. doi: 10.1146/annurev.neuro.23.1.185. [DOI] [PubMed] [Google Scholar]
- Otsuka M, Endo M. Nonomura Y. Presynaptic nature of neuromuscular depression. Jpn J Physiol. 1962;12:573–584. doi: 10.2170/jjphysiol.12.573. [DOI] [PubMed] [Google Scholar]
- Pan B. Zucker RS. A general model of synaptic transmission and short-term plasticity. Neuron. 2009;62:539–554. doi: 10.1016/j.neuron.2009.03.025. [DOI] [PMC free article] [PubMed] [Google Scholar]
- Pawlak V. Kerr JN. Dopamine receptor activation is required for corticostriatal spike-timing-dependent plasticity. J Neurosci. 2008;28:2435–2446. doi: 10.1523/JNEUROSCI.4402-07.2008. [DOI] [PMC free article] [PubMed] [Google Scholar]
- Phelps PE, Houser CR. Vaughn JE. Immunocytochemical localization of choline acetyltransferase within the rat neostriatum: a correlated light and electron microscopic study of cholinergic neurons and synapses. J Comp Neurol. 1985;238:286–307. doi: 10.1002/cne.902380305. [DOI] [PubMed] [Google Scholar]
- Phillips PE, Stuber GD, Heien ML, Wightman RM. Carelli RM. Subsecond dopamine release promotes cocaine seeking. Nature. 2003;422:614–618. doi: 10.1038/nature01476. [DOI] [PubMed] [Google Scholar]
- Ren J, Qin C, Hu F, Tan J, Qiu L, Zhao S, Feng G. Luo M. Habenula ‘cholinergic’ neurons co-release glutamate and acetylcholine and activate postsynaptic neurons via distinct transmission modes. Neuron. 2011;69:445–452. doi: 10.1016/j.neuron.2010.12.038. [DOI] [PubMed] [Google Scholar]
- Reynolds JN, Hyland BI. Wickens JR. A cellular mechanism of reward-related learning. Nature. 2001;413:67–70. doi: 10.1038/35092560. [DOI] [PubMed] [Google Scholar]
- Rice ME. Cragg SJ. Nicotine amplifies reward-related dopamine signals in striatum. Nat Neurosci. 2004;7:583–584. doi: 10.1038/nn1244. [DOI] [PubMed] [Google Scholar]
- Rizzoli SO. Betz WJ. Synaptic vesicle pools. Nat Rev Neurosci. 2005;6:57–69. doi: 10.1038/nrn1583. [DOI] [PubMed] [Google Scholar]
- Roitman MF, Stuber GD, Phillips PE, Wightman RM. Carelli RM. Dopamine operates as a subsecond modulator of food seeking. J Neurosci. 2004;24:1265–1271. doi: 10.1523/JNEUROSCI.3823-03.2004. [DOI] [PMC free article] [PubMed] [Google Scholar]
- Sabatini BL. Regehr WG. Timing of neurotransmission at fast synapses in the mammalian brain. Nature. 1996;384:170–172. doi: 10.1038/384170a0. [DOI] [PubMed] [Google Scholar]
- Sabatini BL. Regehr WG. Timing of synaptic transmission. Ann Rev Physiol. 1999;61:521–542. doi: 10.1146/annurev.physiol.61.1.521. [DOI] [PubMed] [Google Scholar]
- Schmitz Y, Schmauss C. Sulzer D. Altered dopamine release and uptake kinetics in mice lacking D2 receptors. J Neurosci. 2002;22:8002–8009. doi: 10.1523/JNEUROSCI.22-18-08002.2002. [DOI] [PMC free article] [PubMed] [Google Scholar]
- Schultz W. Multiple dopamine functions at different time courses. Ann Rev Neurosci. 2007;30:259–288. doi: 10.1146/annurev.neuro.28.061604.135722. [DOI] [PubMed] [Google Scholar]
- Schultz W, Dayan P. Montague PR. A neural substrate of prediction and reward. Science. 1997;275:1593–1599. doi: 10.1126/science.275.5306.1593. [DOI] [PubMed] [Google Scholar]
- Shen W, Flajolet M, Greengard P. Surmeier DJ. Dichotomous dopaminergic control of striatal synaptic plasticity. Science. 2008;321:848–851. doi: 10.1126/science.1160575. [DOI] [PMC free article] [PubMed] [Google Scholar]
- Sorensen JB, Nagy G, Varoqueaux F, Nehring RB, Brose N, Wilson MC. Neher E. Differential control of the releasable vesicle pools by SNAP-25 splice variants and SNAP-23. Cell. 2003;114:75–86. doi: 10.1016/s0092-8674(03)00477-x. [DOI] [PubMed] [Google Scholar]
- Steinberg EE, Keiflin R, Boivin JR, Witten IB, Deisseroth K. Janak PH. A causal link between prediction errors, dopamine neurons and learning. Nat Neurosci. 2013;16:966–973. doi: 10.1038/nn.3413. [DOI] [PMC free article] [PubMed] [Google Scholar]
- Sudhof TC. The synaptic vesicle cycle. Ann Rev Neurosci. 2004;27:509–547. doi: 10.1146/annurev.neuro.26.041002.131412. [DOI] [PubMed] [Google Scholar]
- Surmeier DJ, Ding J, Day M, Wang Z. Shen W. D1 and D2 dopamine-receptor modulation of striatal glutamatergic signalling in striatal medium spiny neurons. Trends Neurosci. 2007;30:228–235. doi: 10.1016/j.tins.2007.03.008. [DOI] [PubMed] [Google Scholar]
- Threlfell S, Lalic T, Platt NJ, Jennings KA, Deisseroth K. Cragg SJ. Striatal dopamine release is triggered by synchronized activity in cholinergic interneurons. Neuron. 2012;75:58–64. doi: 10.1016/j.neuron.2012.04.038. [DOI] [PubMed] [Google Scholar]
- Wainer BH, Bolam JP, Freund TF, Henderson Z, Totterdell S. Smith AD. Cholinergic synapses in the rat brain: a correlated light and electron microscopic immunohistochemical study employing a monoclonal antibody against choline acetyltransferase. Brain Res. 1984;308:69–76. doi: 10.1016/0006-8993(84)90918-1. [DOI] [PubMed] [Google Scholar]
- Wang L, Shang SJ, Zheng LH. Zhou Z. Neuroscience 2013. San Diego, CA: Society for Neuroscience; 2013. Temporal components of a synaptic terminal–terminal transmission in dorsal striatum slices. [Google Scholar]
- Wang SR, Yao W, Huang HP, Zhang B, Zuo PL, Sun L, Dou HQ, Li Q, Kang XJ, Xu HD, Hu MQ, Jin M, Zhang L, Mu Y, Peng JY, Zhang CX, Ding JP, Li BM. Zhou Z. Role of vesicle pools in action potential pattern-dependent dopamine overflow in rat striatum in vivo. J Neurochem. 2011;119:342–353. doi: 10.1111/j.1471-4159.2011.07440.x. [DOI] [PubMed] [Google Scholar]
- Wightman RM. Detection technologies. Probing cellular chemistry in biological systems with microelectrodes. Science. 2006;311:1570–1574. doi: 10.1126/science.1120027. [DOI] [PubMed] [Google Scholar]
- Wightman RM, Jankowski JA, Kennedy RT, Kawagoe KT, Schroeder TJ, Leszczyszyn DJ, Near JA, Diliberto EJ., Jr Viveros OH. Temporally resolved catecholamine spikes correspond to single vesicle release from individual chromaffin cells. Proc Natl Acad Sci U S A. 1991;88:10754–10758. doi: 10.1073/pnas.88.23.10754. [DOI] [PMC free article] [PubMed] [Google Scholar]
- Wu LG. Kinetic regulation of vesicle endocytosis at synapses. Trends Neurosci. 2004;27:548–554. doi: 10.1016/j.tins.2004.07.001. [DOI] [PubMed] [Google Scholar]
- Zhang B, Sun L, Yang YM, Huang HP, Zhu FP, Wang L, Zhang XY, Guo S, Zuo PL, Zhang CX, Ding JP, Wang LY. Zhou Z. Action potential bursts enhance transmitter release at a giant central synapse. J Physiol. 2011;589:2213–2227. doi: 10.1113/jphysiol.2010.200154. [DOI] [PMC free article] [PubMed] [Google Scholar]
- Zhang B, Zhang XY, Luo PF, Huang W, Zhu FP, Liu T, Du YR, Wu QH, Lu J, Xiu Y, Liu LN, Huang HP, Guo S, Zheng H, Zhang CX. Zhou Z. Action potential-triggered somatic exocytosis in mesencephalic trigeminal nucleus neurons in rat brain slices. J Physiol. 2012;590:753–762. doi: 10.1113/jphysiol.2011.221051. [DOI] [PMC free article] [PubMed] [Google Scholar]
- Zhang H. Sulzer D. Frequency-dependent modulation of dopamine release by nicotine. Nat Neurosci. 2004;7:581–582. doi: 10.1038/nn1243. [DOI] [PubMed] [Google Scholar]
- Zhang JC, Lau PM. Bi GQ. Gain in sensitivity and loss in temporal contrast of STDP by dopaminergic modulation at hippocampal synapses. Proc Natl Acad Sci U S A. 2009;106:13028–13033. doi: 10.1073/pnas.0900546106. [DOI] [PMC free article] [PubMed] [Google Scholar]
- Zhao S, Ting JT, Atallah HE, Qiu L, Tan J, Gloss B, Augustine GJ, Deisseroth K, Luo M, Graybiel AM. Feng G. Cell type-specific channelrhodopsin-2 transgenic mice for optogenetic dissection of neural circuitry function. Nat Methods. 2011;8:745–752. doi: 10.1038/nmeth.1668. [DOI] [PMC free article] [PubMed] [Google Scholar]
- Zhou FM, Liang Y. Dani JA. Endogenous nicotinic cholinergic activity regulates dopamine release in the striatum. Nat Neurosci. 2001;4:1224–1229. doi: 10.1038/nn769. [DOI] [PubMed] [Google Scholar]
- Zhou Z. Misler S. Action potential-induced quantal secretion of catecholamines from rat adrenal chromaffin cells. J Biol Chem. 1995;270:3498–3505. [PubMed] [Google Scholar]
- Zhou Z. Neher E. Calcium permeability of nicotinic acetylcholine receptor channels in bovine adrenal chromaffin cells. Pflugers Arch. 1993;425:511–517. doi: 10.1007/BF00374879. [DOI] [PubMed] [Google Scholar]