SUMMARY
In conventional multi-probe fluorescence microscopy, narrow bandwidth filters on detectors are used to avoid bleed-through artifacts between probes. The limited bandwidth reduces the signal-to-noise ratio (SNR) of the detection, often severely compromising one or more channels. Herein, we describe a process of using independent component analysis (ICA) to discriminate the position of different probes using only a dichroic mirror to differentiate the signals directed to the detectors. ICA was particularly effective in samples where the spatial overlap between the probes is minimal, a very common case in cellular microscopy. This imaging scheme collects nearly all of the emitted light, significantly improving the image SNR. In this study, we focused on the detection of two fluorescence probes used in vivo, NAD(P)H and ANEPPS. The optimal dichroic mirror cutoff frequency was determined with simulations using the probes spectral emissions. A quality factor, defined as the cross-channel contrast-to-noise ratio, was optimized to maximize signals while maintaining spatial discrimination between the probes after ICA post-processing. Simulations indicate that a ~3 fold increase in SNR using the ICA approach can be achieved over the conventional narrow-band filtering approach without loss of spatial discrimination. We confirmed this predicted performance from experimental imaging of NAD(P)H and ANEPPS in mouse skeletal muscle,in vivo. For many multi-probe studies, the increased sensitivity of this “full bandwidth” approach will lead to improved image quality and/or reduced excitation power requirements.
INTRODUCTION
Simultaneous monitoring of different fluorescence probes is an important tool in fluorescence microscopy. Spatial discrimination of different probes can be resolved based on the frequency of excitation or emission (Zimmermann et al., 2003) as well as the fluorescence lifetime of the probes (Gratton et al., 2003, Neher & Neher, 2004). The most popular, and easiest, method of resolving probes is to use discriminating characteristics of the emission spectra. This is usually accomplished by combinations of dichroic mirrors and band-pass filters to only detect light from one of the probes per photo-detection system. However, this approach generally reduces the photon efficiency of detection since many frequencies of light are discarded in the regions where the spectral energy of the emissions overlap and the efficiencies of each filter reduce the overall efficiency of detection. Given the limited Stokes shifts of many of the probes used in fluorescence microscopy, elimination of the spectral overlap regions can lead to significant reductions in signal to noise ratio (SNR). To compensate for this loss, the excitation power must be increased which can cause dye bleaching and/or photo-damage. As a result, optimizing SNR is often a major challenge in fluorescence imaging. Another solution is to collect the entire emission spectrum and de-convolve the individual spectra using a variety of approaches (Zimmermann et al., 2003, Zimmermann, 2005, Neher & Neher, 2004, Neher et al., 2009, Keshava & Mustard, 2002). In theory, all of the light emitted could be used for this spectral de-convolution. However, the photon detection efficiency of any spectrally resolved detection system is very low compared to that of single detector systems thereby compromising SNR. This loss of SNR with spectrally resolved systems is due to the intrinsic loss of light in gratings, prisms or filters used to separate the frequencies of light for independent detection. Thus, an ideal system would permit the collection of all the emitted light in an efficient manner while minimally compromising the ability to resolve the spatial distribution of the probes.
To improve the SNR of multi-fluorescence probe analysis, we looked for methods where most of the light could be collected with minimal frequency encoding. Previous quantitative studies had suggested that minimal frequency encoding can still be effective in discriminating probe however; the region of spectral overlap could compromise performance with a minimal channels detection scheme (Neher & Neher, 2004). For the discrimination of two probes, the most efficient and minimally frequency encoding detection method is obtained with a single dichroic mirror where the light losses are minimal. The cutoff wavelength of the dichroic mirror can be optimized to discriminate the two probes if their emission spectra are known. In surveying methods to process this simply encoded data, we found that Independent Component Analysis (ICA) statistical approaches are very effective in unmixing the frequency encoded signals provided there is minimal spatial co-localization between the probes (Hyvarinen, 2013). We emphasize that this approach does not require prior knowledge of the probes emission spectra, although this information is used in designing the cutoff wavelength of the dichroic mirror. This is different from the linear spectral unmixing (LSU) method commonly used in microscopy which requires accurate a priori knowledge of the emission spectra (Zimmermann et al., 2014). This is a significant limitation of LSU since the probes emission spectra may differ in isolation from in-situ through quenching by other molecules and tissue inner filter effects. Recording the spectra in-situ in the microscope bypasses this issue but faces the difficulty of recording high SNR emission spectra due to the low photon efficiency of spectrally resolved systems and the spectrum can change during perturbations to the system.
The goal of this study is to evaluate the ability of ICA statistical methods to discriminate the location of two spatially distinct but spectrally overlapping fluorescent probes in tissue when imaged with a single optimized dichroic mirror (relative to the probes under study).The proposed approach is compared to the most commonly used conventional filter design, which excludes regions of spectral overlap between fluorophores. One of the major assumptions of this approach, that permitted the spatial discrimination of two probes with overlapping emission spectra, is that the probes do not significantly topologically overlap. This limits the application of this approach to conditions and probes where signals are spatially isolated relative to the resolution of the imaging experiment. We evaluated this procedure using mathematical simulations and with a specific application, in vivo. We selected the in vivo condition as our demonstration case since this preparation is significantly limited by SNR due to low probe concentration, limited ability to signal average and requires low excitation powers to prevent photo-damage (Lucotte & Balaban, 2014). This ICA based approach provided near optimal SNR characteristics by collecting almost all of the light, only limited by the efficiency of the dichroic mirror, while maintaining excellent spatial discrimination between the different probes.
MATERIALS AND METHODS
Animal Preparation
Spectral image datasets were scanned on 3–12 month old C57BL/6 mice according to an approved protocol reviewed by the NHLBI Animal Care and Use Committee. Mice were prepared for imaging as described recently (Glancy et al., 2013). Briefly, animals were intubated and anaesthetized through a ventilator with 2% isoflurane and 30% oxygen. The mouse was restrained on a temperature-controlled platform and fitted onto the microscope stage. Fur on the lower hind-limb was removed with a depilatory agent and the Tibialis anterior muscle was exposed by resecting the skin and gently abrading the top two layers of the myofascial collagen sheath. The exposed muscle was coupled to the microscope objective with an optical coupling gel (0.3% carbomer, 300 mM sorbitol, pH 7.4) with a refractive index similar to that of water. Di-8-ANEPPS (ANEPPS) was used as a vasculature dye and injected into the heparinized jugular vein until the fluorescent signal was sufficient to begin imaging. In the mouse studies, the two probes evaluated were the intrinsic mitochondrial NAD(P)H signal, likely originating from NAD(P)H resident in Complex1 (Blinova et al., 2008), and the ANEPPS signal in the vascular space. These probes meet the criteria for this approach since they have different spectral emission properties along with the fact that they do not spatially overlap in the tissue. These probes are useful combination to evaluate tissue metabolism, vascular structure and motion tracking, in vivo (Bakalar et al., 2012). For demonstration purposes a third dye, STYO-24 green, with an emission in the green between ANEPPS and NADH was infused. This probe was used to specifically label nuclei as previously described from our laboratory (Jobsis et al., 2007). As SYTO green emission is dependent on DNA binding, it was uniquely localized to the nuclei and appropriate for the ICA analysis.
Imaging Parameters
A Leica TCS SP5 II upright resonant scanning multi-photon microscope with a Nikon 25×, 1.1 NA water immersion objective was used throughout the entire experiment. The objective correction collar was optimized to compensate for the spherical aberrations induced by the small index mismatch between tissue and the optical coupling gel. This spherical aberration correction significantly improved the image quality and SNR. A Ti:sapphire laser (Spectra Physics, Mai tai) was tuned to 720 nm for two-photon excitation in the UV. All in vivo skeletal muscle images were captured at 0.68 µm isotropic resolution with 16 line averages. For each image, 512×512 pixels were collected with non-descanned detectors and an8 kHz resonant line scanning mirror.
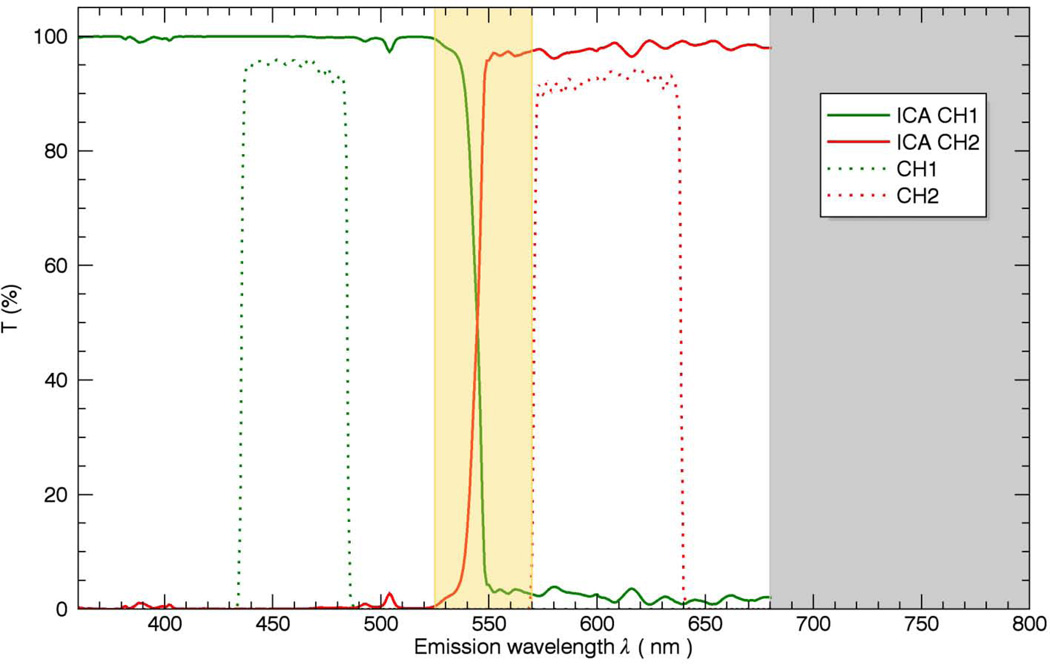
In conventional imaging, the NAD(P)H channel employs two dichroic mirrors with cutoff wavelengths at 510 nm and 409 nm (Semrock, FF510-Di02 and FF409-Di03, respectively), and a 50 nm wide band-pass filter centered at 460 nm (Chroma Technology, ET460/50M). The vasculature dye ANEPPS channel consists of two dichroic mirrors with cutoff wavelengths at 510 nm and 560 nm (SemrockFF510-Di02 and FF560-Di01, respectively) and a 70 nm wide band-pass filter centered at 605 nm (Chroma Technology, ET605/70M).In all experiments a primary dichroic mirror with a 670 nm cutoff wavelength (Leica, RSP670) was used to separate the excitation light from the emission light and a short-pass filter with a 680 nm cutoff wavelength (Leica, SP680)was employed to prevent the excitation light from reaching the detectors The 409 nm and 560 nm dichroic mirrors used in the conventional detection scheme are part of a 4 channels detection system which was not present when our single optimized 545 dichroic mirror was in place. The 409 nm and 560nm mirrors only attenuated light by ~3% within the channels detection bandwidth of the bandpass filters and no correction was applied to compensate for this loss. The NAD(P)H and ANEPPS channels are displayed in green and red, respectively, in all images.
In the three probe case the light reflected off of the 560 nm dichroic was used to detect the SYTO Green 24 emission. When indicated, a bandpass filter was applied before reaching the detector with a net bandwidth of 510–500nm to increase the specificity of this channel. Again, experiments were performed using the dichroic mirrors alone or with the bandpass filters to evaluate the effect of the ICA analysis. For continuity, the STYO Green signal is displayed in blue.
Emission Spectra Acquisition
A reference set of the emission characteristics of the NAD(P)H and ANEPPS probes, in vivo, was collected to aid in the evaluation of the dichroic mirror cutoff wavelength effects in a well-defined system. The emission spectra of each probe in mouse skeletal muscle in vivo were recorded in the microscope from 385 nm to 680 nm with a step-size of 10nm using 2-photon excitation at 720nm and detected with the Leica SP5 prism-based internal spectral detection system. This dataset is referred to as the reference spectral data set. It is important to note that this dataset is not fundamental to the ICA process, but is only used to determine the sensitivity of the process to the dichroic mirror cutoff wavelength for these probes.
THEORY
Emission Spectra Discrimination
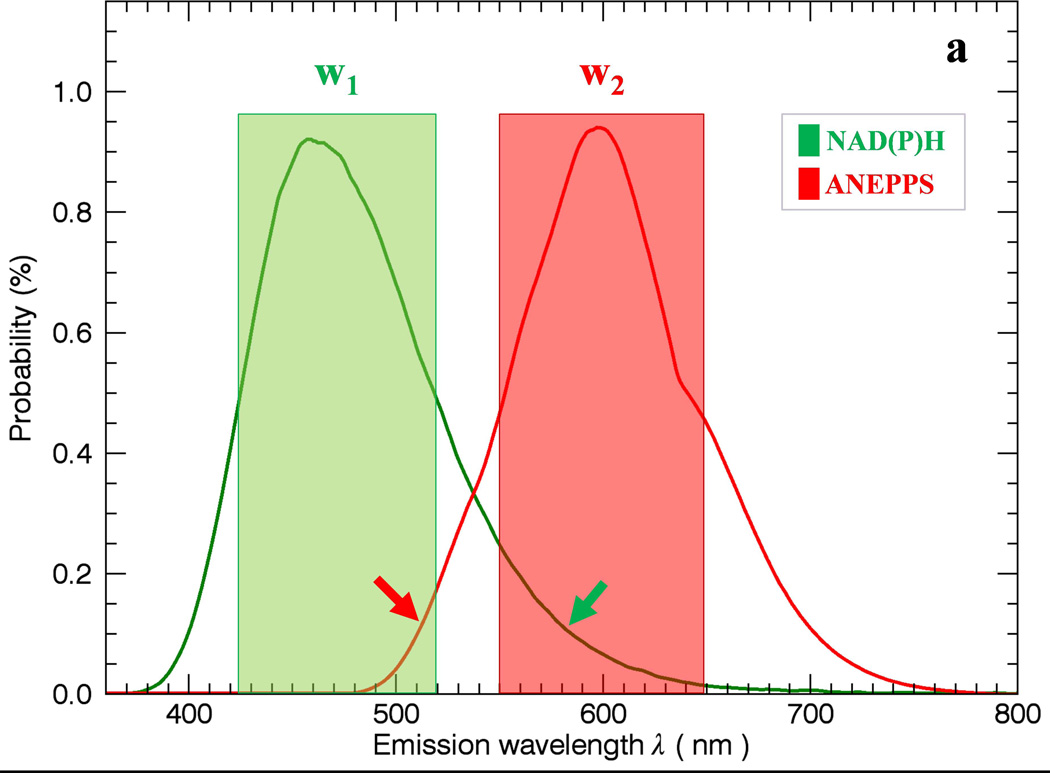
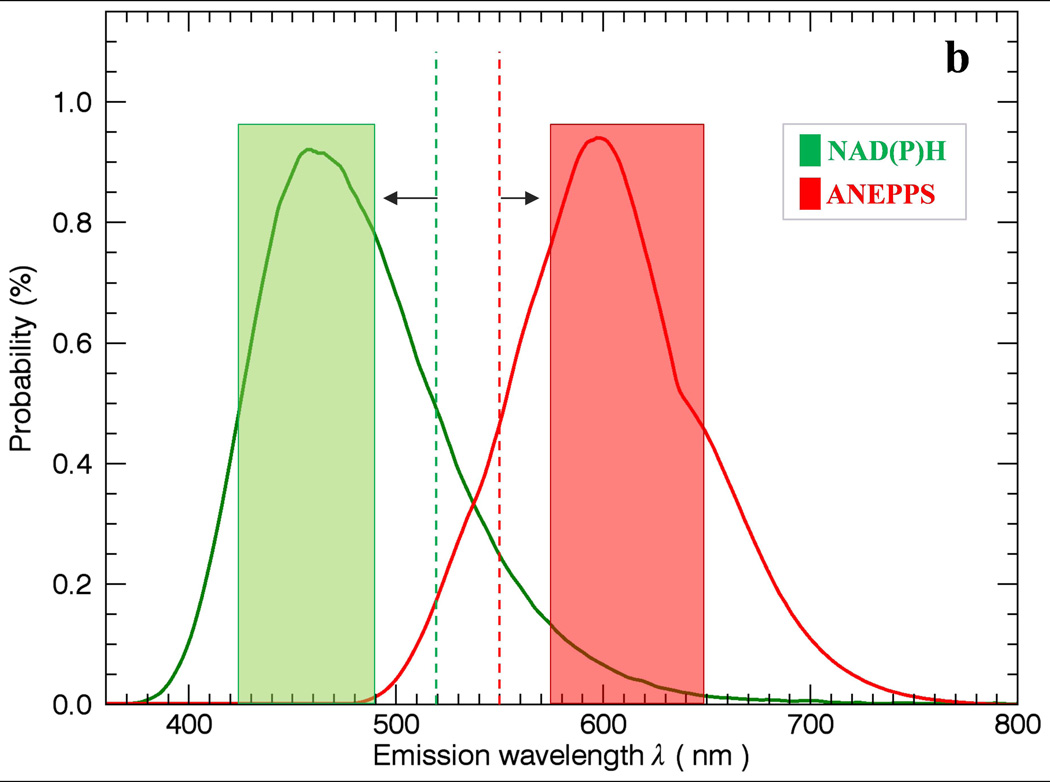
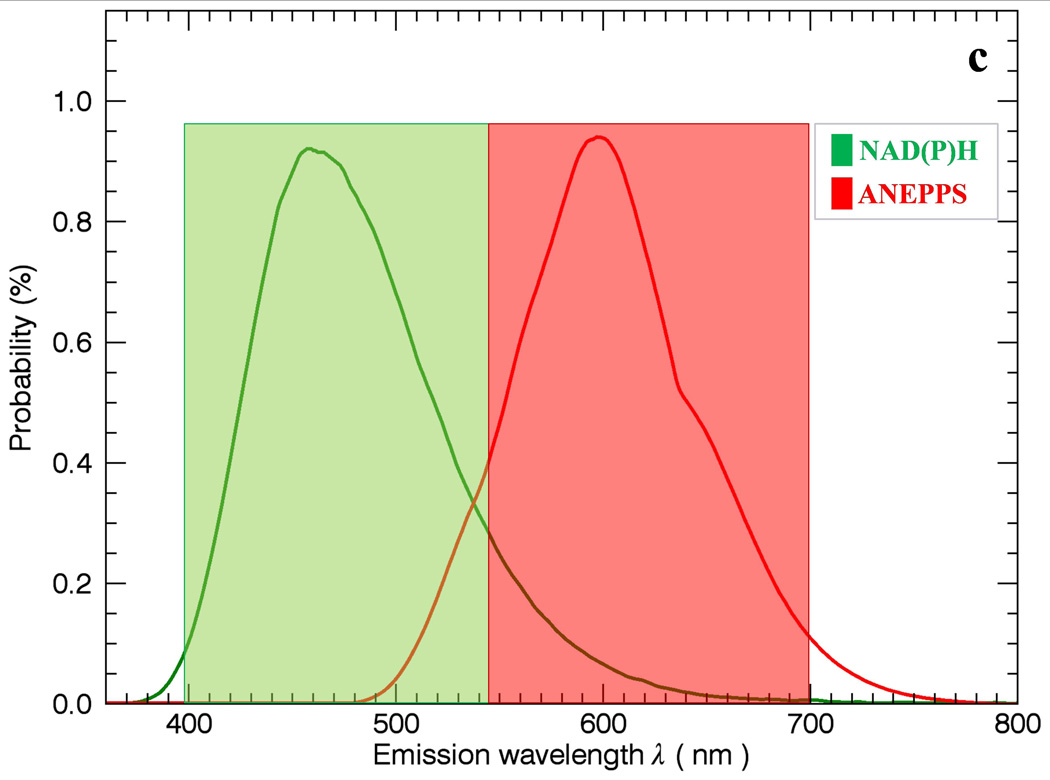
The general problem of using simple band-pass filters to discriminate different probes is outlined in Figure 1. In Figure 1a, two filter windows W1 and W2 are presented to collect the peak fluorescence bands of NAD(P)H and ANEPPS. Using this simple approach to optimize the signal collected results in overlap between the W1 and W2 windows resulting in imperfect discrimination of the signals. A common solution to this problem is to separate the collection windows further to reduce the overlap (Figure 1b) but this reduces the collection efficiency of the emitted photons and often still leaves overlap in the spectral densities. The intent of this study is to collect as much light as possible with a dichroic mirror segmenting the emission light into two broad emission bands (Figure 1c) including most of the emitted light, thereby optimizing the SNR, and using statistical unmixing methods to appropriately redistribute the different probe signals back to their respective channels.
Figure 1.
Independent Component Analysis
Independent component analysis (ICA) is a method for separating individual components from observed multidimensional data that are statistically independent from each other (Hyvarinen, 2013). Thus, ICA is an ideal method for determining the location of probes with minimal frequency information as long as the probes’ positions in the data do not significantly overlap. That is, spatial overlap can occur, and will be included in the final result, as long as the overlapped image features are not statistically significant within the entire image.
In general, the mixed signals, or the observations, as an example shown in Figure 1 can be expressed in forms:
| (1) |
where the variables a, b, c, and d represent the mixing weights of the source signals from each channel.
Equation (1) can be rewritten in matrix form as follows:
| (2) |
To obtain the inputs or the source signals, ICA statistical methods estimate the mixing matrix or the unmixing matrix (i.e., the inverse of the mixing matrix) from the observations. This process is called signal unmixing or signal separation. Assuming the unmixing matrix exists (det(Mixing Matrix)=ad−bc≠0) and the source signals are non-Gaussian, the solution with statistically independent component is unique. However, ICA does not have closed-form solutions, and an ordinary ICA method consists of two parts—an objective function (contrast function) and an optimization method. Because of the central limit theorem, the linear combination of two non-Gaussian distributed independent random variables is closer to a Gaussian distribution than either of the two random variables. Thus the ICA objective function typically measures the non-Gaussianity of the unmixed signals. The algorithm used in this study is based on the measure of entropy, various other metrics have also been proposed (Hyvarinen & Oja, 2000). From information theory it can be shown that the entropy H(ygauss) of a Gaussian distributed random variable ygauss is maximized. The negentropy metric J(y) of a random variable y, related to the entropy by J(y) = H(ygauss) − H(y), is therefore minimized and equal to zero for a Gaussian distributed random variable. The joint maximization of the negentropy of the unmixed variables therefore converges to new variables that are statistically as independent as possible. The fast ICA algorithm (Hyvarinen, 1999) used in this study maximizes an approximation of the negentropy (Hyvarinen, 1998) that is computationally more efficient than its exact definition, with an iterative optimization method based on the Newton method. The Fast ICA algorithm was applied estimating all independent components at the same time using a symmetric de-correlation approach; the one-by-on hierarchical decorrelation (deflation) was slower and did not improve the outcome. The contrast function used was the common cubic function (g(y)=y3) other contrast functions (including g(y)= y2 or y exp(−y2/2) or tanh(y)) provided no advantages over the cubic form. It is important to note that the Fast ICA algorithm used here does not include an image noise model and therefore assumes noise-free images. Consequently a Poisson noise removal procedure (Le et al., 2013) was applied to the raw images to attenuate the photon shot noise prior to ICA processing. The ICA routine used here is available as a Image J Plug in at our laboratory web page (to be added in proof).
Dichroic Mirror Cutoff Wavelength Optimization
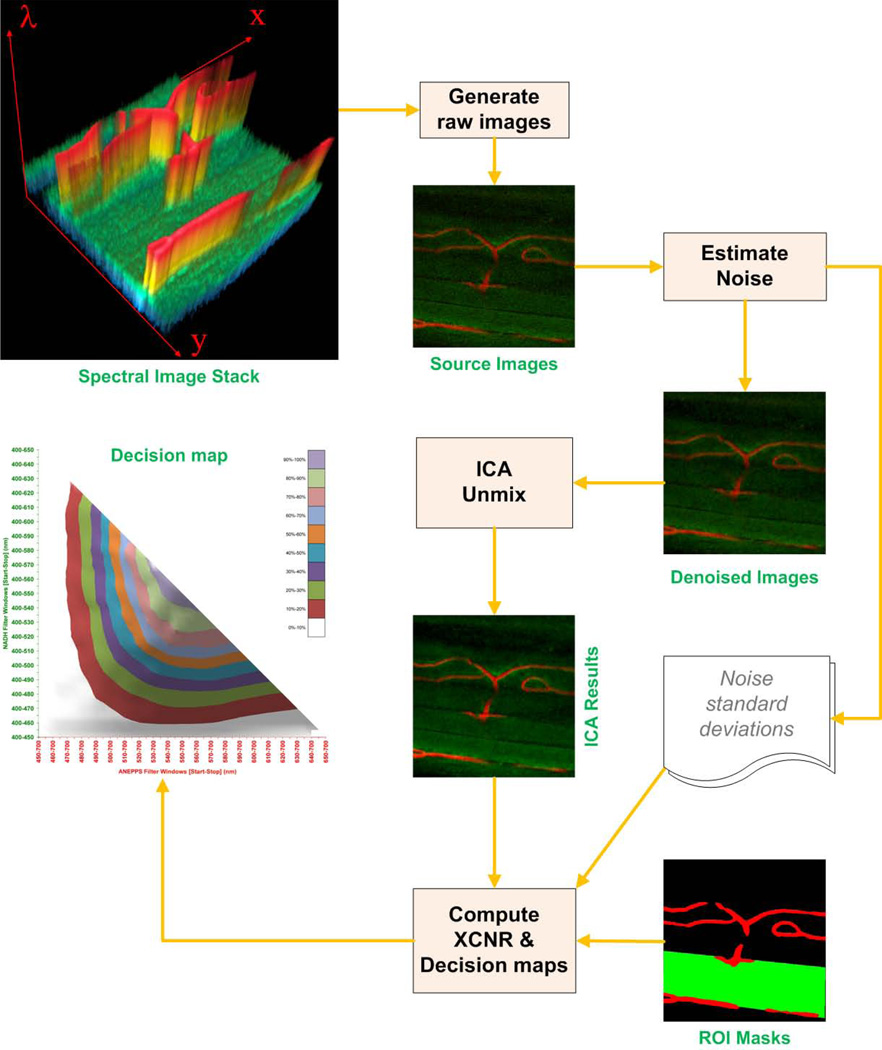
It was evident that the cutoff wavelength of the dichroic mirror would influence the ability of ICA to unmix the two fluorescence signals. We devised an analysis scheme to optimize the cutoff frequency for the muscle NAD(P)H and vascular ANEPPS signals. This was conducted not only to find the optima but to evaluate how critical the cutoff wavelength was in successfully applying the ICA approach. We reasoned that the bandwidth of the “optimal” cutoff frequency would reveal how critical the dichroic cutoff frequency was to the ICA process as well as how robust the process might be to slight alterations on the spectral characteristics of the probes or characteristic of the dichroic mirror. This optimization process is illustrated in Figure 2 using the 10 nm resolved in vivo emission spectra as the reference spectral data set. To accomplish this task, we manually defined regions of interest (ROI) that consisted exclusively of NAD(P)H and ANEPPS. As shown in Figure 2, these ROI masks confirmed that ANEPPS was restricted to the vessels while NAD(P)H was selectively located in the muscle cells. The merit figure used in this optimization is the cross-channel contrast to noise ratio (XCNR), which will be defined shortly, between the probes ROI’s.
Figure 2.
To evaluate the effect of different dichroic cutoffs, multiple image stacks were created from the spectral reference dataset using the following equation:
| (3) |
Here (↓1 and (↓2 define the lower and upper wavelengths limits of the bandwidth for each virtual channel image, respectively. To assure an adequate signal level, the simulated bandwidth of either channel was maintained at least 50 nm wide between the 400 nm and 680nm. The cutoff wavelength of the dichroic filter was then simulated from 450nm to 650nm within the sampled spectral window.
Prior to the ICA unmixing, each image was processed by a Poison noise removal procedure (Le et al., 2013) to obtain a denoised image for all different bandwidths. The pseudo-noise image was formed by subtraction of the raw image from the de-noised image. The standard deviation was calculated from the pseudo-noise image masked by corresponding predefined ROI. The resulting denoised images were then processed with the ICA algorithm for signal unmixing.
After the ICA process, the mean signal of the NAD(P)H and ANEPPSROI masks were computed for both the intended and unintended channels. Signal in the ROI of the unintended channel was termed cross-over signal. Thus, the goal of the optimization was to maximize the ROI signal of the appropriate channel with minimum cross-over to the other ROI.
SNR of each channel and crossover signals were computed using the mean signal and pseudo-noise standard deviations calculated in the previous steps. XCNR was defined as:
| (4) |
The process is repeated for all possible combinations of cutoff frequencies. In each process, the bandwidths of the spectral windows were adjusted ±5nm to compute the XCNR values for each channel in order to construct an XCNR map.
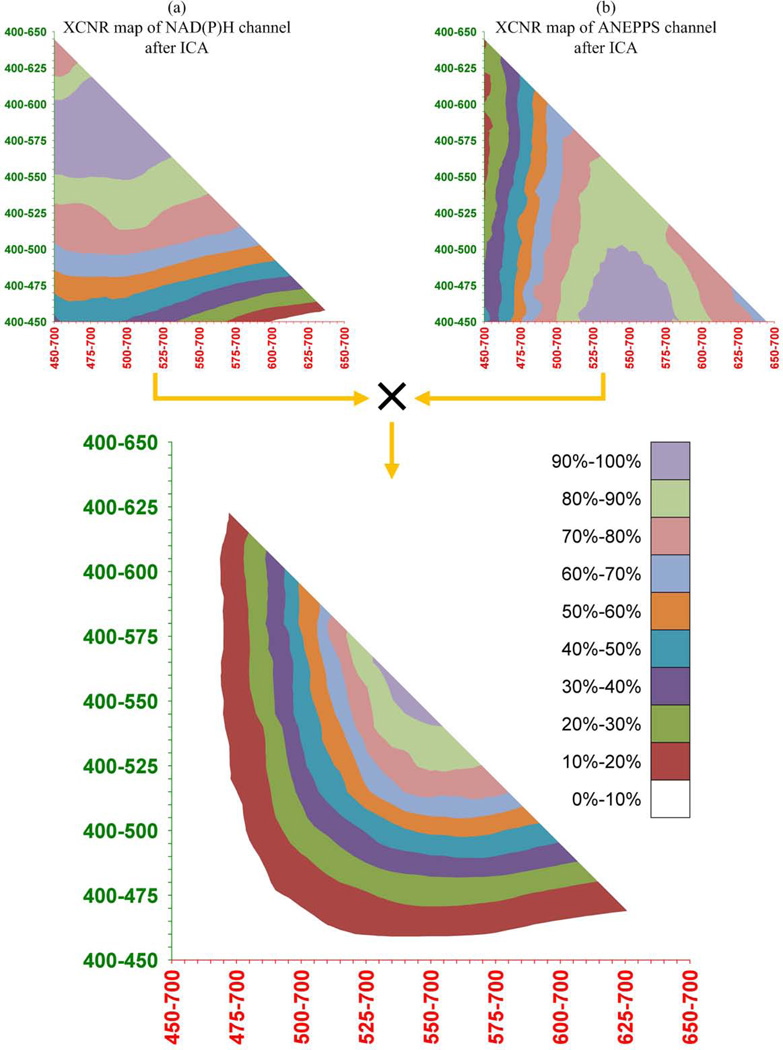
To obtain the best combination of XCNR map for both channels, a joint product (an element-wise multiplication) of the two maps was calculated as the final XCNR decision map (Figure 3).The effect of the dichroic mirror cutoff frequency on the XCNR can be evaluated using this approach to select an optimal value. For the probes understudy here, we selected a cutoff frequency of 545 nm.
Figure 3.
It is important to note that we used the probes spectral information only to estimate the optimal cutoff frequency; this spectral information was not used in the ICA unmixing process. This analysis reveals that the precise cutoff frequency of the dichroic mirror is not critical and a broad range of frequencies between the emission optima of the probes will likely provide adequate results. This observation was the reason we did not perform the full simulation for the three probe example outlined below.
SNR Quantification
To compare ICA signal unmixing with conventional imaging using band-pass filters, the ROIs of muscle fibers (NAD(P)H) and vessels (ANEPPS) were segmented in both detector channels using image processing methods as described in (Glancy et al., 2013). SNR and scatter plots of each channel were calculated on the image pixels inside the corresponding ROI mask in both the ICA treated and conventional filter system on near identical regions in the same animal. It was not possible to record exactly identical 3D volumes in these live animals largely due to drift during the time required to change the filter systems.
RESULTS
Figure 3 shows the results of the dichroic mirror cutoff frequency optimization for the final XCNR decision map of NAD(P)H and ANEPPS. The diagonal line in the map represents the cases where two spectral windows are adjacent that can be implemented by a single dichroic mirror cutoff with additional band-pass filters. The XCNR values in the upper diagonal map are null due to the overlap of two spectral windows. The XCNR maps of both NAD(P)H and ANEPPS show an improvement in signal when the spectral windows are extended (Figure 3a and b). However, signal is significantly reduced in the opposing channel when the spectral window of one channel occupies most of the spectrum range. These extreme conditions are effectively excluded in the final decision map as shown in Figure 3c.
Furthermore, it is evident that a trend of XCNR improvement towards the diagonal line can be observed from the decision map. A center region of the map where the normalized XCNR values were greater than 90% was selected as the optimal cutoff frequency bands which are 540 nm – 570 nm for NAD(P)H and 525 nm – 560 nm for ANEPPS. The combination of these decision maps results in an optimal cutoff frequency in the 525nm – 570nm range. This is a surprisingly broad optimum suggesting a range of dichroic mirrors could be used. Based on this simulation we selected a dichroic mirror with a 545 nm cutoff frequency (Figure 4).
Figure 4.
The broad optima also suggested that the unmixing matrix is relatively insensitive to small changes in the emission characteristics of the probe, an important feature using probes inside cells. To test this notion, we shifted reference ANEPPS and NAD(P)H emission spectra, thereby changing the mixing matrix, but keeping the unmixing matrix determined from the native emission spectra unchanged. This simulation was performed to examine how changes in the spectral characteristics of these probes that could occur under a variety of in vivo conditions (Rothstein et al., 2005, Kao et al., 2001), would influence the ability of the “fixed” unmixing matrix to still successfully separate the signals based on the XCNR merit score. In these simulations we simulated worse case conditions for these probes by shifting the difference between the native spectra by 20nmin both directions (i.e. shifted NAD(P)H up 10 nm and ANEPPS down 10 nm or shifted NAD(P)H down 10nm and ANEPPS up 10 nm). The XCNR values normalized for the three conditions studied are presented in Table 1. The spectral shifts did not compromise the XCNR metric even when the emissions were moved closer by 20nm.As implied from these high XCNR values, the large spectral shifts had little or no effect on the reconstructed images. These results suggest that for moderate changes in the probes emission spectra in vivo it is not critical to repeat the ICA step and that unmixing can be directly performed with a previously calculated unmixing matrix. However, this demonstration is only relevant to the probes and conditions used here. Changes in spectral densities, or spectral shape, could have more profound effects with a fixed cutoff frequency in other systems.
Table 1.
Normalized XCNR values for shifting native emission spectra after ICA processing.
| Emission Probe | Native Spectra | NAD(P)H shift +10nm ANEPPS shift −10nm |
NAD(P)H shift −10nm ANEPPS shift +10nm |
|---|---|---|---|
| NAD(P)H | 28 | 27 | 29 |
| ANEPPS | 63 | 59 | 64 |
In vivo Imaging
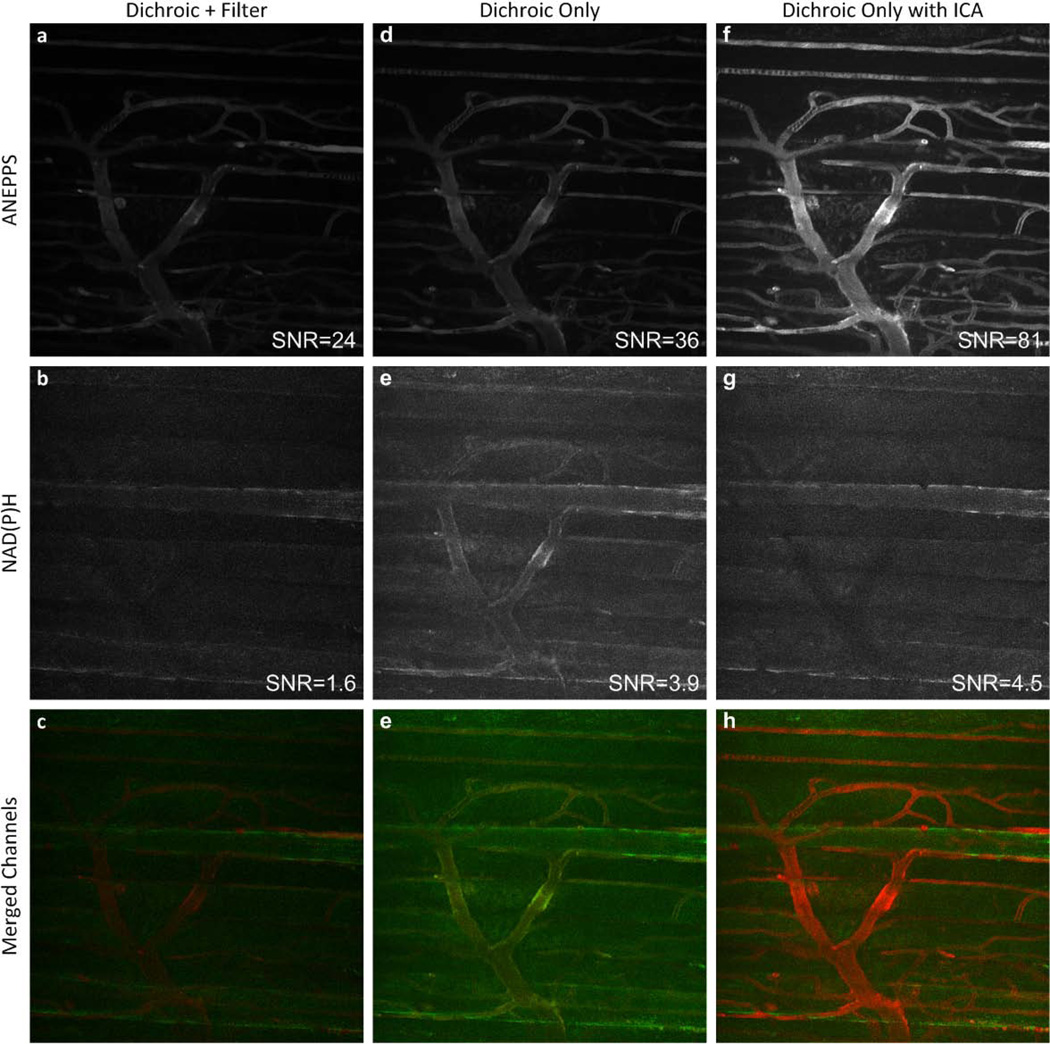
An imaging series in the mouse Tibialis Anterior muscle in vivo is presented in Figure 5 and Supplemental Figure 1 that shows both the raw signal in the ANEPPS and NAD(P)H channels as well as the combined images. Due to the large difference in SNR of the methods, the images are presented normalized to the maximum image within a series (Figure 5) as well as optimized level for each frame in Supplemental Figure 1. The most revealing panel in Figure 5 and Supplemental Figure 1 is the NAD(P)H images in the middle row (Figure 5b, 5e, and 5h and corresponding images in Supplemental Figure 1). To avoid bleed over from ANEPPS directly, the conventional band-pass filter cuts off a significant fraction of the inherent NAD(P)H emission (Figure 5b and Supplemental Figure 1b). As shown in the conventional filter panel this strategy was successful with the elimination of the ANEPPS signal from the NAD(P)H channel. However, this was at the expense of NAD(P)H signal as revealed in the dichroic mirror image where the myocyte NAD(P)H signal is enhanced (Figure 5e and Supplemental Figure 1e). A consequence of this increase in collecting NAD(P)H signal with the simple dichroic is the bleed over of the ANEPPS signal as revealed by the inclusion of the vascular signals in this panel. However, as seen in the final panel, the ICA unmixing images generated an excellent discrimination of the myocytes NAD(P)H and vascular ANEPPS signals while maintaining the increased signal (Figure 5c, 5f, and 5i and corresponding images in Supplemental Figure 1).
Figure 5.
A quantitative comparison of vessel and muscle fiber structures reveal there was a large increase of SNR measurements from 24 to 36 in the ANEPPS channel and 1.6 to 3.9 in the NAD(P)H channel for the raw dichroic data compared with the conventional filter data, not surprising with the removal of the bandwidth filters. With ICA remixing of the data to appropriate channels the improvement was even more pronounced increasing to 81 for the ANEPPS channel and 4.5 for the NAD(P)H channels. This represents an approximately 3 fold increase in SNR using the dichroic mirror alone and ICA unmixing for this example which is in good agreement with our simulations discussed above. Furthermore, this improvement in SNR did not compromise the spatial discrimination of the ANEPPS and NAD(P)H probes as demonstrated in the Figures 5 and Supplemental Figure 1.
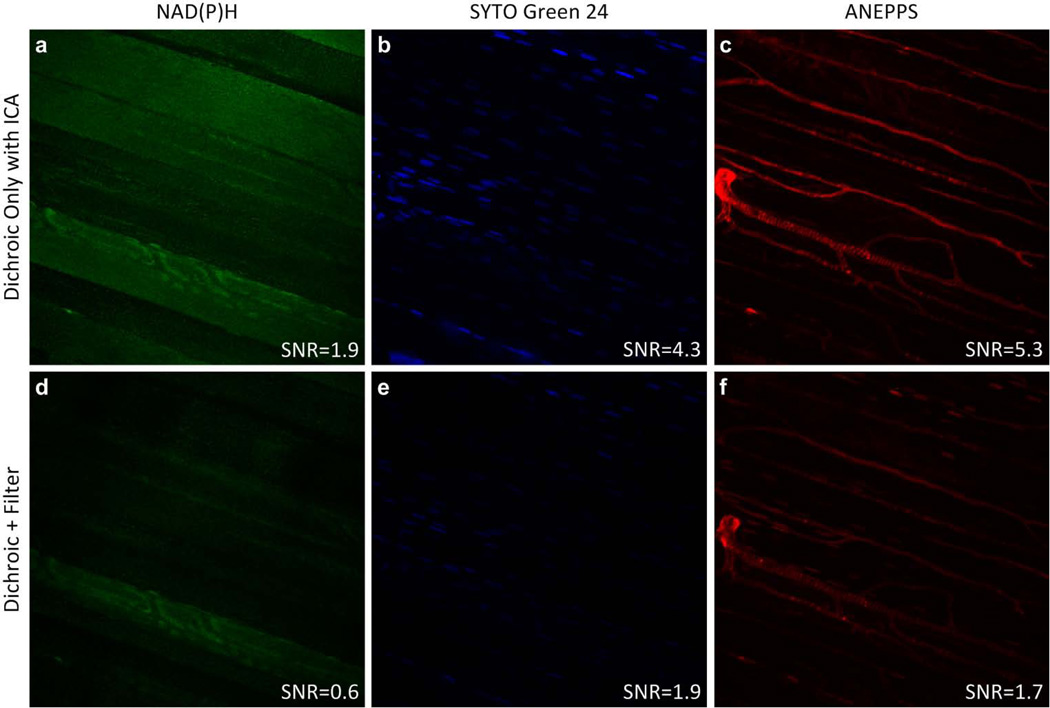
An addition study was conducted using a 3rd probe in the mouse muscle. SYTO Green 24 was infused in addition to ANEPPS to selectively label the nuclei with a green emission signal. An example from this study is presented in Figure 6. The bottom panel presents the images collected with the selective bandwidth filters in place while the top series represents the same series collected without the selective bandwidth filters with ICA unmixing. Again, the only assumption here was that the probes were essentially independently distributed in the tissue, an excellent assumption with these probes. As revealed in the images the spatial discrimination of the probes remained very high in the ICA derived images while the SNR, reported on the images, increased between 3 to 2.2 fold, similar to what we observed in the two probe system and by simulation. These data demonstrate that the approach is applicable to multiple emission probes in a sample.
Figure 6.
DISCUSSION
This study demonstrates that using only a dichroic mirror to efficiently frequency encode nearly all of the emitted light and ICA to unmix this data, the SNR of a multi-probe fluorescence imaging experiment can be significantly improved with no loss of spatial discrimination. This was demonstrated in both simulations and tissues in vivo where roughly 3 fold SNR improvements were demonstrated for the probes studied. This improvement in SNR can be used to decrease excitation power, probe concentration or signal averaging requirements. The SNR improvement realized here will naturally be dependent on many factors and could be higher or lower depending on the particular experimental setup and probes. Likely, probe combinations with more overlap of fluorescence emission resulting in more restrictive band-pass filtering for selective detection would benefit the most from this approach. This approach is likely beneficial to any low SNR multi-probe fluorescence imaging experiments, including in vivo imaging demonstrated here, where the major assumptions are valid.
As implied by its name, independent component analysis statistically determines the solution that minimizes the spatial overlap of the signals, or maximizes their “independence”. This analysis thus works best if different probes do not spatially overlap in multi-channel images. However, as long as the probes’ distributions are mostly independent, small overlapping regions should not significantly affect the ICA analysis. If the probe overlap within pixels is significant, the reliability of this approach may then decrease. We recommend this approach to be used only in cases where the spatial overlap of different probes in the images is relatively small and does not significantly impact this statistical approach. If the impact of spatial overlap is questionable, pilot studies as we conducted here comparing conventional and the ICA unmixing approach can quickly evaluate whether this approach remains valid with different probe distributions. We recommend this empirical approach since the statistical tolerance of the overlap will depend on the nature of the spectral overlap of probes, ratio of signal intensity, the topology of any spatial overlap of the probes and probe spectral stability.
In this initial study, simulated and demonstrated the use of ICA in a two probe system. Based on these observations that the cutoff frequency of the dichroic mirrors was not a critical parameter in these analysis we also demonstrated the utility of the approach on a 3 probe problem. The successful expansion of this approach to other probes and more numerous probes in a given experiment will depend on the emission characteristics and spatial distribution of the probes.
The determination of the optimal cutoff frequency in this study revealed rather broad frequency optima suggesting that the criticality of selecting the cutoff frequency in this approach was rather tolerable and we demonstrated that a given mixing matrix is also not significantly compromised by modest changes in the emission frequencies of the probes (Table 1). This later characteristic should make this method more robust in cellular applications where the spectral properties can be poorly defined. One factor that can affect to the decision map is the pseudo-noise estimation in the optimization process. The Poisson noise removal method was selected as the pseudo-noise extraction procedure because the reference spectra stack represents the photon energy of an image at different wavelengths that are contaminated by Poisson noise. Applying other de-noising algorithms may change the accuracy of pseudo-noise estimation that can shift the optimal range in the decision map. However, the broad frequency optimum as revealed in the current analysis suggests that small variations in the decision map may not significantly impact the performance of this approach.
Real-time image acquisition and processing is an important and practical application for this approach due to the fact that the mixing of the raw signals in different channels generally results in poor discrimination of the probes in the raw images. These images are used to guide frame selection or even motion tracking which benefits from high spatial contrast and SNR (Bakalar et al., 2012). This issue is clearly seen in the raw channels from the raw dichroic mirror images in Supplemental Figure 1 which would be difficult to guide the investigator in selecting fields of view. Real-time unmixing requires a rapid signal separation procedure, in which the most time-consuming task is determining the mixing matrix. However, if the spectral properties of the probes are maintained, a mixing matrix can be determined in a separate study and applied subsequently to future studies without the need to collect additional emission spectra. Indeed, we have found the mixing matrix presented for NAD(P)H and ANEPPS is very stable even between microscope platforms and works on all the muscle preparations we have studied. The computational performance for unmixing using a preexisting unmixing matrix is approximately 100 image/sec for a 512×512 pixel dimension2-channel dataset executing on an Intel Core i7 X990 3.46GHz CPU. The computational efficiency can be further improved by code optimization and parallel processing such as utilizing general-purpose graphics processing unit (GPGPU) and field programmable gate array (FPGA). With readily available computational resources, the proposed ICA approach should easily be implemented and applied to real-time or near real-time imaging for multi-probe fluorescence microscopy.
Supplementary Material
References
- Bakalar M, Schroeder JL, Pursley R, Pohida TJ, Glancy B, Taylor J, Chess D, Kellman P, Xue H, Balaban RS. Three-dimensional motion tracking for high-resolution optical microscopy, in vivo. J Microsc. 2012;246:237–247. doi: 10.1111/j.1365-2818.2012.03613.x. [DOI] [PMC free article] [PubMed] [Google Scholar]
- Blinova K, Levine RL, Boja ES, Griffiths GL, Shi ZD, Ruddy B, Balaban RS. Mitochondrial NADH fluorescence is enhanced by complex I binding. Biochemistry. 2008;47:9636–9645. doi: 10.1021/bi800307y. [DOI] [PMC free article] [PubMed] [Google Scholar]
- Glancy B, Hsu LY, Dao L, Bakalar M, French S, Chess DJ, Taylor JL, Picard M, Aponte A, Daniels MP, Esfahani S, Cushman S, Balaban RS. In Vivo Microscopy Reveals Extensive Embedding of Capillaries within the Sarcolemma of Skeletal Muscle Fibers. Microcirculation. 2013 doi: 10.1111/micc.12098. n/a-n/a. [DOI] [PMC free article] [PubMed] [Google Scholar]
- Gratton E, Breusegem S, Sutin J, Ruan Q, Barry N. Fluorescence lifetime imaging for the two-photon microscope: time-domain and frequency-domain methods. J Biomed Opt. 2003;8:381–390. doi: 10.1117/1.1586704. [DOI] [PubMed] [Google Scholar]
- Hyvarinen A. New approximations of differential entropy for independent component analysis and projection pursuit. Proceedings of the 1997 conference on Advances in neural information processing systems 10; MIT Press; Denver, Colorado, USA. 1998. [Google Scholar]
- Hyvarinen A. Fast and robust fixed-point algorithms for independent component analysis. IEEE Trans.Neural Netw. 1999;10:626–634. doi: 10.1109/72.761722. [DOI] [PubMed] [Google Scholar]
- Hyvarinen A. Independent component analysis: recent advances. Philos.Trans.A Math.Phys.Eng Sci. 2013;371:20110534. doi: 10.1098/rsta.2011.0534. [DOI] [PMC free article] [PubMed] [Google Scholar]
- Hyvarinen A, Oja E. Independent component analysis: algorithms and applications. Neural Networks. 2000;13:411–430. doi: 10.1016/s0893-6080(00)00026-5. [DOI] [PubMed] [Google Scholar]
- Jobsis PD, Rothstein EC, Balaban RS. Limited utility of acetoxy methyl (AM)-based intracellular delivery systems, in vivo: interference by extracellular esterases. J.Microsc. 2007;226:74–81. doi: 10.1111/j.1365-2818.2007.01755.x. [DOI] [PMC free article] [PubMed] [Google Scholar]
- Kao WY, Davis CE, Kim YI, Beach JM. Fluorescence emission spectral shift measurements of membrane potential in single cells. Biophys J. 2001;81:1163–1170. doi: 10.1016/S0006-3495(01)75773-6. [DOI] [PMC free article] [PubMed] [Google Scholar]
- Keshava N, Mustard JF. Spectral Unmixing. IEEE Signal Processing. 2002;19:44–57. [Google Scholar]
- Le T, Chartrand R, Asaki TJ. A variation approach to reconstructing images corrupted by poisson noise. J.Math.Imaging vis. 2013;27:257–263. [Google Scholar]
- Lucotte B, Balaban RS. Motion compensation for in vivo subcellular optical microscopy. J Microsc. 2014;254:9–12. doi: 10.1111/jmi.12116. [DOI] [PMC free article] [PubMed] [Google Scholar]
- Neher R, Neher E. Optimizing imaging parameters for the separation of multiple labels in a fluorescence image. J Microsc. 2004;213:46–62. doi: 10.1111/j.1365-2818.2004.01262.x. [DOI] [PubMed] [Google Scholar]
- Neher RA, Mitkovski M, Kirchhoff F, Neher E, Theis FJ, Zeug A. Blind source separation techniques for the decomposition of multiply labeled fluorescence images. Biophys J. 2009;96:3791–3800. doi: 10.1016/j.bpj.2008.10.068. [DOI] [PMC free article] [PubMed] [Google Scholar]
- Rothstein EC, Carroll S, Combs CA, Jobsis PD, Balaban RS. Skeletal muscle NAD(P)H two-photon fluorescence microscopy in vivo: topology and optical inner filters. Biophys.J. 2005;88:2165–2176. doi: 10.1529/biophysj.104.053165. [DOI] [PMC free article] [PubMed] [Google Scholar]
- Zimmermann T. Spectral imaging and linear unmixing in light microscopy. Adv.Biochem.Eng Biotechnol. 2005;95:245–265. doi: 10.1007/b102216. [DOI] [PubMed] [Google Scholar]
- Zimmermann T, Marrison J, Hogg K, O'Toole P. Clearing up the signal: spectral imaging and linear unmixing in fluorescence microscopy. Methods Mol.Biol. 2014;1075:129–148. doi: 10.1007/978-1-60761-847-8_5. [DOI] [PubMed] [Google Scholar]
- Zimmermann T, Rietdorf J, Pepperkok R. Spectral imaging and its applications in live cell microscopy. FEBS Lett. 2003;546:87–92. doi: 10.1016/s0014-5793(03)00521-0. [DOI] [PubMed] [Google Scholar]
Associated Data
This section collects any data citations, data availability statements, or supplementary materials included in this article.


