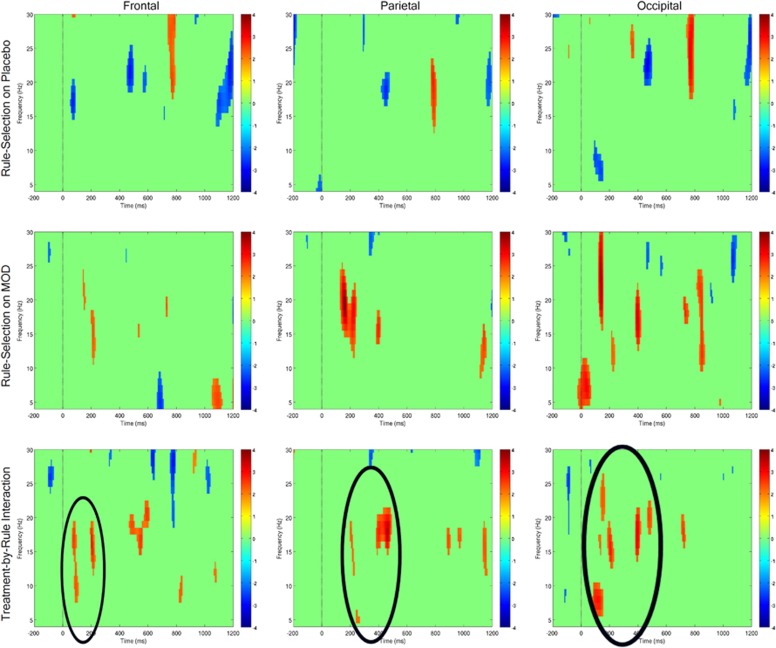
Figure 1.
Spectrograms of task and drug effects on control-related middle-frequency power during proactive cognitive control task performance. Trial-averaged spectrograms depicting mean oscillatory power within 4–30 Hz range, from baseline period (pre-cue) through cue-on and cue-probe delay period, within electrode subgroups (indicated by headings). Vertical drop lines indicate the onset of the cue, at t=0; cue offset is at t=500 ms. Power is color-coded in all spectrograms according to scales at right, and color-coded only if exceeding the threshold derived from bootstrapping procedure (see text for details). Top row: oscillatory power in response to high-control (ie, Red Cue minus Green Cue) demands, on Placebo. Middle row: oscillatory power in response to high-control (ie, Red Cue minus Green Cue) demands, on modafinil. Bottom row: Modafinil effect on oscillatory power in response to high-control demands (ie, MOD (Red Cue minus Green Cue) minus PLC (Red Cue minus Green Cue)), or middle row minus top row. Note the robust relative increase in power in theta, alpha, and beta bands during the cue-on period. A full color version of this figure is available at Neuropsychopharmacology online.

