Abstract
Land-use change is widely considered to be a major factor affecting soil carbon (C) sequestration (ΔCs). This paper studied changes to soil C stocks (Cs) following the conversion of farmland to forest, shrub and grassland across the key area for implementing China's “Grain for Green” — the Loess Plateau. The results are based on a synthesis of 44 recent publications (including 424 observations at 70 sites) which has allowed us to further refine our understanding of the mechanisms driving the increase in Cs following farmland conversion. This synthesis suggests that the ΔCs potential of the Loess Plateau could reach 0.59 Tg yr−1 based on an estimated annual average ΔCs rate of 0.29 Mg ha−1 yr−1. In the region's different rainfall zones both the main contributing factors and Cs dynamics varied. Across the entire Loess Plateau, Cs showed first an increasing (<5 yr) then a decreasing (6–10 yr) tendency only to increase (>10 yr) yet again. In addition, the ΔCs rates depended primarily on restoration age. This synthesis demonstrates that both the initial s Cs and the average annual temperature have a significant effect on ΔCs while the effect of land-use conversion type, rainfall zone, and average annual precipitation were minimal.
Land-use change significantly impacts the global carbon (C) cycle by changing the rates of both vegetation biomass accumulation and soil erosion1,2. In the past two centuries, heightened global increases in the conversion of natural vegetation to farmland has led to a net C loss from the terrestrial biosphere into the atmosphere, making this process one of the principle contributors to enhanced global warming3. In light of the attempts to reduce atmospheric C, a necessity if we are to come to grips with global climate change, restoring degraded ecosystems has begun to play a significant role in attempts to sequester carbon as a climate change mitigation strategy4,5,6,7,8. Capturing carbon through changes in land use and sequestering it in the soil is a key component of the “Grain for Green” program.
In the latter half of the twentieth century and increasingly toward its close, sustainable socioeconomic development in China was hindered by widespread environmental degradation. To counteract soil erosion and other environmental problems, in 1999, the Chinese government implemented the “Grain for Green” program to convert farmland to forest, shrub, and grassland9. Although the initial goal of the “Grain for Green” program was to control soil erosion on the Loess Plateau, it has been instrumental in increasing both the rate and overall quantity of C sequestered in the soil7,10. At present, the “Grain for Green” program is the first and still the most ambitious, ecosystem services program in China6,11,12.
The effect the “Grain for Green” program has had on both the accumulation of soil C stocks (Cs) and the rate of soil C sequestration (ΔCs) has received increasing attention from academics6,7,10,12. Zhang et al.12 reported an average ΔCs rate of 0.37 Mg ha−1 yr−1 in the top 20 cm of the soil profile throughout the entire GFG program zone. Four years later, Deng et al.7 lowered that rate to 0.33 Mg ha−1 yr−1. Meanwhile, Chang et al.10 published data suggesting that Cs in the top 20 cm of the soil layer had been accumulating at a rate of 0.712 Tg yr−1 (0.173 Mg ha−1 yr−1) for 60 years across the entire Loess Plateau. Soon after, Feng et al.6 reported an increase of 2.64 Pg in 2000 to 2.68 Pg in 2008, a ΔCs rate of 0.085 Mg ha−1 yr−1 for the uppermost 20 cm of the soil profile from across the plateau. According to the published data, the ΔCs rate estimated by Chang et al.10 was roughly double the value reported by Feng et al.6. This inconsistency begs the question: why is there such a wide range in the reported values? This synthesis sheds light on the contributing factors and clarifies their impact and a new model or estimation/calculation that is more robust. Now is the time to do that.
Researchers face serious challenges in their attempt to accurately estimate changes to the Cs within the area covered by the GFG program13. A fundamental drawback in the calculation has been the use of ΔCs rates following farmland conversion from outside China that may not fit either the climatic or the soil conditions13 of the Loess Plateau A second challenge is the small number of actual observations used to estimate the large scale changes in SOC attributed to the GFG program10,12. Using the CENTURY model to estimate soil carbon storage6 in the diverse ecosystems that lay within the area covered by the GFG program led to inaccuracies because the model assumes grassland to be the baseline ecosystem established by restoration and meant to progress through a process of ecosystem amelioration. Some of the results have shown that the model achieves higher results when simulating either farmland or grassland ecosystems than it does for forest ecosystems. Consequently, a more accurate method is required when estimating the rate of change in SOC on such a vast scale.
The Loess Plateau in China, an area of 6.4 × 10⁵ km2, is considered one of the most severely eroded areas in the world14, making it the main area of interest for implementing China's “Grain for Green” program. Its primary goal was to convert the approximately 2.03 × 10⁶ ha of farmland found on slopes greater than 15° into woodland and grassland10,15. The effect on Cs or changes to the rate of ΔCs on the Loess Plateau has been studied since the onset of the program5,16,17,18,19,20. However, because most of the studies were conducted at local sites those processes controlling regional ΔCs rates remain open to interpretation. In addition, although several authors have analyzed the factors determining Cs during the establishment of perennial vegetation, a consensus on the relative significance of these factors has yet to be achieved6,7,10,12, indicating a need for further study on the effects of land-use conversion on ΔCs rates across the “Grain for Green” zone.
This synthesis of the literature has a three-fold objective: (1) to quantify the potential rate of ΔCs attributable to the “Grain for Green” or three land-use conversion types (forest, shrub, and grassland) across the Loess Plateau; (2) to assess the effects of land-use conversion on Cs dynamics across the entire Loess Plateau and the region's three rainfall zones (<450, 450–550, and >550 mm); and (3) to determine the extent to which differences in ΔCs are dependent on land-use conversion types. To achieve these objectives we synthesized the findings of 44 recent publications from the literature in which land use conversion (cropland to forest, shrub and grassland) was related to changes in soil C values on the Loess Plateau.
Results
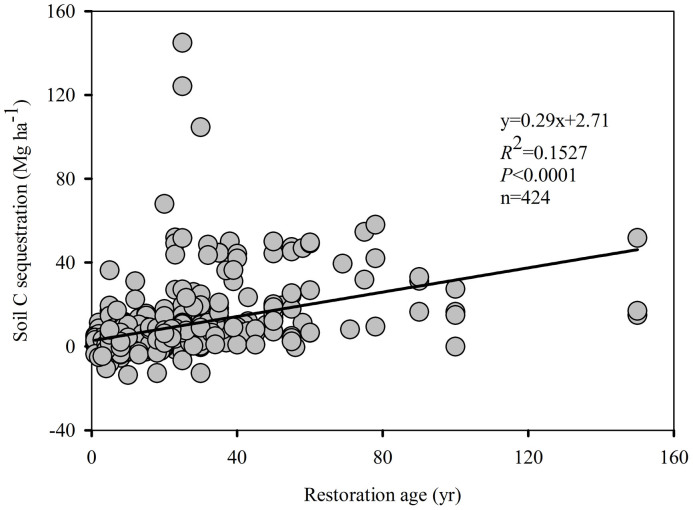
The results show that the relationship between and restoration age was ΔCs = 0.29 × ΔAge + 2.71 (R2 = 1.1527, P<0.0001) throughout the entire “Grain for Green” program area on the Loess Plateau (Figure 1), providing an estimated average ΔCs rate of 0.29 Mg ha−1 yr−1 (Table 1). The ΔCs potential of the “Grain for Green” program for the entire Loess Plateau is 0.59 Tg yr−1 (Table 1).
Figure 1. The linear regression equation (y = kx + y0) between soil C sequestration and restoration age throughout the entire “Grain for Green” program area on the Loess Plateau.
Table 1. 0–20 cm actual and potential soil C sequestration rates for the “Grain for Green” program on the Loess Plateau.
| Item | C sequestration rate (Mg ha−1 yr−1) | Land-use conversion | Average restoration age (yr) | Area* (ha) | C sequestration potential (Tg yr−1) |
|---|---|---|---|---|---|
| Whole GFG | 0.29 ± 0.03 | Forest, shrub, grassland | 23 | 2.03 × 10⁶ | 0.59 ± 0.07 |
Note: * The data has been adopted from Chang et al. (2011). The error bars represent standard errors for the slope of equation 5 (k).
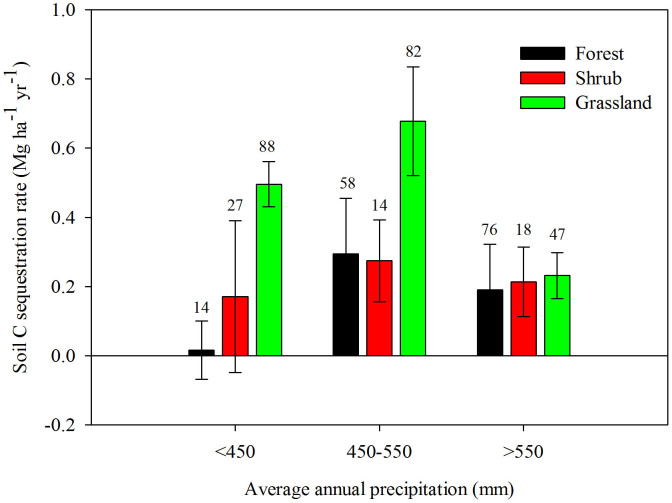
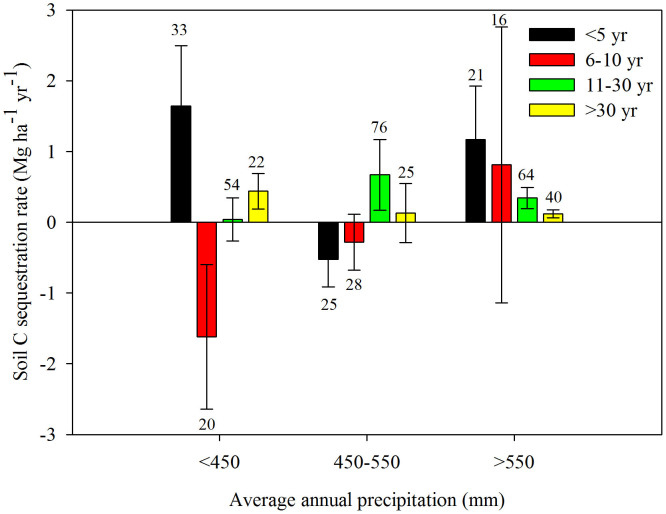
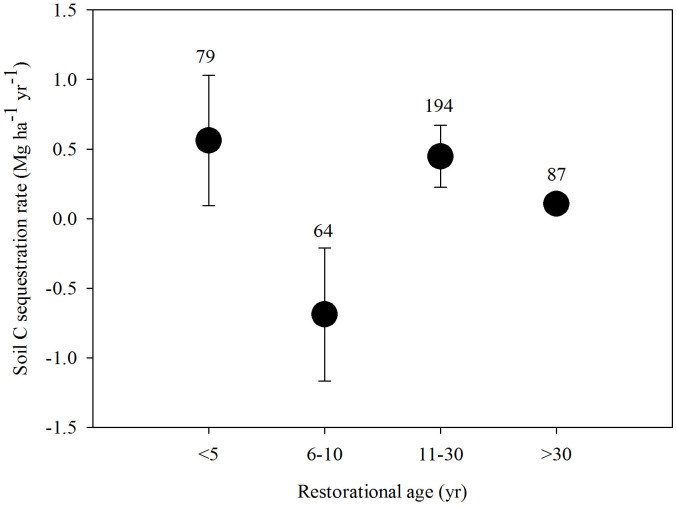
The three rainfall zones, with annual precipitation averages of <450 mm, 450–550 mm, and >550 mm, had different ΔCs rates. The 450–550 mm zone had the highest rate at 0.51 Mg ha−1 yr−1, and the highest precipitation zone (>550 mm) had the lowest rate at 0.21 Mg ha−1 yr−1 (Figure 2). The dynamics of Cs across the entire plateau was similar to the P<450 mm zone (Figures 1 and 2). During the periods <5, 6–10, 11–30, and>30 years, the respective rates of soil C change in the 0–20 cm soil layer were 0.56, −0.69, 0.45, and 0.11 Mg ha−1 yr−1 across the entire Loess Plateau. Land converted to grassland had a higher ΔCs rate than land converted to either forest or shrubland. Both forest and shrubland share similar rates although forest has the lowest rate on the whole (Figure 3). Moreover, the rate for shrubland (0.29 Mg ha−1 yr−1) was closer to the average level of the whole GFG program zone (Figure 3). In addition, in the different rainfall zones Cs dynamics varied in (1) first increasing (<5 yr) then decreasing (6–10 yr) only to increase (>10 yr) again (<450 mm), and during the periods <5, 6–10, 11–30, and >30 years, the rates of soil C change were 1.65, −1.62, 0.04, and 0.44 Mg ha−1 yr−1 for 0–20 cm soil, respectively; (2) initial decreases (<10 yr) were followed by a consistent increase (>10 yr) (450–550 mm), and during the periods <5, 6–10, 11–30, and>30 years, the rates of soil C change were −0.53, −0.28, 0.67, and 0.13 Mg ha−1 yr−1 for 0–20 cm soil, respectively; (3) increasing continuously (0 to >40 yr) (>550 mm), and during the periods <5, 6–10, 11–30, and>30 years, the rates of soil C change were 1.17, 0.81, 0.34, and 0.12 Mg ha−1 yr−1 for 0–20 cm soil, respectively (Figure 4). We estimate the average ΔCs rates for the three land-use conversion types (forest, shrub, and grassland) to be 0.19, 0.29 and 0.52 Mg ha−1 yr−1, respectively (Figure 5).
Figure 2. Soil C sequestration rates in different rainfall zones throughout the entire “Grain for Green” program on the Loess Plateau.
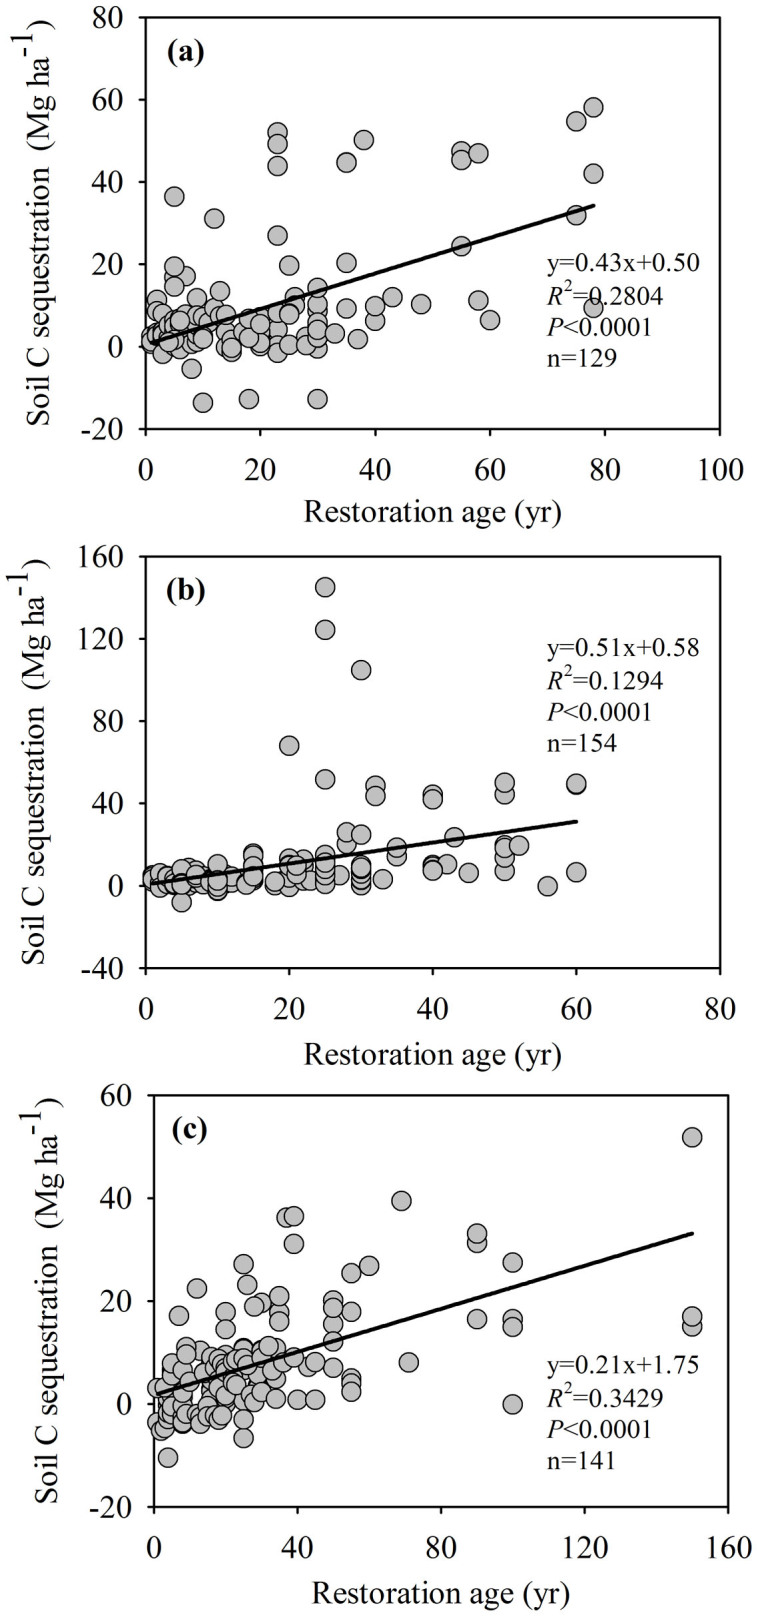
Note: a. <450 mm; b. 450–500 mm; c. >500 mm.
Figure 3. Soil C sequestration rates of different land-use conversion types in the different rainfall zones of the Loess Plateau.
Note: The error bars represent standard errors for the slope of Equation 5 (k) and values above the bars are the corresponding number of observations.
Figure 4. Soil C sequestration rates of different age groups in different rainfall zones on the Loess Plateau.
Note: The error bars represent standard errors for the slope of Equation 5 (k) and values above the bars are the corresponding number of observations.
Figure 5. Soil C sequestration rates of different land-use conversion types throughout the entire GFG program area on the Loess Plateau.
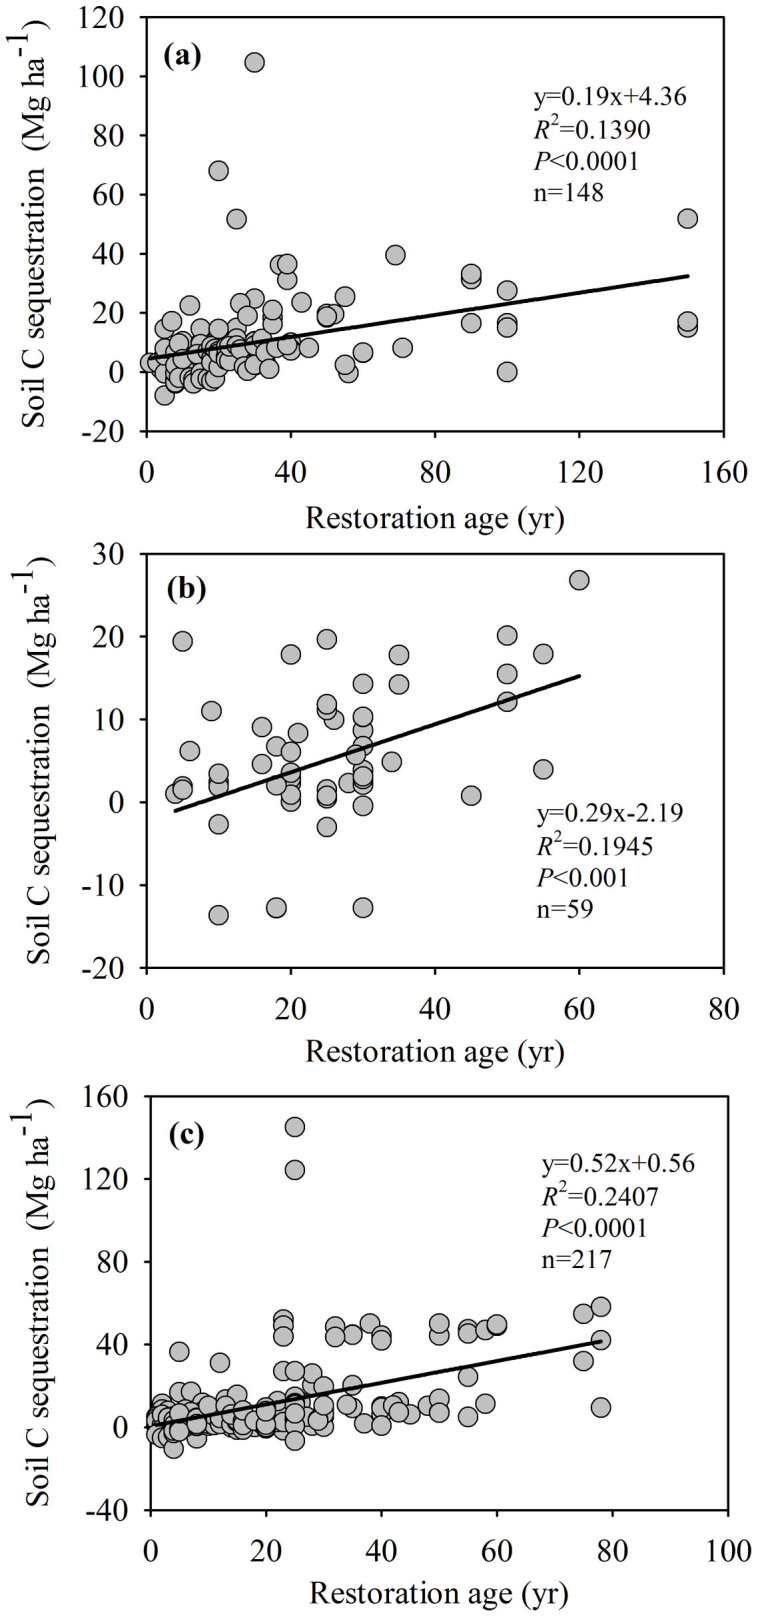
Note: a. forest; b. shrub; c. grassland.
ANOVA analysis showed that while ΔCs values indicated no significant difference when related to land-use conversion type or rainfall zone (P>0.05), there was a significant difference when measured against restoration age (P<0.01) (Table 2). However, in different rainfall zones the main contributing factor varied. In the P<450 mm zone, average annual temperature (T) and restoration age were the main factors while restoration age and initial Cs (I) were the main factors in the P = 450–550 mm zone. Importantly, from a planning perspective, the P>550 mm zone was dominated by one factor alone, the age of restoration. For the whole Loess Plateau, average annual temperature (T) and the age of the restoration were the main factors (Table 3).
Table 2. Multi-way ANOVA of soil C sequestration in different rainfall zones, land-use conversion types, and age groups on the Loess Plateau.
| Source | df | F | Sig. (P) |
|---|---|---|---|
| Rainfall zones | 2 | 1.644 | 0.194 |
| Land-use conversion types | 2 | 0.254 | 0.776 |
| Age groups | 3 | 5.318 | 0.001** |
| Rainfall zones × Land-use conversion types | 4 | 2.150 | 0.074 |
| Rainfall zones × Age groups | 6 | 0.893 | 0.500 |
| Land-use conversion types × Age groups | 6 | 0.829 | 0.548 |
| Rainfall zones × Land-use conversion types × Age groups | 10 | 1.365 | 0.194 |
Note: **indicates significant difference at the 0.01 level (P<0.01).
Table 3. Stepwise regression to detect factors (T, P, A and I) determining soil C sequestration following land-use conversion in 0–20 cm soil on the Loess Plateau.
| Rainfall zone | Equation | R2 | Sig. (P) | n |
|---|---|---|---|---|
| <450 mm | ΔCs = −5.00T + 0.37A + 36.42 | 0.491 | 0.000** | 129 |
| 450–550 mm | ΔCs = 0.63A + 0.74I-6.57 | 0.206 | 0.000** | 154 |
| >550 mm | ΔCs = 0.21A + 1.70 | 0.356 | 0.000** | 141 |
| All | ΔCs = −2.78T + 0.28A + 26.46 | 0.202 | 0.000** | 424 |
Note: ΔCs is soil C sequestration following land-use conversion; T (°C) is the average annual temperature; P (mm) is the average annual precipitation; A (yr) is the restoration age; I (Mg ha−1) is the initial soil C stocks.
Discussions
Soil C Sequestration Potential and Dynamics
The global average ΔCs rates following the conversion of cultivated land to forest, shrub and grassland are 0.45, 0.47 and 1.1 Mg ha−1 yr−1, respectively21,22,23,24. According to our estimates, the average ΔCs rates in the three land-use conversion types on the Loess Plateau hover around half that of the global average (Figure 5). Across China, average gains of 0.3712 or 0.337 Mg ha−1 yr−1 in SOC following the establishment of perennial vegetation on previously cultivated land have both been reported. Our study estimated the average ΔCs rate on the Loess Plateau to have been 0.29 Mg ha−1 yr−1 after farmland conversion (Table 1, Figure 1), a figure which is lower than the average rate for China as a whole7,12. The most likely reason the ΔCs rate on the Loess Plateau is lower than both the global and national (China) averages may be that the Loess Plateau is located in the arid and sub-arid zones and consequently experiences lower annual rainfall. We can say this with some conviction because the rate of ΔCs is positive related with average annual precipitation on a larger scale7,12,21,22,24. Feng et al.6 have reported that Cs in the top 20 cm of the soil profile for the entire Loess Plateau increased from 2.64 Pg in 2000 to 2.68 Pg in 2008, a rate of 0.085 Mg ha−1 yr−1, which is a fraction of the 0.29 Mg ha−1 yr−1 rate this study reveals. Chang et al.10 estimated that the Cs in the top 20 cm of the soil profile increased at a rate of 0.712 Tg yr−1 over a period of 60 years, a value 13% higher than our results show (0.59 Tg yr−1) (Table 1). The differences appear to be attributable to different methods of estimation. Further afield in Central America, where the average annual precipitation is 800 mm, Martens et al.25 found that ΔCs grew at an average rate of 0.62 and 1.60 Mg ha−1 yr−1 following farmland conversion to pasture and secondary forest, respectively. Silver et al.26 reported that in the top 25 cm soil layer of abandoned tropical agricultural land ΔCs increased at a rate of 0.41 Mg ha−1 yr−1 over a 100-year period following afforestation. Those regions have higher ΔCs rates than areas on the Loess Plateau where the average annual precipitation is ~500 mm, again suggesting that the main reason behind the differing rates of C sequestration might be attributable to differences in average annual precipitation.
In our study, Cs in different rainfall zones had varied dynamics, that is: Zone 1: first increased then decreased and then increased again (<450 mm); Zone 2: first decreased and then continued to increase (450–550 mm); Zone 3: increased persistently from the outset (>550 mm) (Figure 4). Although the mechanisms controlling the post-conversion C sequestration rate differ for Cs, precipitation probably driving the variation. Four temporal patterns of change to Csfollowing farmland conversion can be discerned in the literature: (1) an initial decrease in soil C during the early stage, followed by a gradual return of C stocks to farmland level and then an increase to net C gains12,20,27; (2) a decrease28; (3) an increase5,29; (4) unchanged30. However, in our study, the Csfirst increased (<5 yr) then decreased (6–10 yr) and then increased (>10 yr) again across the whole Loess Plateau (Figure 6), a finding which differs from that of the national scale7, which reported that Cs decreased first (<5 yr) and then increased (>5 yr) following farmland conversion. However, they both show that soil C plays a significant role in fixing soil C. In a review study, Paul et al.31 determined that the duration of the initial decrease in soil C was reported to have lasted from 3–35 years after agricultural abandonment. However, the pattern was unclear because soil from different depths had been mixed together. In addition, there were great differences among the depths in terms of the temporal change in Cs depending on both climatic regime and soil conditions.
Figure 6. Soil C sequestration rates of different age groups throughout the entire “Grain for Green” program area on the Loess Plateau.
Note: The error bars represent standard errors for the slope of Equation 5 (k) and values above the bars are the corresponding number of observations.
Factors Affecting Soil C Sequestration after Land-Use Change
Land use change is one of the major factors affecting both variation in Csand the global carbon balance7,17. It has been previously demonstrated that the “Grain for Green” program is an effective large scale ecosystem services program to restore degraded farmlands6,7,10,12,17. The results of the synthesis indicate that changes in land use increased soil C stocks, especially when farmland was converted to grassland (Figure 3; Figure 5). Fu et al.18 reported that shrub was responsible for accumulating more C into soil than grassland, but others documented no difference between the two land-use types32. When comparing the effects of different land-use conversion types on ΔCs, Chang et al.10 reported no difference among grassland, shrubland and forest on the northern Loess Plateau (<450 mm); moreover, soil carbon in forested systems increased much more than in shrubland or grassland on the central Loess Plateau (450–550 mm); on the southern Loess Plateau (>550 mm), forest had a stronger effect on the rate of ΔCs than grassland, but a non-significant effect for shrubland. However, the results from the synthesis show no significant difference (P>0.05) in ΔCs values for the different land-use conversion types.
The length of time since land-use conversion plays a consistent and key role in estimating soil C stocks7,12,24. This study reveals a significant difference associated with age groups (P<0.01) (Table 2) with ΔCs showing a significant positive correlation with restoration age (Table 4). This is mainly because ΔCs increased as the quantity of C inputs increased, a process which was accompanied by a new microclimatic regime and enhanced organic matter protection of the soil33. However, in the first few years of plantation establishment, a reduction in Cs was frequently observed12,31, as it was in the 450–500 mm zone of this study. In one case, the Cs decreased dramatically as a result of more serious erosion brought about by a lack of agricultural maintenance practices, fertilization, and sufficient vegetation cover, after which the farmland was soon abandoned (<4 year)34.
Table 4. Pearson correlation coefficients between soil C sequestration and factors: average annual temperature, average annual precipitation and initial soil C stocks following land-use conversion on the Loess Plateau.
| Restoration age (yr) | Average annual temperature (°C) | Average annual precipitation (mm) | Initial soil C stocks (Mg ha−1) | |
|---|---|---|---|---|
| Soil C sequestration (Mg ha−1) | 0.391** (424) | −0.233** (424) | 0.017 (424) | 0.159* (256) |
| Initial soil C stocks (Mg ha−1) | - | −0.438** (256) | 0.210** (256) | - |
Note: **Correlation is significant at the 0.01 level (2-tailed) (P<0.01), and *Correlation is significant at the 0.05 level (2-tailed) (P<0.05); (value) indicates the number of observations.
Deng et al.7 have reported that ΔCs shows no significant correlation with either average annual temperature or precipitation at the national (China) scale, yet temperature and precipitation are the main factors determining changes to the rate of Csin the later stage (>30 years) of restoration. Our results show that ΔCs in the three rainfall zones shows no significant difference on the Loess Plateau (P>0.05) (Table 3). It may be because the Loess Plateau is a relatively small region with an almost uniform coverage of low precipitation. Most sites are distributed between 300 and 600 mm (See appendix dataset S1) meaning the effect of rainfall among the three rainfall zones is not statistically significant. Although the correlation between ΔCs and average annual precipitation was not significant (P>0.05) the two features are positively correlated (Table 4) which demonstrates that precipitation increases the magnitude of ΔCs following land-use conversion. In our study, ΔCs had a significant negative correlation with average annual temperature (P<0.05) (Table 4), this may be because higher temperatures lead to higher losses of soil C through decomposition of soil organic matter. However, Paul et al.31 had reported that soil C accumulated with increasing mean annual temperature and Deng et al. (2014) also found that soil C had a significant positive correlation with mean annual temperature at the national (China) scale, but it was not significant (P>0.05). The inconsistency may be due to differences in scale in the study areas.
Moreover, ΔCs showed a significant positive correlation with initial Cs (P<0.05) (Table 4), a finding which contradicts the results of both Zhang et al.12 and Deng et al.7. Both studies are focused at the national scale whereas our study focuses on a typical region in China, the Loess plateau. Thus, the discrepancy appears to be attributable to a difference in scale. The difference in climatic conditions caused by the vastly differing scales is the main distinguishing factor in the varying rates of ΔCs since land use conversion reported in the literature. In addition, our synthesis revealed that initial Cs are strongly correlated with average annual temperature and precipitation (Table 4). As we know, vegetation restoration, either natural or purposeful, depends on recovery based on the condition of the original land. Obviously, basic conditions, such as soil nutrients, water, and climate have a profound effect on the process of vegetation restoration meaning that the rate of soil carbon change is not independent of initial SOC.
Management Implications
The initial goal of the “Grain for Green” program was to control soil erosion on the Loess Plateau, however, this program has also come to play a significant role in soil carbon sequestration6,7,10,12. To facilitate the value of C sequestration and soil conservation while simultaneously mitigating against the threat posed by ever-increasing levels of atmospheric carbon, it is essential to both plan for more land-use conversion and to enhance the quality of those areas which already exist through suitable management regimes. Restoration programs need to be based on the average rate of ΔCs according to land-use type and the durability of the associated carbon sequestration process. In the lower annual precipitation zone of the Loess Plateau, grassland displayed a higher rate of ΔCs compared to either forest or shrubland (Figure 3), making grassland the logical choice for these sites (<450 mm). In the central precipitation (450–550 mm) zone, both grassland and forest displayed higher ΔCs rates when compared to shrub (Figure 3) meaning grassland and forest systems are recommended. In the high precipitation zone (>550 mm), although forest displayed lower ΔCs rates compared to shrub and grassland, they were basically the same in magnitude (Figure 3), so forest, shrub and grassland can all be justified for this rainfall zone. In addition, across the Loess Plateau the average rate of ΔCs slows after about 30 years from the time of initial farmland conversion (Figure 6) which indicates a need for careful land-use management practices to maintain optimal levels of soil C stocks. In the P<450 mm zone, the rate of ΔCs remained at a high level 30 years after conversion. Consequently, to enhance the benefits of ΔCs priority should be given to long-term enclosure.
Uncertainity Analysis
This synthesis offers the most accurate estimate on which to base the potential rate of ΔCs across the entire “Grain for Green” program zone, albeit with one caveat. Strict accuracy is limited due to the uneven distribution of data collected across the Loess Plateau. Some uncertainties derive from the temporal pattern of SOC accumulation, which several studies have reported to be non-linear5,12. Additionally, many of the studies have no long term observations and consequently, these measurements may add to the uncertainty. In addition, in our study, we ignored the effect of bulk density substituting Equation (2) and Equation (3), i.e., the Cs will be equal as long as SOC is the same. In reality, however, bulk density would not only be significantly different among different sites but also experience significant change after land use conversion within a site. In future, we should focus on the effect(s) of the sites and land use change on soil bulk density to build a functional relationship between SOC and soil bulk density.
Methods
Data Preparation
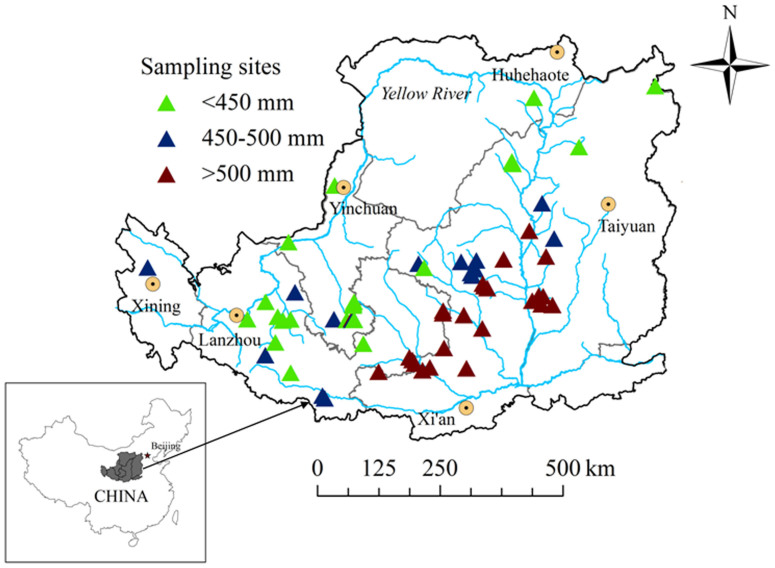
We collected the available published literature (1999–2012) on changes to soil C following the conversion of long-term cultivated farmland to forest, shrub, and grassland as part of the “Grain for Green” program on the Loess Plateau. The raw data were either obtained from tables or extracted by digitizing graphs using Get Data Graph Digitizer (ver. 2.24, Russian Federation). For each paper, the following information was compiled: sources of data, site longitude and latitude, climatic information (average annual temperature and average annual precipitation), land-use conversion type (farmland, forest, shrub, grassland), years since farmland conversion (restoration age), soil depth, experimental design (paired site, chronosequence, retrospective design), soil bulk density, and amount of SOC or ΔCs in the top 20 cm of the soil profile (Appendix dataset S1). We only estimated ΔCs for the top 20 cm of the soil because 92% of studies investigating land-use conversion on the Loess Plateau18,35 found that ΔCs occurs mainly in the surface soil following land-use conversion from farmland to either natural vegetation or plantation10,17,36. In addition, studies have shown that those significant differences in soil C observed in the topsoil do not extend to the subsoil. Our final dataset was composed of 44 papers encompassing 424 observations in the “Grain for Green” program zone of which 43 papers accounted for 256 observations while the other 168 observations were from Chang et al.10. The sites reported from the literature are widely distributed across the “Grain for Green” program zone as shown in Figure 7.
Figure 7. Distribution of “Grain for Green” program sampling sites on the Loess Plateau reported in the collected peer-reviewed papers.
Note: the number of sampling sites for the 3 rainfall zones (<450, 450–550, >550 mm of average annual precipitation) were 22, 18 and 30 respectively. The software ArcGis 9.3 was used to create the map[s].
The Loess Plateau can be divided into three main rainfall zones: the northern Loess Plateau with precipitation <450 mm, the central Loess Plateau with precipitation between 450 and 550 mm, and the southern Loess Plateau with precipitation >550 mm37, allowing us to compare the effects of rainfall on SOC accumulation following land-use conversion. Restoration age was divided into four groups, as follows: 0–5, 6–10, 11–30, and >30 years.
Data Calculation
Of the literature-collected data, soil carbon stocks expressed in units of “kg m−2” were transformed to “Mg ha−1”.
If the samples only reported soil organic matter (SOM) content their SOC values were calculated using the relation between SOM and SOC using the following equation38:
 |
In the synthesized data, not all the sampling data were missing soil bulk density (BD) values. We only used the empirical relationship between soil organic carbon content (C) and bulk density for those results in which soil bulk densities had not been measured in the original papers. We used the empirical relation between soil organic carbon content (SOC) and BD39, which was also used by Zhang et al.12 and Deng et al.7:
 |
The SOC stock was calculated using the following equation:
 |
in which, Cs is the soil organic carbon stock (Mg ha−1); SOC is soil organic carbon concentration (g kg−1); BD is soil bulk density (g cm−3); and D is soil thickness (cm).
The ΔCs rate was estimated depending on changes in ΔCs at different time intervals. The study set the value of C stocks for farmland as the baseline from which to calculate the ΔCs rates during the restoration process when farmland is converted into forest, shrub or grassland. We first calculated the amount of sequestered C for each afforested site following farmland conversion,
 |
in which, CLUn represents soil C stocks at afforested sites (Mg ha−1), and CLU0 is the initial soil C stocks (farmland) (Mg ha−1).
Secondly, we constructed the linear regression equation (y = f(x) = y0 + kx) between C sequestration (ΔCs) and the age for each age group or the whole restoration chronosequence,
 |
we know that the equation's first derivative represents the rate of change of the curve, so Equation 5's first derivative of ΔCs versus ΔAge represents the rate of change in the carbon stocks (soil C sequestration rates)7:
 |
in which, y0 is Equation 5's constant; k is the rate of change in C stocks (Mg ha−1 yr−1) and also represents the slope of Equation 5, and ΔAge represents the time interval (year), ΔAge>0.
The ΔCs potential within the “Grain for Green” program on the Loess Plateau was estimated using the ΔCs rate and the area of farmland or degraded land in the program. The potential for ΔCs was estimated using the ΔCs rate and the area of farmland or degraded land within the program. For our study, we relied upon the now classic description proposed by Chang et al.10 for whom that area of the Loess Plateau which fell under the “Grain for Green” program was composed of farmland characterized by 15 degrees or more of slope. The areas of farmland, including the criterion of rainfall zones, were obtained by overlaying a land-use map of the entire Loess Plateau in 2000, the launch year of the “Grain for Green” program, with a 90-m resolution digital elevation model (DEM). The land-use map was obtained using Landsat TM and ETM remote sensing in 2000. Land-cover categories, including that of farmland, were divided using the 200 m × 200 m pixel output images. These data were used to estimate the ΔCs potential of the “Grain for Green” program across the entire Loess Plateau.
Statistical Analysis
Multi-way ANOVA was performed to test the effects of the difference among land-use conversion types and age groups in the different rainfall zones. Differences were evaluated at the 0.05 significance level. Stepwise regression analysis was used to analyze the relationship between ΔCs following farmland conversion and average annual temperature (T), average annual precipitation (P), years since farmland conversion (A), and initial Cs in the 0–20 cm (I) of every age group. Pearson correlation analysis was used to study the relationship between ΔCs following farmland conversion and T, P, A, and I of all data. All statistical analyses were performed using the software program SPSS, ver. 18.0.
Author Contributions
L.D., Z.S. designed the study, L.D. conducted the study, L.D., Z.S., S.S. wrote the paper, L.D., Z.S., S.S. revised the paper.
Supplementary Material
Dataset 1
Acknowledgments
The study was sponsored by the Major Program of the National Natural Science Foundation of China (41390463), the Strategic Priority Research Program of the Chinese Academy of Sciences (XDA05060300), and Science and Technology Service Network Initiative of the Chines Academy of Sciences (KFJ-EW-STS-005).
References
- Fang J. Y., Chen A. P., Peng C. H., Zhao S. Q. & Ci L. J. Changes in forest biomass carbon storage in China between 1949 and 1998. Science 292, 2320–2322; 10.1126/science.1058629 (2001). [DOI] [PubMed] [Google Scholar]
- Lal R. Soil carbon sequestration in China through agricultural intensification, and restoration of degraded and desertified ecosystems. Land Degrad. Dev. 13, 469–478; 10.1002/ldr.531 (2002). [Google Scholar]
- Foley J. A. et al. Global consequences of land use. Science 309, 570–574; 10.1126/science.1111772 (2005). [DOI] [PubMed] [Google Scholar]
- Miles L. & Kapos V. Reducing greenhouse gas emissions from deforestation and forest degradation: Global land-use implications. Science 320, 1454–1455; 10.1126/science.1155358 (2008). [DOI] [PubMed] [Google Scholar]
- Deng L., Wang K. B., Chen M. L., Shangguan Z. P. & Sweeney S. Soil organic carbon storage capacity positively related to forest succession on the Loess Plateau, China. Catena, 110, 1–7; 10.1016/j.catena.2013.06.016 (2013). [Google Scholar]
- Feng X. M., Fu B. J., Lu N., Zeng Y. & Wu B. F. How ecological restoration alters ecosystem services: an analysis of carbon sequestration in China's Loess Plateau. Sci. Rep. 3, 2846; 10.1038/srep02846 (2013). [DOI] [PMC free article] [PubMed] [Google Scholar]
- Deng L., Liu G. B. & Shangguan Z. P. Land use conversion and changing soil carbon stocks in China's ‘Grain-for-Green’ Program: a synthesis. Global Change Biol. 20, 3544–3556; 10.1111/gcb.12508 (2014) [DOI] [PubMed] [Google Scholar]
- Kriegler E., Edenhofer O., Reuster L., Luderer G. & Klein D. Is atmospheric carbon dioxide removal a game changer for climate change mitigation. Clim. Change 118, 45–57; 10.1007/s10584-012-0681-4 (2013). [Google Scholar]
- Deng L., Shangguan Z. P. & Li R. Effects of the grain-for-green program on soil erosion in China. Int. J. Sediment Res. 27, 120–127; 10.1016/S1001-6279(12)60021-3 (2012). [Google Scholar]
- Chang R. Y., Fu B. J., Liu G. H. & Liu S. G. Soil carbon sequestration potential for “Grain for Green” Project in Loess Plateau, China. Environ. Manage. 48, 1158–1172; 10.1007/s00267-011-9682-8 (2011). [DOI] [PubMed] [Google Scholar]
- Uchida E., Rozelle S. & Xu J. Conservation payments, liquidity constraints, and off-farm labor: impact of the Grain–for–Green Program on rural households in China. Am. J. Agr. Econ. 91, 70–86; 10.1111/j.1467-8276.2008.01184.x (2009). [Google Scholar]
- Zhang K. R, Dang, H., Tan, S., Cheng, X. & Zhang, Q. Change in soil organic carbon following the ‘Grain-for-Green’ programme in China. Land Degrad. Dev. 21, 16–28; 10.1002/ldr.954 (2010). [Google Scholar]
- Chen X. G., Zhang X. Q., Zhang Y. P. & Wan C. B. Carbon sequestration potential of the stands under the grain for green program in Yunnan Province, China. For. Ecol. Manage. 258, 199–206; 10.1016/j.foreco.2008.07.010 (2009). [Google Scholar]
- FAO. A framework for land evaluation. Soils Bulletin, vol. 32. (Food and Agricultural Organization of the United Nations, Rome, 1976). [Google Scholar]
- PRC (State Council of the People's Republic of China). Order of State Council of the People's Republic of China (367th): Regulations on conversion of cropland to forests/grassland (available at www.people.com.cn) (2002) Date of access: 06/12/2002.
- Fu B. J., Chen L. D., Ma K. M., Zhou H. F. & Wang J. The relationships between land use and soil conditions in the hilly area of the Loess Plateau in northern Shaanxi, China. Catena 39, 69–78; 10.1016/S0341-8162(99)00084-3 (2000). [Google Scholar]
- Chen L. D. et al. Effect of land-use change conversion on soil organic carbon sequestration in the loess hilly area, Loess Plateau of China. Ecol. Res. 22, 641–648; 10.1007/s11284-006-0065-1 (2007). [Google Scholar]
- Fu X. L., Shao M. A., Wei X. R. & Horton R. Soil organic carbon and total nitrogen as affected by vegetation types in Northern Loess Plateau of China. Geoderma 155, 31–35; 10.1016/j.geoderma.2009.11.020 (2010). [Google Scholar]
- Wei X. R., Shao M. A., Fu X. L. & Horton R. Changes in soil organic carbon and total nitrogen after 28 years of grassland afforestation: effects of tree species, slope position, and soil order. Plant Soil, 331, 165–179; 10.1007/s11104-009-0243-3 (2010). [Google Scholar]
- Deng L., Shangguan Z. P. & Sweeney S. Changes in soil carbon and nitrogen following land abandonment of farmland on the Loess Plateau, China. PloS One 8, e71923; 10.1371/journal.pone.0071923 (2013). [DOI] [PMC free article] [PubMed] [Google Scholar]
- Intergovernmental Panel on Climate Change (IPCC). Land use, Land-use Change, and Forestry: A Special Report. [Watson R., et al. (ed.)] (Cambridge University Press: Cambridge, UK, 2000). [Google Scholar]
- Murty D., Kirschbaum M. U. F., Mcmurtrie R. E. & Mcgilvray H. Does conversion of forest to agricultural land change soil carbon and nitrogen? a review of the literature. Global Change Biol. 8, 105–123; 10.1046/j.1354-1013.2001.00459.x (2002). [Google Scholar]
- Vleeshouwers L. M. & Verhagen A. Carbon emission and sequestration by agricultural land use: a model study for Europe. Globe Change Biol. 8, 519–530; 10.1046/j.1365-2486.2002.00485.x (2002). [Google Scholar]
- Shi S. W., Zhang W., Zhang P., Yu Y. Q. & Ding F. A synthesis of change in deep soil organic carbon stores with afforestation of agricultural soils. For. Ecol. Manage. 296, 53–63; 10.1016/j.foreco.2013.01.026 (2013). [Google Scholar]
- Martens D. A., Reedy T. E. & Lewis D. T. Soil organic carbon content and composition of 130-year crop, pasture and forest land-use managements. Global Change Biol. 10, 65–78; 10.1046/j.1529-8817.2003.00722.x (2003). [Google Scholar]
- Silver W. L., Ostertag R. & Lugo A. E. The potential for carbon sequestration through reforestation of abandoned tropical agricultural and pasture lands. Restor. Ecol. 8, 394–407; 10.1046/j.1526-100x.2000.80054.x (2000). [Google Scholar]
- Karhu K. et al. Effects of afforestation and deforestation on boreal soil carbon stocks: comparison of measured C stocks with Yasso07 model results. Geoderma 164, 33–45; 10.1016/j.geoderma.2011.05.008 (2011). [Google Scholar]
- Smal H. & Olszewska M. The effect of afforestation with Scots pine (Pinus silvestris L.) of sandy post-arable soils on their selected properties. II. Reaction, carbon, nitrogen and phosphorus. Plant Soil 305, 171–187; 10.1007/s11104-008-9538-z (2008). [Google Scholar]
- Morris S., Bohm S., Haile-Mariam S. & Paul E. Evaluation of carbon accrual in afforested agricultural soils. Global Change Biol. 13, 1145–1156; 10.1111/j.1365-2486.2007.01359.x (2007). [Google Scholar]
- Sartori F., Lal R., Ebinger M. H. & Eaton J. A. Changes in soil carbon and nutrient pools along a chronosequence of poplar plantations in the Columbia Plateau, Oregon, USA. Agric. Ecosyst. Environ. 122, 325–339; 10.1016/j.agee.2007.01.026 (2007). [Google Scholar]
- Paul K. I., Polglase P. J., Nyakuengama J. G. & Khanna P. K. Change in soil carbon following afforestation. For. Ecol. Manage. 168, 241–257; 10.1016/S0378-1127(01)00740-X (2002). [Google Scholar]
- Wang J., Fu B. J., Qiu Y. & Chen L. D. Soil nutrients in relation to land use and landscape position in the semi-arid small catchment on the loess plateau in China. J. Arid. Environ. 48, 537–550; 10.1006/jare.2000.0763 (2001). [Google Scholar]
- Del Galdo I., Six J., Peressotti A. & Cotrufo M. F. Assessing the impact of land-use change on soil C sequestration in agricultural soils by means of organic matter fractionation and stable C isotopes. Global Change Biol. 9, 1204–1213; 10.1046/j.1365-2486.2003.00657.x (2003). [Google Scholar]
- Lin C. H., Tu C. L., Lu X. H. & Lin S. X. Soil nitrogen variation features of defarming and wasteland in western karst desertification region, Guizhou province. J. Soil Water Conser. 19, 14–17 (2005). (In Chinese) [Google Scholar]
- Wei X. R. et al. Distribution of soil organic C, N and P in three adjacent land use patterns in the northern Loess Plateau, China. Biogeochemistry 96, 149–162; 10.1007/s10533-009-9350-8 (2009). [Google Scholar]
- Richter D. D., Markewitz D., Trumbore S. E. & Wells C. G. Rapid accumulation and turnover of soil carbon in a re-establishing forest. Nature 400, 56–58; 10.1038/21867 (1999). [Google Scholar]
- Li R., Yang W. Z. & Li B. C. Research and future prospects for the Loess Plateau of China [Li, R., Yang, W.Z. & Li, B.C. (ed.)] [241–242, 305] (Science Press, Beijing, 2008). (In Chinese) [Google Scholar]
- Guo L. B. & Gifford R. M. Soil carbon stocks and land use change: A meta analysis. Global Change Biol. 8, 345–360; 10.1046/j.1354-1013.2002.00486.x (2002). [Google Scholar]
- Wu H. B., Guo Z. T. & Peng C. H. Land use induced changes of organic carbon storage in soils of China. Global Change Biol. 9, 305–315; 10.1046/j.1365-2486.2003.00590.x (2003). [Google Scholar]
Associated Data
This section collects any data citations, data availability statements, or supplementary materials included in this article.
Supplementary Materials
Dataset 1


