

Abstract
We have developed GaitTrack, a phone application to detect health status while the smartphone is carried normally. GaitTrack software monitors walking patterns, using only accelerometers embedded in phones to record spatiotemporal motion, without the need for sensors external to the phone. Our software transforms smartphones into health monitors, using eight parameters of phone motion transformed into body motion by the gait model. GaitTrack is designed to detect health status while the smartphone is carried during normal activities, namely, free-living walking. The current method for assessing free-living walking is medical accelerometers, so we present evidence that mobile phones running our software are more accurate. We then show our gait model is more accurate than medical pedometers for counting steps of patients with chronic disease. Our gait model was evaluated in a pilot study involving 30 patients with chronic lung disease. The six-minute walk test (6MWT) is a major assessment for chronic heart and lung disease, including congestive heart failure and especially chronic obstructive pulmonary disease (COPD), affecting millions of persons. The 6MWT consists of walking back and forth along a measured distance for 6 minutes. The gait model using linear regression performed with 94.13% accuracy in measuring walk distance, compared with the established standard of direct observation. We also evaluated a different statistical model using the same gait parameters to predict health status through lung function. This gait model has high accuracy when applied to demographic cohorts, for example, 89.22% accuracy testing the cohort of 12 female patients with ages 50–64 years.
Key words: : home health monitoring, chronic obstructive pulmonary disease, mobile phones, gait analysis, health monitors, m-health
Introduction
There is no current method to conduct measurements on patients with chronic disease at population scale. Mobile phones have the potential, but only if they can be shown to support medical validity. They are nearly ubiquitous in the United States, with the Pew Internet Project showing 91% ownership1 in May 2013, including 56% with smartphones. These numbers are higher in younger persons,2 but even seniors over 65 years of age have 76% penetration of cell phones.
Mobility itself can be used to continuously monitor movement and predict health status for responsive treatment.3 For ambulatory patients, movement implies walking. Because normal gait is the individual's walking pattern, deviation in gait from normal baseline can indicate change in health status. Harrison's Principles of Internal Medicine states, “Watching a patient walk is the most important part of the neurological examination.”4 Normal gait requires that many systems, including strength, sensation, and coordination, function in an integrated fashion. There are many diagnostic gait features, but the simplest validated measure of personal mobility is gait speed.5 Gait speed has been highlighted as the “sixth vital sign,”6 with longitudinal studies demonstrating strong correlation between gait speed and patient mortality.7
Walk tests are widely used as standard assessment for chronic conditions of the heart and lung, such as congestive heart failure8 and especially chronic obstructive pulmonary disease (COPD).9 A walk test is performed over a fixed time or distance, so that the speed can be easily computed. The most common walk test is the six-minute walk test (6MWT),10 in which patients walk back and forth at their normal speed in a measured hallway for 6 minutes. Low 6MWT distances have been associated with poor clinical outcomes, such as mortality, in patients with COPD.11
In this study we used mobile phones, which are inexpensive and widely available, rather than specialized medical devices. We show that embedded phone sensors are sufficient to monitor patients with chronic disease during walking and other activities in daily living. Our early software directly computed body motion using kinesiology models,12 such as step counts and step frequency. Our GaitTrack software transforms spatial motion of the phone into body motion of the person, with parameters for spatial motion used to compute speed to medically validate against walk tests. Our models move beyond gait speed to gait analysis, using other parameters that capture body motion from physical activities. Our gait model is the start of monitoring health status for patients with chronic disease, including COPD and also asthma.13
Subjects and Methods
Subjects Tested
At the University of Illinois Hospital & Health System in Chicago, we conducted measurements on 30 patients who had chronic lung disease (COPD, asthma, or both). The study was approved by the University of Illinois at Chicago Institutional Review Board under protocol number 2011-0625. The patients first complete a pulmonary function test giving predicted percentage forced expiratory volume in 1 second (FEV1%). Then they perform a 6MWT as per the American Thoracic Society standards,10 while their heart rate and blood oxygen level are monitored using a Nonin (Plymouth, MN) Onyx2® pulse oximeter. During walk tests, patients carry a Samsung (Seoul, Korea) Galaxy Ace smartphone in their pants pocket or in a provided fanny pack, while walking at a comfortable pace back and forth on a 50-foot (approximately 15-m) walkway for 6 minutes. Our GaitTrack software records sensor data from the phone's accelerometer to compute gait parameters, and the actual distance walked is recorded by the research team.
For our prototype phone application, we implemented an interactive monitor to conduct a 6MWT on a midrange Android™ (Google, Mountain View, CA) smartphone, the Samsung Galaxy Ace. As shown in Figure 1, the program runs for 6 minutes, giving voice and vibrating instruction and recording sensor data at 60 Hz, while continuously reading heart rate and blood oxygen level via a Bluetooth® (Bluetooth SIG, Kirkland, WA)-connected pulse oximeter. The software computes strides taken during the test from the accelerometer sensor and stride length from the laps of the walkway. Computed results and sensor data are securely transmitted to our server for further analysis.
Fig. 1.
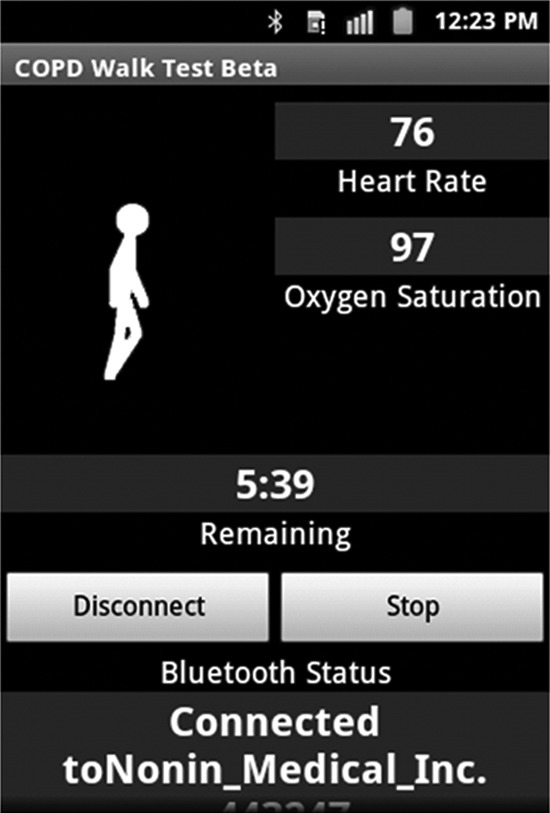
Screen dump from the GaitTrack phone application used to assess chronic obstructive pulmonary disease (COPD) with a six-minute walk test. Sensor data are continuously recorded during the timer countdown. Voice prompts, as per the American Thoracic Society instructions, are given at each minute's mark. The smartphone connects via Bluetooth to a Nonin Onyx2 pulse oximeter with heart rate and oxygen saturation continuously displayed for medical alerts.
Smartphones Versus Medical Accelerometers
Most research with mobile sensors has utilized specialized devices to measure gait for personal diagnosis.14 Such medical accelerometers are devices fixed to the person for clinical evaluation, by measuring motion about the hip. Devices strapped to the L3 stable point in the small of the back15 have been used to evaluate severity of COPD16,17 and congestive heart failure.18
Phones support multiple tasks, which limits the attainable measurement frequency, as opposed to medical devices, which use the same accelerometer technology but are dedicated. Our testing has shown accelerometer data collected during walking contain primarily noise above 5 Hz, with the majority of usable signal between 3 and 5 Hz. Dedicated devices such as the ActiGraph GT3X® (Pensacola, FL) activity monitor,19 a standard medical device for free-living measurement of physical activity, use a low-pass filter to eliminate signals above 10 Hz altogether.20 To maintain medical-grade quality, we require monitor software to attain a 10 Hz sampling frequency of raw accelerometer readings.
In our phone software, we overcome sampling limitations in the firmware, thus transforming mobile phones into monitoring devices. Because the phone is a shared device, the raw sensor sampling rate varies over time, depending on processor load. Signal analysis requires a continuously sampled dataset with a fixed sampling rate. To lock the signal rate, we sample at the maximum attainable frequency and then use averaging and extrapolation to fill in missing values. Although this outputs a good signal comparable to the dedicated device, it also requires processing power on the phone.
Table 1 shows the attainable sampling frequency of the ActiGraph GT3X monitor compared with the Samsung Galaxy Ace, the last-generation midrange smartphone used in our experiments reported here. For comparison, we include the current generation high-end Motorola (Schaumburg, IL) Droid Mini smartphone, being used in our current experiments. Note that the frequency for the ActiGraph is unchanged at all times, but the frequency of the Galaxy Ace is dependent on the load on the phone. Our prototype running on the Galaxy Ace and Droid Mini easily runs at 60 Hz, which is better sampling than our 10 Hz target minimum.
Table 1.
Frequency Capabilities of Phone Hardware
| DEVICE | FREQUENCY WHEN IDLE | FREQUENCY WHEN PLAYING MUSIC |
|---|---|---|
| Motorola Droid Mini | 0–200 Hz | 0–150 Hz |
| Samsung Galaxy Ace | 0–120 Hz | 0–80 Hz |
| ActiGraph GT3X | 20–100 Hz | N/A |
Even with load, phones can match dedicated devices. Both phones easily measure 10 Hz, the threshold of human walking. The Galaxy Ace is a last-generation midrange smartphone, used in the walk tests discussed. The Droid Mini is a current high-end smartphone, used in our current walk tests. The ActiGraph GT3X is an established standard monitoring device for medical evaluation of physical activity.
N/A, not applicable.
Smartphones Versus Medical Pedometers
Accurately measuring distance is deceptively difficult using raw accelerometer data. Minute errors in acceleration cause compounding errors in distance unsuitable for medical measurement. Current commercial devices circumvent this problem by counting steps and multiplying by patient-entered stride length, which is fixed. Pedometers also have a fixed threshold for step frequency, the defined cadence, which undercounts patients with chronic disease who shuffle with lower cadence. Medical pedometers require manual stride length, so measurements for chronic disease have high error in step identification and stride length estimation.21 Data analysis for cell phones can compensate for this error with personalized models, as shown in treadmill experiments with healthy subjects.22
To compute gait speed, we need to know distance from the walktest walkway and also cadence. With a proper algorithm,23 we can use phone sensors to accurately measure step count. We evaluated phone accuracy compared with an Omron (Kyoto, Japan) HJ-720ITC pedometer used in COPD studies.24 The Omron pedometer uses an accelerometer to measure a raw acceleration curve and detect peaks or zero crossings to count steps.25 More precise step detection algorithms utilize postprocessing that tolerates noise more than only detecting peaks.
Our distance model requires accurate step counts and stride length estimation. We assessed the step counting of the GaitTrack phone application against the ActiGraph GT3X and the Omron HJ-720ITC, a reliable step counter for medical tasks26 when placed in the pants pocket.27 We performed a series of 500-step walk tests with four subjects carrying the phone, the ActiGraph, and the Omron in their pants pockets. As shown in Table 2, the error rate of the GaitTrack software on phone is 0.94%, whereas the error of the Omron is 5.20%, and the error of the ActiGraph is 11.08%. This demonstrates phone sensors are comparable to commercial medical pedometers in counting steps, with proper processing during walk tests.
Table 2.
Phone Software Versus Medical Devices
| DEVICE | ERROR RATE |
|---|---|
| GaitTrack phone application | 0.94% |
| Omron HJ-720ITC | 5.20% |
| ActiGraph GT3X | 11.08% |
The GaitTrack phone software is more accurate than a standard medical pedometer (from Omron) and a standard activity monitor (from ActiGraph) for step counts during free-living walking with healthy subjects.
Gait Model from Gait Parameters
The Kyoto University group evaluated validity of Android smartphone sensors for gait analysis, as reported in this journal.28 Their experiments tested 30 subjects who were college students, whereas our experiments tested 30 patients who had chronic lung disease (COPD or asthma). Their subjects walked a 25-m straight walkway, with the middle 20 m recorded. This distance is too short to measure gait variance for our patients; the 6MWT is an order of magnitude longer to assess changes from shortness of breath. As discussed below, our patients essentially walk 20 m in each of 12 segments of 30 seconds analyzed during testing.
Following previous researchers in gait kinesiology,15 the Kyoto University group chose four gait parameters to compute spatial motion from raw phone acceleration: peak frequency, root mean square, autocorrelation coefficient, and coefficient of variance. They later used these to detect abnormal gait in testing patients with rheumatoid arthritis,29 again walking only 20 m.
For continuous monitoring of older patients, especially those with chronic disease, other types of physical activity besides walking are recorded by phone sensors. So the gait model must additionally include parameters to distinguish between walking and non-walking. Our gait model includes four additional parameters, related specifically to body motion, adapted from a foundational study on activity recognition by the Dartmouth University group.30 These four others are mean of acceleration, standard deviation of acceleration, mean crossing rate, and the Shannon entropy of acceleration spectrum in frequency domain. We utilize the Fisher linear kernel for gait parameters to construct an eps-support vector regression model.31 See the summary of eight spatiotemporal gait parameters in Table 3 for the complete input to the gait model.
Table 3.
Gait Model Parameters
| GAIT PARAMETER | ABBREVIATION |
|---|---|
| Average raw acceleration | MeanAcc |
| Standard deviation of raw acceleration | StdAcc |
| Mean crossing rate | MCR |
| Shannon entropy | ENT |
| Peak frequency | PF |
| Root mean square | RMS |
| Autocorrelation coefficient | AC |
| Coefficient of variance | CV |
Listing of the gait parameters used for gait model in the statistical machine learning algorithm, recorded from spatiotemporal phone motion and transformed into body motion for gait analysis.
Predicting Walk Distance
The parameters in the gait model are recorded from phone sensors and used in our model to compute predictions for walk distance.32 Our monitor combines classical methods25 and machine learning solutions using the simple equation:
 |
To eliminate false-positive step identification during non-walking activities, our computation incorporates “activity recognition” to record only during walking. Activity recognition via phone sensors has been studied with small numbers of healthy subjects, with reliable methods to classify different types of movements.33,34 Eliminating non-walking activity increases step counting accuracy over commercial pedometers, reducing overcounting.
Once we have the number of steps, stride length must be estimated to obtain distance. Two approaches are commonly used, called demographic and mechanical. The demographic approach uses a premeasured stride length table with adjustments for height, weight, age, and sex. Patients from each demographic are measured, and an appropriate average stride length is assigned to each category. This method fails to account for variation within cohorts. The mechanical approach uses the inherent structure of walking by applying a lower body model, often a simple triangle, to transform sensor motion during walking to stride length. However, real body movement during walking does not fit these models accurately, and small compounding errors result in large distance errors, even over short testing periods.
We therefore build a regression model to determine the stride length using the eight spatiotemporal parameters from Table 3 and the four demographic parameters listed: age, sex, height, and weight. Once stride length is estimated, we multiply by the identified step count to obtain an estimate of distance walked.
Predicting Health Status
Although our trial contained 30 patients, only 25 patients gave both a successful 6-minute walk distance (6MWD) and predicted FEV1% (adjusted by demographics). Because only 3 of these patients were male, we chose the 22 females for more in-depth analysis.
We did additional exploratory analysis to evaluate whether we can predict the Global Initiative for Chronic Obstructive Lung Disease (GOLD) status35 using this dataset. GOLD status is measured by simple ranges of predicted FEV1% values: GOLD1 (≥80%), GOLD2 (50–79%), GOLD3 (30–49%), and GOLD4 (≤29%). This is an international standard for health status of chronic lung and other disease, based on spirometer measurement.
Once periods of confirmed walking are identified, we use a support vector machine as the classification method to compute health status. The same eight spatiotemporal gait parameters are used for this different statistical model, plus computed cadence. The output label to training set is the GOLD status of each patient, calculated by FEV1% measure.
To make a continuous model, we must calculate spatiotemporal gait parameters over discrete periods of time. Using 10-fold cross-validation, we evaluated different lengths of time, shown in Figure 2, selecting 30 seconds as the optimal length of walking period for prediction accuracy.
Fig. 2.

Prediction accuracy of Global Initiative for Chronic Obstructive Lung Disease (GOLD) status for different walk periods. For the continuous model, the spatiotemporal gait parameters are calculated over discrete periods of time. Thirty seconds of walking is selected as the optimal walk period to balance prediction accuracy with practicality.
Results
Walk Distance
Accelerometer data were collected from 30 patients (mean [SD] age, 53 [11] years; 53% with COPD; 10% male). Mean [SD] predicted FEV1% was 68% [23%]. GaitTrack's 6MWD estimates (mean [SD], 285 m [85 m]) were similar to directly observed estimates (mean [SD], 284 m [90 m]). Mean (95% confidence interval) difference (GaitTrack-observed 6MWD) was 0.3 m (−73 m to 72 m). The absolute mean (95% confidence interval) percentage difference
(|GaitTrack-observed|/observed) was 9%.
The accuracy of the model was analyzed by constructing a Bland–Altman plot, shown in Figure 3, comparing predicted walk distance with observed walk distance. The 95% confidence interval, which was±42 m, produced one patient outlier. This was then omitted in our analysis, significantly reducing the error rate. This outlier was due to equipment failure in early testing.
Fig. 3.

Bland–Altman plot of six-minute walk distance (6MWD) prediction. This demonstrates the accuracy of the gait model as there is only 1 outlier among 30 patients using a 95% confidence interval (42 m). Inspecting this patient's data, we discovered an equipment failure and omitted this data point from our analysis.
We evaluated the remaining 29 patients with chronic lung disease, using our gait model. The model performed with 5.87% error, as shown in Table 4. The model is evaluated by 10-fold cross-validation. We randomize the order of the dataset of the 30-second walking samples. Then we divide the dataset into 10 parts. For each fold, we evaluate the model by selecting one part as a test set and the remaining nine parts as training. This results in all patients contributing equally to the model training.
Table 4.
Measured Versus Predicted Walk Distance
| DISTANCE | VALUE |
|---|---|
| Predicted distance (m) | 275.8 (78.1) |
| Measured distance (m) | 276.2 (76.9) |
| Correlation | 0.9618 |
| p value | <0.001 |
| Absolute error rate (%) | 5.87% (4.82%) |
Patient recordings from walk tests are used to train the model, with 10-fold cross-validation on the 30-second walking samples across all patients. Numbers in parentheses are standard deviations. Walk distance is measured by human observer as established standard, then compared to predicted distance using software computation from gait model, based on gait parameters.
Health Status
The support vector machine model using the gait parameters was used to predict FEV1% (and hence GOLD) for the 22 female COPD patients, whose demographics are shown in Table 5. The results of this model are shown in Table 6, where the unified prediction for all females provided 71.73% accuracy, whereas the cohort prediction of females between the ages of 50 and 64 years provided 89.22% accuracy. The gait model is the same in both cases, but the more specific training set provides higher accuracy. As noted, only female patients had enough samples to analyze, and the only cohort with at least 10 patients was the female middle-age group. Accuracy for particular status was also higher within this cohort; for example, the subcohort with mild COPD was 99% correctly predicted.
Table 5.
Demographic Information of Female Chronic Obstructive Pulmonary Disease Patients
| GOLD1 (≥80 FEV1%) | GOLD2 (50–79 FEV1%) | MORE SEVERE (<50 FEV1%)a | |
|---|---|---|---|
| Number of patients | 6 | 9 | 7 |
| Mean age (years) | 57.3 (7.6) | 62.3 (7.1) | 59.5 |
| Average height (cm) | 154.3 (18.6) | 163.5 (3.2) | 171.3 (8.2) |
| Average weight (kg) | 78.8 (17.1) | 86.4 (30.8) | 74.3 (19.9) |
| Average 6WMD (m) | 306.3 (38.1) | 208.7 (67.5) | 232.8 (65.2) |
Our experiment covered 30 patients with chronic obstructive pulmonary disease and/or chronic asthma. Of these, 25 patients reported both a 6-minute walk distance and percentage forced expiratory volume in 1 second (FEV1%). Although gender is a significant factor, we could only analyze the female demographic because we had 22 females and only 3 males. Data are mean or average (standard deviation) values.
Because individuals with a Global Initiative for Chronic Obstructive Lung Disease (GOLD) rating of 3 and 4 have difficulty walking, these were combined into a “more severe” category.
Table 6.
Support Vector Machine Classification Results with Demographic Cohorts
| UNIFIED PREDICTION (N=22 PATIENTS) | COHORT (50–64 YEARS) PREDICTION (N=12 PATIENTS) | |||||
|---|---|---|---|---|---|---|
| ACTUAL STATUS | GOLD1 | GOLD2 | MORE SEVERE | GOLD1 | GOLD2 | MORE SEVERE |
| GOLD1 | 78.54% | 19.51% | 1.95% | 99.24% | 0 | 0.76% |
| GOLD2 | 16.96% | 65.18% | 17.85% | 0 | 87.63% | 12.37% |
| More severe | 2.96% | 23.47% | 73.57% | 1.23% | 11.6% | 87.16% |
The unified prediction contains all female test subjects across all age ranges and yields 71.73% accuracy. The cohort prediction focuses on subjects in the 50–64-year age range and yields 89.22% accuracy. Demographics can be used to improve model accuracy. More patients must be analyzed to expand the range of demographics covered by our models, to improve the trained model for predicting health status.
GOLD, Global Initiative for Chronic Obstructive Lung Disease.
Discussion
Distance Estimation
To estimate walk distance, we combine gait model parameters with basic demographic information to estimate stride length. Our linear regression model uses the eight gait parameters combined with four demographic features: age and sex, height and weight. This gait model for 29 chronic patients achieved an average error rate of 5.87% in walk test distance prediction, as shown in Table 4.
This is more accurate than the error inherent in the walk test itself, due to varying length of walkways. Although not directly comparable, walkway error gives an indication of acceptable scale. The difference in walk test distance is about 12% error rate, comparing the American Thoracic Society standard 30-m walkway with our 15-m walkway. This is true in healthy seniors36 and COPD patients,37 because of slowdown during turns. Similar rates occur in estimating walking speed with mobile devices.38
Status Estimation
As noted, for sufficient data to predict the GOLD stages from gait parameters, we chose female gender as our cohort group, giving 22 patients who completed the 6MWT and measured FEV1%. Our software implements preprocessing that removes all periods of non-walking for gait analysis.
We expect that demographic information can be used to increase the accuracy of the model. Our smaller dataset from Table 5 contains demographics of one gender group (female) and two age groups (50–64 years and 65–80 years). We constructed a support vector machine model using the gait parameters with all 22 patients and another model using only the 12 patients between the ages of 50 and 64 years. As Table 6 shows, the overall classification accuracy of the younger cohort group is 89.22% compared with 71.73% for the entire group. Thus, clustering patients by age increases the accuracy of the model.
It is especially noteworthy that the model using the eight gait parameters closely predicts GOLD status, whereas the raw walk distance of the patients does not. Note that in Table 5, the average walk distance for the GOLD2 patients was actually lower than the walk distance for the more severe GOLD3 and GOLD4 patients. Therefore, our gait parameters appear to more accurately track a patient's GOLD health status than timed walk tests.
Future Work
A gait model trained with more subjects would enable us to calculate more precise estimates. Ongoing effort is focused on recruiting 120 patients for walk tests. Our previous work32 showed that 12 subjects (6 healthy and 6 with COPD) could be clearly distinguished as COPD and non-COPD, independent of demographics for age and sex. The current work indicates that demographic cohorts can be used to predict GOLD status from gait parameters, given a sufficient number of patients in the cohort. If a cohort of 10 patients is needed for each demographic, then 120 patients may suffice to train a recognizer for GOLD levels (10×4×3). The resulting gait model will be more robust, possibly enabling detection of transitions between status levels, where point of care treatment can improve the quality of healthcare.
Continuous monitors of health status by gait analysis with mobile phones may prove of significant benefit to health systems in the future.
Acknowledgments
This research was funded in part by USDA National Research Initiatives epidemiology grant 2008-04074, with Principal Investigator B.S. At the University of Illinois at Chicago, Melissa Morales and Nina Grude, APN, helped test patients. At the University of Illinois at Urbana-Champaign, the Institute for Genomic Biology provided facilities for software development and data analysis.
Disclosure Statement
No competing financial interests exist.
References
- 1.Pew Internet & American Life Project. Commentary: Mobile tech. Available at http://pewinternet.org/Commentary/2012/February/Pew-Internet-Mobile.aspx (last accessed September2013)
- 2.Fox S, Duggan M. Tracking for health. Pew Internet & American Life Project. January2013. Available at http://pewinternet.org/Reports/2013/Tracking-for-Health.aspx
- 3.Schatz B, Berlin R. Healthcare infrastructure: Health systems for individuals and populations. London: Springer-Verlag, 2011 [Google Scholar]
- 4.Longo D, Fauci A, Kasper D, Hauser S, Jameson J, Loscalzo J. Part 17: Neurologic disorders. In: Harrison's principles of internal medicine, 18th ed. New York: McGraw-Hill, 2011 [Google Scholar]
- 5.Studenski S. Bradypedia: Is gait speed ready for clinical use? J Nutr Health Aging 2009;13:878–880 [DOI] [PubMed] [Google Scholar]
- 6.Fritz S, Lusardi M. White paper: Walking speed: The sixth vital sign. J Geriatr Phys Ther 2009;32:2–5 [PubMed] [Google Scholar]
- 7.Studenski S, Perera S, Patel K, Rosano C, Faulkner K, Inzitari M, Brach J, Chandler J, Cawthon P, Connor E, Nevitt M, Visser M, Kritchevsky S, Badinelli S, Harris T, Newman A, Cauley J, Ferrucci L, Guralnik J. Gait speed and survival in older adults. JAMA 2010;305:50–58 [DOI] [PMC free article] [PubMed] [Google Scholar]
- 8.Pepera G, Sandercock G, Sloan R, Cleland J, Ingle L, Clark A. Influence of step length on 6-minute walk test performance in patients with chronic heart failure. Physiotherapy 2012;98:325–329 [DOI] [PubMed] [Google Scholar]
- 9.Rabinovich R, Louvaris Z, Raste Y, Langer D, Remoortel H, Giavedoni S, Burtin C, Regueiro E, Vogiatzis I, Hopkinson N, Polkey M, Wilson F, Macnee W, Westerterp K, Troosters T; PROactive Consortium. Validity of physical activity monitors during daily life in patients with COPD. Eur Respir J 2013;42:1205–1215 [DOI] [PubMed] [Google Scholar]
- 10.American Thoracic Society. ATS statement: Guidelines for the six-minute walk test. Am J Respir Crit Care Med 2002;166:111–117 [DOI] [PubMed] [Google Scholar]
- 11.Polkey M, Spruit M, Edwards L, Watkins M, Pinto-Plata V, Vestbo J, Calverley P, Tal-Singer R, Agustí A, Bakke P, Coxson H, Lomas D, MacNee W, Rennard S, Silverman E, Miller B, Crim C, Yates J, Wouters E, Celli B; ECLIPSE Study Investigators. Six-minute-walk test in chronic obstructive pulmonary disease: Minimal clinically important difference for death or hospitalization. Am J Respir Crit Care Med 2013;187:382–386 [DOI] [PubMed] [Google Scholar]
- 12.Whittle M. Gait analysis: An introduction, 4th ed. Oxford, United Kingdom: Butterworth Heinemann Elsevier, 2007 [Google Scholar]
- 13.Gunen H, Hacievliyagil S, Kosar F, Gulbas G, Kizkin O, Sahin I. The role of arterial blood gases, exercise testing, and cardiac examination in asthma. Allergy Asthma Proc 2006;27:45–52 [PubMed] [Google Scholar]
- 14.Bryne R, Estambolchilar P, Crossan A. Health monitoring using gait phase effects. Proceedings of the 3rd ACM Conference on Pervasive Technologies Related to Assistance Environments (PETRA) New York: ACM, 2010;19:1–7 [Google Scholar]
- 15.Moe-Nilssen R, Helbostad J. Estimation of gait cycle characteristics by trunk accelerometry. J Biomech 2004;37:121–126 [DOI] [PubMed] [Google Scholar]
- 16.Annegarn J, Spruit MA, Savelberg HH, Willems PJ, van de Bool C, Schols AM, Wouters EF, Meijer K. Differences in walking pattern during 6-min walk test between patients with COPD and healthy subjects. PLOS One 2012;7:e37329. [DOI] [PMC free article] [PubMed] [Google Scholar]
- 17.Van Remoortel H, Raste Y, Louvaris Z, Giavedoni S, Burtin C, Langer D, Wilson F, Rabinovich R, Vogiatzis I, Hopkinson NS, Troosters T; PROactive Consortium. Validity of six activity monitors in chronic obstructive pulmonary disease: A comparison with indirect calorimetry. PLOS One 2012;7:e39198. [DOI] [PMC free article] [PubMed] [Google Scholar]
- 18.Jehn M, Schmidt A, Schuster T, Hanssen H, Weis M, Halle M, Koehler F. Accelerometer-based quantification of 6-minute walk test performance in patients with chronic heart failure: Applicability to telemedicine. J Cardiac Fail 2009;15:334–340 [DOI] [PubMed] [Google Scholar]
- 19.Sasaki JE, John D, Freedson PS. Validation and comparison of ActiGraph activity monitors. J Sci Med Sports 2011;14:411–416 [DOI] [PubMed] [Google Scholar]
- 20.John D, Freedson P. ActiGraph and Actical physical activity monitors: A peek under the hood. Med Sci Sports Exerc 2013;44(1 Suppl 1):S86–S89 [DOI] [PMC free article] [PubMed] [Google Scholar]
- 21.Turner LJ, Houchen L, Williams J, Singh SJ. Reliability of pedometers to measure step counts in patients with chronic respiratory disease. J Cardiopulm Rehabil 2012;32:284–291 [DOI] [PubMed] [Google Scholar]
- 22.Carlson R, Huebner D, Hoarty C, Whittington J, Haynatzki G, Balas M, Schenk A, Goulding E, Potter J, Bonasera S. Treadmill gait speeds correlate with physical activity counts measured by cell phone accelerometers. Gait Posture 2012;36:241–248 [DOI] [PMC free article] [PubMed] [Google Scholar]
- 23.Zhong S, Wang L, Bernardos AM, Mei S. An accurate and adaptive pedometer integrated in mobile health application. IET International Conference on Wireless Sensor Networks Beijing, China: IET-WSN, 2010;78–83 [Google Scholar]
- 24.Moy M, Weston N, Wilson E, Hess M, Richardson C. A pilot study of an Internet walking program and pedometer in COPD. Respir Med 2012;106:1342–1350 [DOI] [PubMed] [Google Scholar]
- 25.Zijlstra W, Hof AL. Assessment of spatio-temporal gait parameters from trunk accelerations during human walking. Gait Posture 2003;18:1–10 [DOI] [PubMed] [Google Scholar]
- 26.Holbrook E, Barreira TV, Kang M. Validity and reliability of Omron pedometers for prescribed and self-paced walking. Med Sci Sports Exerc 2009;41:669–673 [DOI] [PubMed] [Google Scholar]
- 27.Silcott N, Bassett D, Thompson D, Fitzhugh E, Steeves J. Evaluation of the Omron HJ-720ITC pedometer under free-living conditions. Med Sci Sports Exerc 2011;43:1791–1797 [DOI] [PubMed] [Google Scholar]
- 28.Nishiguchi S, Yamada M, Nagai K, Mori S, Kajiwara Y, Sonoda T, Yoshimura K, Yoshitomi H, Ito H, Okamoto K, Ito T, Muto S, Ishihara T, Aoyama T. Reliability and validity of gait analysis by Android-based smartphone. Telemed e-Health 2012;18:292–296 [DOI] [PubMed] [Google Scholar]
- 29.Yamada M, Aoyama T, Mori S, Nishiguchi S, Okamoto K, Ito T, Muto S, Ishihara T, Yoshitomi H, Ito H. Objective assessment of abnormal gait in patients with rheumatoid arthritis using a smartphone. Rheumatol Int 2011;32:3869–3874 [DOI] [PubMed] [Google Scholar]
- 30.Lu H, Yang J, Liu Z, Lane N, Choudhury T, Campbell A. The Jigsaw continuous sensing engine for mobile phone applications. Proceedings of the 8th ACM Conference on Embedded Networked Sensor Systems (SENSYS) New York: ACM, 2010;71–84 [Google Scholar]
- 31.Vapnik VN. An overview of statistical learning theory. IEEE Trans Neural Netw 1999;10:988–999 [DOI] [PubMed] [Google Scholar]
- 32.Cheng Q, Juen J, Li Y, Prieto-Centurion V, Krishnan J, Schatz B. GaitTrack: Health monitoring of body motion from spatio-temporal parameters of simple smart phones. Proceedings of the 4th ACM Conference on Bioinformatics, Computational Biology, Biomedical Informatics (BCB), Health Informatics Symposium New York: ACM, 2013;897–906 [Google Scholar]
- 33.Cao H, Nguyen M, Phua C, Krishnaswamy K, Li X. An integrated framework for human activity classification. Proceedings of the 14th ACM Conference on Ubiquitous Computing (UbiComp 2012) New York: ACM, 2012;331–340 [Google Scholar]
- 34.Kwapisz JR, Weiss GM, Moore SA. Cell phone-based biometric identification. Proceedings of the 4th International Conference on Biometrics: Theory, Applications and Systems (BTAS) Piscataway, NJ: IEEE, 2010;1–7 [Google Scholar]
- 35.Global Initiative for Chronic Obstructive Lung Disease (GOLD). Outpatient management reference for COPD. Available at www.goldcopd.org/guidelines-copd-diagnosis-and-management.html (last accessed November2013)
- 36.Ng S, Yu P, To F, Chung J, Cheung T. Effect of walkway length and turning direction on the distance covered in the 6-minute walk test among adults over 50 years of age: A cross-sectional study. Physiotherapy 2013;99:63–70 [DOI] [PubMed] [Google Scholar]
- 37.Beekman E, Mesters I, Hendriks E, Klaasen M, Gosselink R, Schayck O, de Bie R. Course length of 30 metres versus 10 metres has a significant influence on six-minute walk distance in patients with COPD: An experimental crossover study. J Physiother 2013;59:169–176 [DOI] [PubMed] [Google Scholar]
- 38.Park J, Patel A, Curtis D, Teller S, Ledlie J. Online pose classification and walking speed estimation using handheld devices. Proceedings of the 14th ACM Conference on Ubiquitous Computing (UbiComp 2012) New York: ACM, 2012;113–122 [Google Scholar]