Abstract
Purpose
The goal of the current study was to determine dominant factors affecting treatment response in pancreatic cancer photodynamic therapy (PDT), based on clinically available information in the VERTPAC-01 trial. This trial investigated the safety and efficacy of verteporfin PDT in 15 patients with locally advanced pancreatic adenocarcinoma.
Methods
CT scans before and after contrast enhancement from the 15 patients in the VERTPAC-01 trial were used to determine venous-phase blood contrast enhancement and this was correlated with necrotic volume determined from post-treatment CT scans, along with estimation of optical absorption in the pancreas for use in light modeling of the PDT treatment. Energy threshold contours yielded estimates for necrotic volume based on this light modeling.
Results
Both contrast-derived venous blood content and necrotic volume from light modeling yielded strong correlations with observed necrotic volume (R2=0.85 and 0.91, respectively). These correlations were much stronger than those obtained by correlating energy delivered vs. necrotic volume in the VERTPAC-01 study and in retrospective analysis from a prior clinical study.
Conclusions
This demonstrates that contrast CT can provide key surrogate dosimetry information to assess treatment response. It also implies that light attenuation is likely the dominant factor in the VERTPAC treatment response, as opposed to other factors such as drug distribution. This study is the first to show that contrast CT provides needed surrogate dosimetry information to predict treatment response in a manner which uses standard-of-care clinical images, rather than invasive dosimetry methods.
Keywords: photodynamic therapy, dosimetry, NIRFAST, optical modeling
1. Introduction
Pancreatic cancer is the fourth leading cause of cancer-related death in the United States [1], with an estimated 37,390 deaths from the disease in 2012. The overall 5-year survival rate is estimated at 5.8%, and treatment options are limited, with surgical removal as an option for only 15% of patients [2]. Patients unable to undergo surgery are generally treated with chemotherapeutics which offer marginal improvements in survival, and thus an urgent need exists for alternative strategies to treat pancreatic cancer more effectively.
Photodynamic therapy is a minimally invasive and nontoxic method of treating cancer using the interaction of light and a photosensitizer, in the presence of oxygen, to kill tumor cells [3]. A photosensitizer is a drug, usually injected intravenously, that is activated by a specific wavelength of light. Activation produces singlet oxygen from molecular oxygen which in turn causes necrosis [4]. There is also indirect cell death caused by induced hypoxia through tumor vasculature damage. Since the effect is photochemical, rather than thermal, there is no significant damage to connective tissues [5].
There is a thresholding effect in photodynamic therapy for causing cell death, based on the number of photons absorbed by the photosensitizer [6]. It is not plausible to measure this threshold value accurately in vivo, due to the complexity of tissue optics and heterogeneity. The degree of necrosis is determined by photosensitizer dose and distribution, light dose, and tissue oxygenation [7]. When necrosis is achieved, the thresholding effect creates a sharp boundary to the necrotic region [8, 9]. A major hindrance in identifying the appropriate threshold value is the lack of in vivo light dosimetry information, due in part to the difficulties associated with finding consistent tissue optical properties [3]. Furthermore, there are vital structures very close to the pancreas such as the stomach, major blood vessels, biliary tree, and duodenum. Although necrosis has been shown to heal safely in some of these structures, there is a potential risk of significant complications [10]. Thus it would be valuable to provide an estimator for patient treatment response to photodynamic therapy based on the threshold of necrosis, with the intent of informing treatment parameters to achieve improved treatment outcomes. There are several examples of using multi-modal imaging for dosimetry applications in photodynamic therapy. Contrast-enhanced MR has been used to assess treatment response based on devascularized tissue [11]. Similarly, MR-based necrosis measurements have been used to correlate energy delivered with the extent of necrosis [12]. The use of contrast CT information for dosimetry in photodynamic therapy is an application of multi-modal medical imaging for pre-treatment planning with significant potential.
A common reason for surgery not being an option in patients with pancreatic cancer is tumor involvement of major blood vessels, including the superior mesenteric and portal veins [10]. The prevention of vascular damage further motivates the need for a good predictor of the extent of necrosis produced by photodynamic therapy, to provide a viable treatment option in these cases. This paper presents an analysis of 15 patients with locally advanced pancreatic cancer treated with photodynamic therapy, and estimates the extent of treatment response based on information derived from contrast CT scans. Robust predictors of treatment response could reduce the risk of damage to healthy tissue, as well as increase the chance of full tumor treatment in pancreatic cancer.
2. Materials & Methods
The VERTPAC-01 trial investigated the safety and efficacy of PDT in 15 patients with locally advanced pancreatic adenocarcinoma [13]. Verteporfin was used as the photosensitizer, with Benzoporphyrin Derivative as the photoactive constituent. Light at 690nm was delivered via a light-emitting diffusing-cylindrical tip fiber through transcutaneous needles into the tumor lesions. For 13 of the patients, a single 1cm tip fiber was used. For one patient, 3 fibers were used of length 2cm each. For one patient, 2 fibers were used of length 1cm each. The energy delivered per cm of fiber length was increased in a dose escalation protocol from 5J/cm for 3 patients, 10J/cm for 3 patients, 20J/cm for 3 patients, and 40J/cm for the remaining 6 patients.
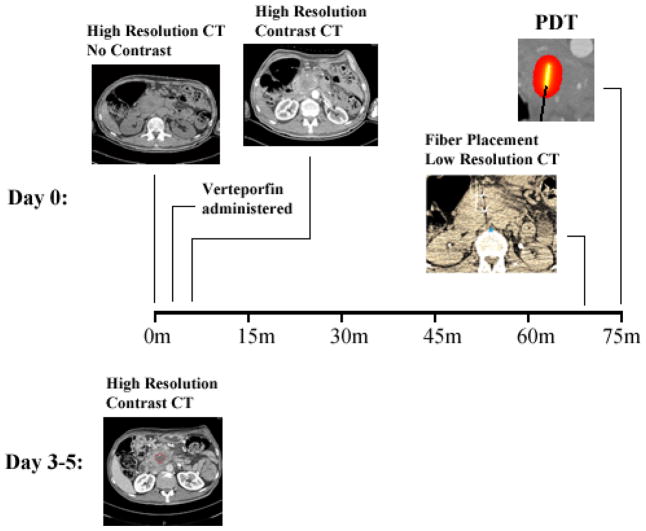
Figure 1 outlines the imaging, treatment, and follow-up process for the study. High resolution contrast and non-contrast CT scans were acquired approximately 60–90 minutes prior to treatment for each patient.
Figure 1.
Patient imaging and treatment workflow. The initial two scans are high resolution, pre- and post-contrast. The lower resolution scan shows the fiducial markers on the fiber, evident in the CT scan as two bright spots with star artifacts from x-ray beam hardening. The post-treatment contrast CT scan shows necrotic tissue as a dark area, circled in red on the scan. The scans are all of axial orientation.
The contrast scans were obtained for both arterial and venous phases. In addition to these scans, several low resolution CT scans were acquired about the plane of the tumor location to aid in needle/fiber placement. The limited volume captured by these low resolution scans was chosen to limit radiation dose to the patients. Verteporfin is cleared rapidly, leading to a short period of photosensitivity [13], and thus patients were treated approximately 60–90 minutes after administration. Post-treatment high resolution contrast CT scans to identify response were taken 3–5 days after treatment, in arterial and venous phase. The pre-treatment contrast CT scans were used to estimate values for arterial and venous blood content in the pancreas tissue as well as the blood vessels. Venous blood content was calculated as
| (1) |
where vtissue, ven is the difference between the mean grayscale value in the region of interest in the venous contrast scan and the non-contrast scan, and vblood, ven is the difference between the mean grayscale value in a major blood vessel (the superior mesenteric is used as reference) in the venous contrast scan and the non-contrast scan. The region of interest is chosen to match the tumor tissue region as accurately as possible. This is done using manual delineation on the pre-treatment contrast CT scans, where the tumor region shows characteristic contrast compared with the surrounding tissue. This approach of calculating venous blood content assumes that the difference value in blood corresponds to 100% blood content, and thus the difference values in tissue regions scale blood content relative to this value. Arterial blood content was calculated similarly using the arterial phase scans. Factors such as body movement and the use of a needle-placement grid placed on the patient caused significant registration differences between pre- and post-contrast CT scans. The high degree of deformation made image registration intractable. Optical heterogeneity in the surrounding pancreatic tissue around the light-emitting fiber caused less than a 1% difference in light dose map calculations as compared with using bulk optical properties in these regions, and so homogeneous optical properties were assigned in these regions using the calculations described above.
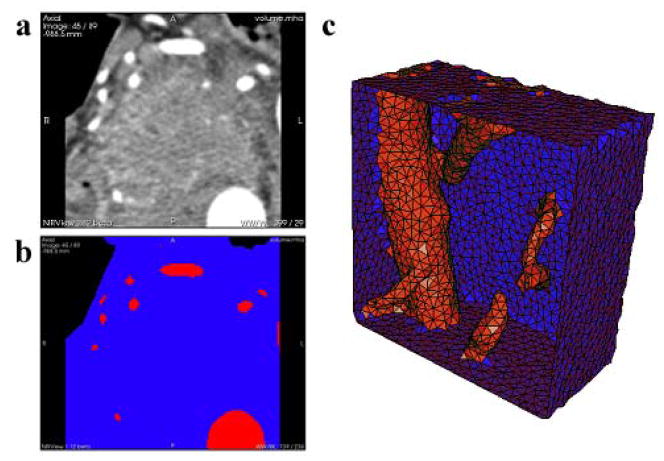
To investigate the ability to predict treatment response using light-dose modeling, the CT images were converted into numerical meshes suitable for light propagation calculations. This was accomplished using image processing and mesh creation techniques described in previous work [14], which describes how CT scans were used to create 2D masks of tissue types, and subsequently a 3D tetrahedral mesh. All image processing and modeling was done using NIRFAST [15, 16], an open-source light modeling package. Figure 2 shows the tissue segmentation alongside the original medical images for a representative patient, and the resulting tetrahedral mesh. The volume considered contains the pancreas and nearby blood vessels, and was chosen to be large enough to ensure the boundaries have little effect on the light propagation modeling in the regions of interest.
Figure 2.
(a) A single axial DICOM slice of the pancreas and surrounding tissue is shown from the pre-treatment contrast CT scans. Bright areas are indicative of contrast enhanced major blood vessels, while the dark areas in the top left and top right are air. (b) Segmentation of the same axial slice into different regions based on tissue type: blue is pancreatic or surrounding tissue, red is blood vessels, and black is air. (c) Rendering of a 3D tetrahedral mesh of the pancreas and surrounding tissue in blue, and blood vessels in red. It is clipped by a plane to visualize the interior of the mesh.
The venous and arterial blood content values were used to estimate optical absorption in the pancreas tissue and blood vessels based on known chromophore extinction spectra and estimates of venous and arterial oxygenation, in the following manner:
| (2) |
| (3) |
| (4) |
Here CdeoxyHb and CHbO are the concentration of deoxy-hemoglobin and oxy-hemoglobin respectively. RSO2, ven and RSO2, art are the blood oxygen saturation for venous and arterial phase, using literature values of 0.70 and 0.99 respectively [17–21]. ε is the molar absorption coefficient for each absorber at the wavelength of light used. Literature values of 0.5mm−1 and 0.98mm−1 were used for the reduced scattering coefficient in blood vessels and pancreatic tissue respectively [22–25]. These optical properties were assigned in the numerical mesh and the light distribution from the diffusing-tipped fibers was calculated using NIRFAST, producing a light fluence field around the fiber location. Fluence fields were then converted into maps of light dose by scaling to the total energy distributed for each patient.
The post-treatment CT scans were used to identify the region of necrosis caused by treatment, distinguished as a dark area around the fiber location. Using guidance from radiologist-determined values of the two major diameters of necrosis, the necrotic volume was estimated for each patient. These measurements of the necrotic region were made by multiple radiologists, to ensure accurate necrotic volume estimation.
3. Results
Figure 3 (a) shows a representative image for obtaining the necrotic volume for the post-treatment CT scan for one patient. Necrotic volumes determined for all patients, categorized by light energy delivered, are plotted in Fig. 3 (b).
Figure 3.
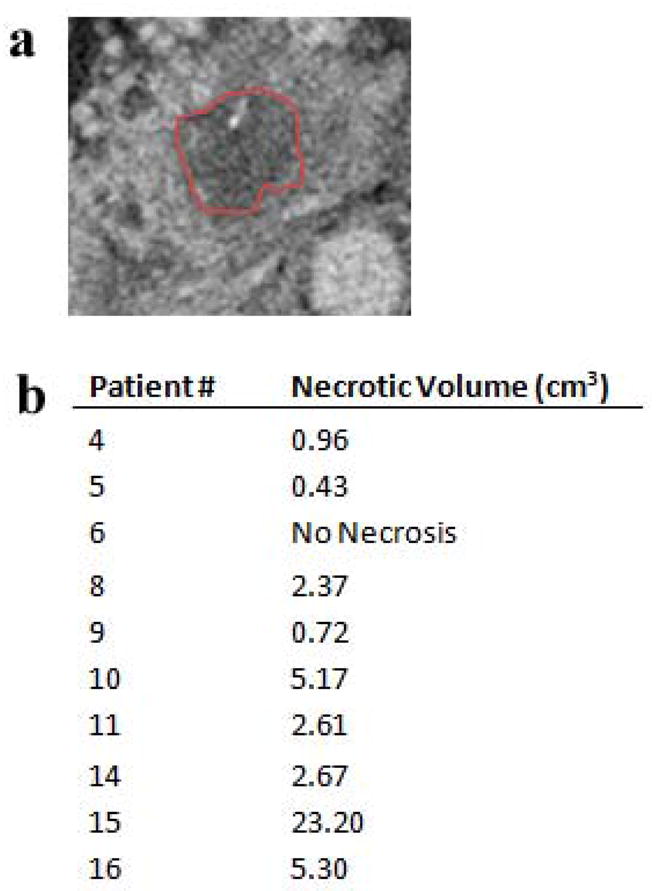
(a) An axial slice of the pancreas from post-treatment CT scans, with the indicated area in the center as necrotic tissue. (b) The volume of the necrotic tissue region is shown for each patient in the study, determined from the segmentations of the post-treatment CT scans.
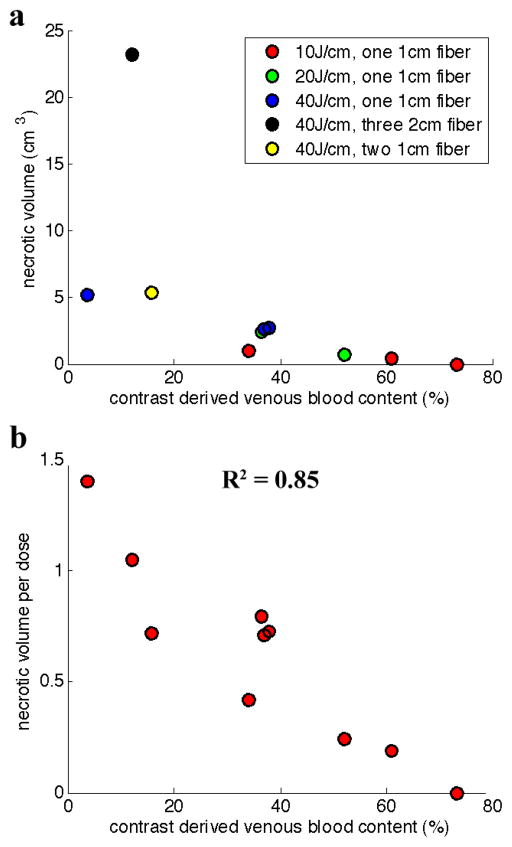
Figure 4 (a) shows a plot of necrotic volume plotted as a function of the venous blood content values derived from contrast CT information. The three patients administered 5J/cm energy of light were omitted from analysis because there was no visible necrosis in the post-treatment scans, under the presumption that this energy level was too low to produce necrosis in human tissue. Patient 7, administered 20J/cm, was omitted because no pre-treatment arterial scan was acquired for that patient. Patient 12 was omitted because pre-existing necrosis prior to treatment hampered the ability to measure necrosis caused by treatment. These data were re-analyzed by normalizing the necrotic volume based on energy delivered. Normalized necrotic volumes are plotted vs. venous blood content in Fig. 4 (b). This approach produces a very high correlation between these parameters (R2 = 0.85). Arterial blood content showed no significant correlation with necrotic volume, giving an R2 value of 0.22.
Figure 4.
(a) Correlating necrotic volume with venous blood content, as derived from the contrast CT scans. (b) Necrotic volume is normalized as V/(n*d*log(E)), where V is the necrotic volume in cm3, n is the number of fibers used in treatment, d is the fiber size in cm, and E is the energy delivered over the fiber in J/cm. This is then correlated with the contrast derived venous blood content.
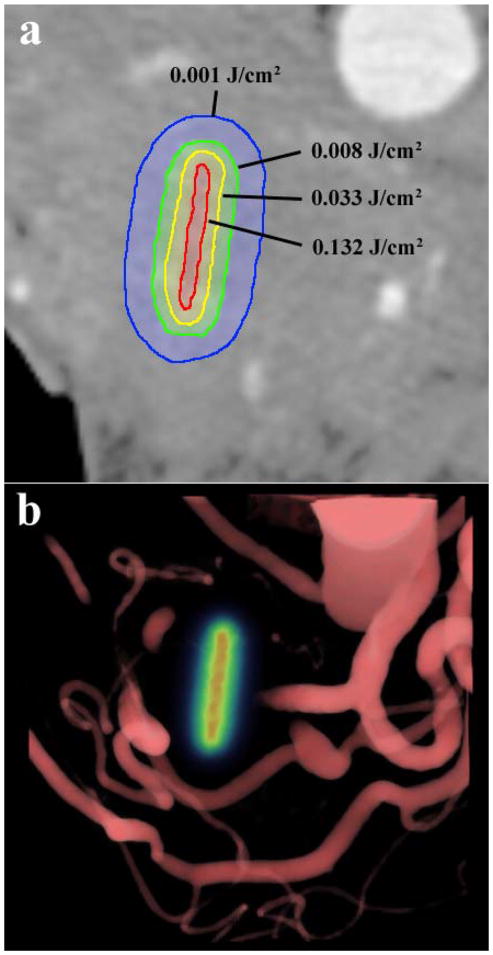
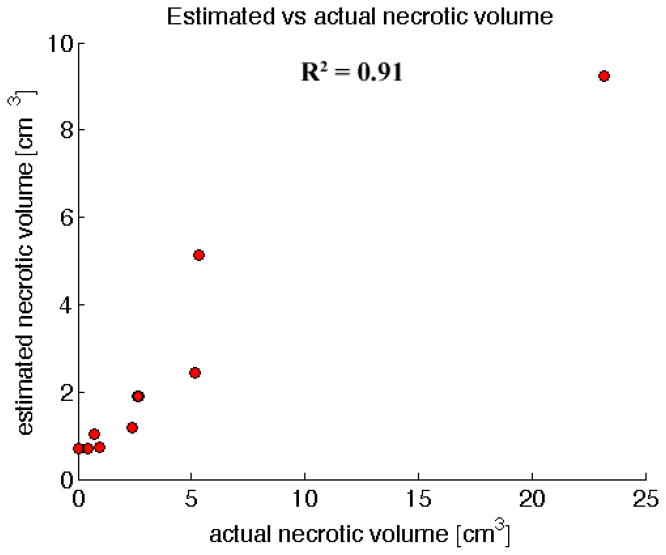
The light dose maps produced from light modeling can be used to estimate necrotic volume provided a suitable energy threshold value is determined. In this study, the threshold value is unknown, therefore, we determined the threshold value which exhibited the strongest correlation between predicted and measured volume of necrosis. This value was found to be 0.003J/cm3, and defines a 3D contour of values greater than the threshold in the 3D light dose maps for each patient, which then defines an estimated volume of necrosis. Figure 5 shows visualizations of the light dose contours in a patient produced by light modeling, for use in estimating necrotic volume. Figure 6 demonstrates the strong correlation between predicted and measured necrotic volume using this value.
Figure 5.
(a) A single axial slice of the pancreas from the pre-treatment CT scans is overlaid with computed contours of light fluence levels around the fiber location. This was simulated using blood content information for tissue absorption from contrast CT. (b) A volume rendering of the blood vessels around the pancreas overlaid with the light dose map in the fiber location, in the same patient.
Figure 6.
Correlating actual necrotic volume with the estimated necrotic volume from light modeling, using absorption values estimated from contrast CT information and literature values for scattering. A particular energy threshold, 0.003J/cm3, with the highest correlation was picked to determine the estimated necrotic volume using the contour defined by this threshold.
4. Discussion
Contrast derived venous blood content shows a high correlation with necrotic volume, with an R2 = 0.85. This suggests that the optical attenuation produced by venous blood content is a dominant factor in treatment response to photodynamic therapy in the pancreas as opposed to photosensitizer concentration. The high negative correlation with venous blood content indicates that drug variation didn’t have a significant effect on treatment response. This suggests that drug distribution was reasonably uniform. Thus parameters such as photosensitizer dose, time interval between administration and treatment, and vascular properties will be important to consider in obtaining a similarly strong correlation in different organs or with different photosensitizers. A strong correlation was observed between the volume of necrosis calculated using this surrogate estimate of venous blood content and standard light modeling tools and that measured by post-treatment CT, with an R2 = 0.91. This observation indicates that light attenuation, specifically that derived from venous blood, dictates the treatment volume for this therapy, and implies that this response can be reliably predicted using contrast CT. This would represent a major breakthrough in PDT for pancreas cancer and could facilitate light dose administration tailored to individual patients with significantly less effort than using invasive or time consuming dosimetry measurements.
A prior clinical pilot study for the use of photodynamic therapy with mTHPC in the treatment of pancreatic cancer using similar methods reported necrotic volume and energy delivered for 16 patients [10]. In a retrospective analysis of their data, correlating the logarithm of energy delivered vs. necrotic volume of their patients resulted in a linear fit with R2 = 0.37. This value was larger than without taking the logarithm, so was the best fit, but still clearly indicates a low linear fit quality. Similarly, correlating the logarithm of energy delivered vs. necrotic volume in the VERTPAC-1 study gives R2 = 0.67. Thus, both of these values are considerably weaker than the R2 values reported herein using contrast CT as a surrogate for the deposited dose. This suggests that there is significant value in using contrast derived venous blood content to aid in predicting necrotic volume produced by treatment, rather than relying on estimates based upon energy delivered. It is important to note that there is often post-treatment swelling associated with photodynamic therapy, a phenomenon which occurs frequently in interstitial procedures. No swelling data was available in this study; however it may be useful to study the effect of swelling on the observed correlations, particularly with regard to calculating necrotic volume from the post-treatment CT scans.
The implications of this study are important, because acceptance of PDT is at least partially limited by the complexity of having to manage drug and light doses separately, and the extreme complexity which can go into dose verification measurements. There have been very complex arrangements to measure drug levels in vivo, in several clinical trials, and while scientifically outstanding, are often so complex or expensive that they become inhibitive to advancing the clinical implementation of PDT. The concept tested in this study was to see if simpler clinical data could provide a surrogate measurement, and this seems to be the case. The surrogate measurement here appears correlated to blood volume, which is not well defined, but suggests that perhaps the attenuation from light is the major factor. One might think that higher blood volume would lead to better drug perfusion of the tumor, yet if that were true the tumors with higher blood volume might have more treatment effect. Since the opposite seems to be true here, this indicates that drug perfusion is a minor factor in the planning of treatment delivery, and so measurement of this parameter might be neglected in future work. Light delivery is hypothesized to be the dominant factor, and so a future prospective study might investigate delivering more light to those tumors which have higher venous contrast. This would test if the light delivery is the limiting factor, and lead to better treatment efficacy for more perfused tumors.
5. Conclusion
In summary, information from contrast CT provides the opportunity to assist in pre-treatment planning for photodynamic therapy of pancreatic cancer. Contrast derived venous blood content displays a significant correlation with necrotic volume, with high correlation, indicating that light attenuation is the dominant factor in treatment response in the pancreas. Concomitantly, light modeling has the ability to determine this contribution and possibly yield further improvement in estimating necrotic volume, with an R2 value of 0.91. Due to the presence of important structures in and around the pancreas, such as major blood vessels and the stomach wall, predicting the extent of necrosis is valuable in avoiding damage to these structures. Estimation of treatment response will also provide more confidence in treating the entire tumor, which will potentially improve the efficacy of this minimally invasive and nontoxic alternative to surgery for treating locally advanced cancer in the pancreas.
Acknowledgments
This work has been funded by P01 CA84203 (TH, BWP, SPP, MJ), RO1 CA132750 (BWP, HD, SCD, MJ), Department of Defense award W81XWH-09-1-0661 (SCD), and a Neukom Graduate Fellowship (MJ).
Footnotes
Conflict of interest: None.
References
- 1.Hariharan D, Saied A, Kocher HM. Analysis of mortality rates for pancreatic cancer across the world. HPB (Oxford) 2008;10(1):58–62. doi: 10.1080/13651820701883148. [DOI] [PMC free article] [PubMed] [Google Scholar]
- 2.Howlader N, Noone AM, Krapcho M, Neyman N, Aminou R, Altekruse SF, Kosary CL, Ruhl J, Tatalovich Z, Cho H, Mariotto A, Eisner MP, Lewis DR, Chen HS, Feuer EJ, Cronin KA. SEER Cancer Statistics Review. National Cancer Institute; 2012. [Google Scholar]
- 3.Wilson BC, Patterson MS. The physics of photodynamic therapy. Phys Med Biol. 1986;31:327–360. doi: 10.1088/0031-9155/31/4/001. [DOI] [PubMed] [Google Scholar]
- 4.Weishaupt KR, Gomer CJ, Dougherty TJ. Identification of singlet oxygen as the cytotoxic agent in photo-inactivation of a murine tumor. Cancer Res. 1976;36:2325–2329. [PubMed] [Google Scholar]
- 5.Barr H, Tralau CJ, Boulos PB, MacRobert AJ, Tilly R, Bown SG. The contrasting mechanisms of colonic collagen damage between photodynamic therapy and thermal injury. Photochem Photobiol. 1987;46(5):795–800. doi: 10.1111/j.1751-1097.1987.tb04850.x. [DOI] [PubMed] [Google Scholar]
- 6.Patterson MS, Wilson BC, Graff R. In vivo tests of the concept of photodynamic threshold dose in normal rat liver photosensitized by aluminum chlorosulphonated phthalocyanine. Photochem and Photobiol. 1990;51(3):343–349. doi: 10.1111/j.1751-1097.1990.tb01720.x. [DOI] [PubMed] [Google Scholar]
- 7.van Gemert JC, Berenbaum MC, Gijsberg GHM. Wavelength and light-dose dependence in tumour phototherapy with haematoporphyrin derivative. Br J Cancer. 1985;52:43–49. doi: 10.1038/bjc.1985.146. [DOI] [PMC free article] [PubMed] [Google Scholar]
- 8.Berenbaum MC, Bonnett R, Scourides PA. In vivo biological activity of the components of haematoporphyrin derivative. Br J Cancer. 1982;45:571–581. doi: 10.1038/bjc.1982.94. [DOI] [PMC free article] [PubMed] [Google Scholar]
- 9.Potter WR. PDT dosimetry and response. Photodynamic Therapy: Mechanisms (SPIE) 1989:88–99. [Google Scholar]
- 10.Bown SG, Rogowska AZ, Whitelaw DE, Lees WR, Lovat LB, Ripley P, Jones L, Wyld P, Gillams A, Hatfield WR. Photodynamic therapy for cancer of the pancreas. Gut. 2002;50(4):549–557. doi: 10.1136/gut.50.4.549. [DOI] [PMC free article] [PubMed] [Google Scholar]
- 11.Haider MA, Davidson SR, Kale AV, Weersink RA, Evans AJ, Toi A, Gertner MR, Bogaards A, Wilson BC, Chin JL, Elhilali M, Trachtenberg J. Prostate gland: MR imaging appearance after vascular targeted photodynamic therapy with palladium-bacteriopheophorbide. Radiology. 2007;244(1):196–204. doi: 10.1148/radiol.2441060398. [DOI] [PubMed] [Google Scholar]
- 12.Betrouni N, Lopes R, Puech P, Colin P, Mordon S. A model to estimate the outcome of prostate cancer photodynamic therapy with TOOKAD Soluble WST11. Phys Med Biol. 2011;56(15):4771–83. doi: 10.1088/0031-9155/56/15/009. [DOI] [PubMed] [Google Scholar]
- 13.Huggett MT, Jermyn M, Gillams A, Mosse S, Kent E, Bown SG, Hasan T, Pogue BW, Pereira SP. Photodynamic therapy of locally advanced pancreatic cancer (VERTPAC study): final clinical results. SPIE Proc Paper. 2013:8568–49. [Google Scholar]
- 14.Jermyn M, Davis SC, Dehghani H, Huggett M, Hasan T, Pereira SP, Pogue BW. Photodynamic therapy light dose analysis of a patient based upon arterial and venous contrast CT scan information. SPIE Proc Paper. 2013:8568–10. [Google Scholar]
- 15.Dehghani H, Eames ME, Yalavarthy PK, Davis SC, Srinivasan S, Carpenter CM, Pogue BW, Paulsen KD. Near infrared optical tomography using NIRFAST: Algorithm for numerical model and image reconstruction. Communications in Numerical Methods in Engineering. 2009;25:711–732. doi: 10.1002/cnm.1162. [DOI] [PMC free article] [PubMed] [Google Scholar]
- 16.Jermyn M, Pogue BW, Ghadyani H, Davis SC, Mastanduno M, Dehghani H. Biomedical Optics, OSA Technical Digest, paper BW1A.7. Optical Society of America; 2012. A User-Enabling Visual Workflow for Near-Infrared Light Transport Modeling in Tissue. [Google Scholar]
- 17.Baele PL, McMichan JC, Marsh HM, Sill JC, Southorn PA. Continuous monitoring of mixed venous oxygen saturation in critically ill patients. Anesth Analg. 1982;61(6):513–517. [PubMed] [Google Scholar]
- 18.Miller M. Tissue oxygenation in clinical medicine: an historical review. Anesth Analg. 1982;61(6):527–535. [PubMed] [Google Scholar]
- 19.Huckabee W. Metabolic consequences of chronic hypoxia. Ann NY Acad Sci. 1965;121:723–730. doi: 10.1111/j.1749-6632.1965.tb14240.x. [DOI] [PubMed] [Google Scholar]
- 20.Stainsby W, Otis A. Blood flow, blood oxygen tension, oxygen uptake and oxygen transport in skeletal muscle. Am J Physiol. 1964;206:858–866. doi: 10.1152/ajplegacy.1964.206.4.858. [DOI] [PubMed] [Google Scholar]
- 21.Edwards Lifesciences. 2. 2002. Understanding continuous mixed venous oxygen saturation (SvO2) monitoring with the swan-ganz oximetry TD system. [Google Scholar]
- 22.Wilson RH, Chandra M, Scheiman J, Simeone D, McKenna B, Purdy J, Mycek M. Optical spectroscopy detects histological hallmarks of pancreatic cancer. Optics Express. 2009;17(20):17502. doi: 10.1364/OE.17.017502. [DOI] [PubMed] [Google Scholar]
- 23.Sandell JL, Zhu TC. A review of in-vivo optical properties of human tissues and its impact on PDT. Journal of Biophotonics. 2011;4(11–22):773–787. doi: 10.1002/jbio.201100062. [DOI] [PMC free article] [PubMed] [Google Scholar]
- 24.Cheong W, Prahl SA, Welch SJ. A review of the optical properties of biological tissues. IEEE Journal of Quantum Electronics. 1990;26(12):2166. [Google Scholar]
- 25.Pedersen GD, McCormick NJ, Reynolds LO. Transport calculations for light scattering in blood. Biophys J. 1976;16:199–207. doi: 10.1016/S0006-3495(76)85681-0. [DOI] [PMC free article] [PubMed] [Google Scholar]


