Abstract
The cytoskeleton (microtubules, actin and intermediate filaments) has a cell type-specific spatial organization that is essential and reflects cell health. We are interested in understanding how changes in the organization of microtubules contribute to muscle diseases such as Duchenne muscular dystrophy (DMD). The grid-like immunofluorescence microtubule pattern of fast-twitch muscle fibers lends itself well to visual assessment. The more complicated pattern of other fibers does not. Furthermore, visual assessment is not quantitative. Therefore we have developed a robust software program for detecting and quantitating microtubule directionality. Such a tool was necessary because existing methods focus mainly on local image features and are not well suited for microtubules. Our tool, TeDT, is based on the Haralick texture method and takes into account both local and global features with more weight on the latter. The results are expressed in a graphic form responsive to subtle variations in microtubule distribution, while a numerical score allows quantitation of directionality. Furthermore, the results are not affected by imaging conditions or post-imaging procedures. TeDT successfully assesses test images and microtubules in fast-twitch fibers of wild-type and mdx mice (a model for DMD); TeDT also identifies and quantitates microtubule directionality in slow-twitch fibers, in the fibers of young animals, and in other mouse models which could not be assessed visually. TeDT might also contribute to directionality assessments of other cytoskeletal components.
Keywords: directionality, microtubule, muscle fiber, gray-level co-occurrence matrices, texture correlation, Duchenne muscular dystrophy
Introduction
The mammalian cytoskeleton comprises microfilaments, microtubules and intermediate filaments forming a three-dimensional structure. The cytoskeleton is involved in a variety of cellular functions such as the establishment and maintenance of a specific cell architecture [Vignaud et al. 2012]. These essential tasks are tightly linked to the spatial organization of the cytoskeletal components which are remodeled during development and differentiation of tissues and in pathological conditions [Verderame et al. 1980; Vassy et al. 1997; Bauer et al. 2009]. We are particularly interested in the organization of microtubules in skeletal muscle. Microtubules are dramatically reorganized during muscle differentiation and maturation [Warren 1974; Tassin et al. 1985; Lu et al. 2001] and are necessary for the elongation of differentiated myotubes [Holtzer et al. 1985; Zaal et al. 2011]. Microtubules are also reorganized under pathological conditions such as denervation [Ralston et al. 1999] and unloading [Sakurai et al. 2005], and in muscle diseases such as DMD [Percival et al. 2007]. Dystrophin, the protein mutated in DMD and absent in the mdx mouse model of the disease, may be directly responsible for the changes in microtubule organization. Indeed, dystrophin is a microtubule-associated protein [Prins et al. 2009]. It is important to understand such microtubule reorganizations since recent work [Khairallah et al. 2012] has shown that microtubules are involved in the DMD pathology. However, assessing differences in microtubule patterns, by visual examination of immunofluorescence images of muscle fibers, is neither easy nor quantitative. Muscle microtubule organization is activity- and fiber-type dependent [Ralston et al. 1999; 2001]. It is also species-dependent with small differences between rat and mouse [Percival et al. 2007]. In fast-twitch fibers of adult mouse or rat, for example those of the extensor digitorum longus (EDL) muscle, microtubules form a regular lattice with longitudinal and transverse components. Overall modifications of this lattice are noticeable. For example, there are clear differences in microtubule organization between EDL fibers from adult wild-type (wt) mice and from mdx mice [Percival et al. 2007; Prins et al. 2009]. The loss of dystrophin results in microtubule disorganization and the microtubule network appears isotropic (Fig. 1). However, the mostly slow-twitch fibers of the soleus muscle (SOL) show a dense layer of long, thick microtubules. They cannot be assessed visually because they lack a grid-like pattern even under normal conditions. Another difficult case is that of younger animals whose muscle fibers are smaller and microtubule patterns are less regular. We found EDL microtubules to be abnormal even in young mdx mice [Prins et al. 2009], but others have reported that only older mdx animals present microtubule abnormalities [Khairallah et al. 2012]. This is an important distinction: in the latter case, microtubule abnormalities could be secondary to muscle fiber regeneration, a characteristic of the disease process, and not directly linked to the absence of dystrophin. A sensitive and quantitative tool for directionality detection is clearly needed to replace the difficult and subjective visual assessment of microtubule organization.
Fig.1. Differences in mouse muscle microtubule organization from wt to mdx mice can be difficult to assess visually.
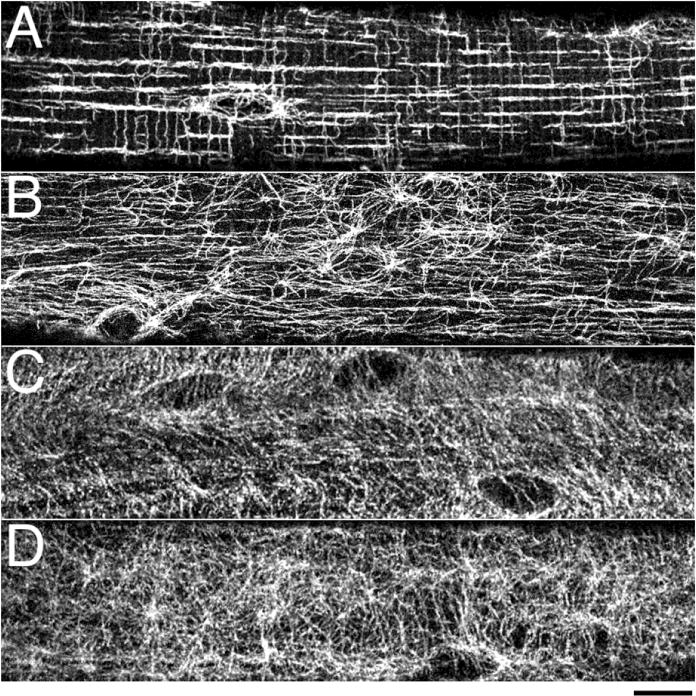
Single muscle fibers were stained with anti-α-tubulin: fast-twitch EDL muscle fibers from wt (A) and mdx mice (B, the mouse model for Duchenne muscular dystrophy); slow-twitch SOL muscle fibers from wt (C) and mdx (D) mice. EDL wt fibers show an organized microtubule network with longitudinal and transverse components, the loss of which in mdx is easy to notice visually. SOL wt fibers have a less regular network; differences between wt and mdx are difficult to assess. Each panel shows a single confocal image focused on the cortical layer of microtubules that surround the fiber core. Bar: 10μm.
Directionality is an important feature widely used in visual perception and image classification [Haralick et al. 1973; Tamura et al. 1978; Amadasun and King 1989]. It is defined as the shape of texture primitives (the geometric shapes an image is made of) and their placement rule in an image. Directionality is a global property and measures the degree of visible dominant orientation in an image. A directional texture has one or more recognizable orientations of primitives, whereas an isotropic texture has no recognizable orientations.
The initial and essential step of computational directionality detection is the identification of the texture primitives and their orientation. The most widely used detection method is based on the directionality element of the Tamura texture [Tamura et al. 1978]. This method looks for edges by calculating gray-level horizontal and vertical gradients for each pixel of an image. The orientation property of that pixel is then derived from the two gradients. The directionality of an image is the sum of the results of all its pixels. Although there is some flexibility in selecting the edge operators, they all calculate the histogram of local edge probabilities against their directional angle [Boland and Murphy 2001; Lin et al. 2003; Shamir et al. 2009; Abbadeni 2011]. Several directionality algorithms different from Tamura’s, (e.g. Structure Tensor [Rezakhaniha et al. 2012]), still rely on local operators. Algorithms using local operators, which we will henceforth refer to as Edge methods, work well when local and global features of an image are in accord, as is the case for straight lines. However, biological objects are often more complicated. Microtubules, collagen, DNA etc. can be curly. Sometimes the global directionality and local properties can be very different.
We have sought to develop a directionality tool well suited to biological biopolymers such as microtubules. Here we present a new tool utilizing the Haralick texture features [Haralick et al. 1973; Haralick 1979] for the identification of the texture primitives and their orientation. This software analyzes both local and global features. It detects dominant orientations, translates them into histograms in both Cartesian and polar coordinates, and obtains a Directionality score. We refer to our method as Texture Detection Technique (TeDT). As proof of concept, we used TeDT to ask whether microtubule patterns in slow-twitch mdx fibers differ from those in WT muscles. We do indeed find differences mirroring those assessed visually in the fast-twitch fibers. We also compared the microtubule patterns of young (3-week old) and adult (7- to 12-week old) fast-twitch muscles and substantiated our initial visual assessment.
Methods
Immunofluorescence of muscle microtubules
Immunofluorescence images of muscle microtubules were collected as part of a published study [Prins et al. 2009] but the images used here were not published earlier. Single confocal images were captured on a Leica SP5 confocal system with a 63× NA1.4 oil immersion lens. The image size was 1024 × 512 or 1024 × 1024 square pixels. From the viewpoint of directionality, muscle microtubules form two domains: 1) a highly organized network of cortical microtubules encircling the fiber core, in the narrow space between myofibrils and plasma membrane; 2) sparse microtubules running mostly longitudinally, i.e. parallel to the axis of the fibers, in the myofibrillar core. The images analyzed here were single confocal planes of cortical microtubules. Maximum projections would be appropriate as long as the two domains are kept separate for analysis. As a first step, the program asks the user to select a region of interest (ROI). This steps allows us to exclude myonuclei, because they are surrounded by a cage of isotropic microtubules [Oddoux et al. 2013]. For best results, the ROI size should be at least 100 × 100 square pixels, because the program needs to calculate the texture correlation for pixel pairs that are separated by up to 60 pixels, as explained further.
Computing algorithms and image processing
A. Edge Method
This method aims at building histograms HD of local edge probabilities as a function of directional angles (k). To do so it first applies 3 × 3 edge operators to detect horizontal (ΔH) and vertical (ΔV) gradients. From these it calculates the magnitude (ΔG) and direction (θ) of the gradient, as in the following equations (1 & 2).
| (1) |
| (2) |
The values of θ range from 0 to π, measured counterclockwise, with the horizontal direction corresponding to θ = 0°. The histogram HD can be calculated as in equation (3) [Tamura et al. 1978].
| (3) |
where Nθ(k) is the number of pixels at which θ is in [(2k−1)π/2n, (2k+1)π/2n] with thresholding |ΔG| > t. The thresholding of ΔG is aimed at excluding non-edge pixels; t is an empirical parameter (t= 12; n=16 in in Tamura et al., 1978).
B. TeDT Method
Haralick et al. proposed using gray-level co-occurrence matrices (GLCM) to quantitate texture [Haralick et al. 1973]. The matrices are constructed with the relative frequencies pij with which two neighboring pixels, one with gray level i and the other with gray level j are separated by a certain distance d in the image. The dimensions of the matrices are the numbers of gray levels in the images, i.e. 256 × 256 for 8-bit images. To avoid artifacts due to very small intensity fluctuations, and to accelerate calculations, we bin the grey levels into 8 values. The number of matrices to be calculated depends on the sampling resolution desired, in angles and distances. To identify both local and global features we consider values of d from 5 to 60 pixels. The minimum d of 5 pixels does not exclude significant image features: microtubules less than 5 pixels long are too short to be identified with confidence. In order to keep the number of matrices manageable we sample d in 11 steps with incremental separation from 1 to 10 pixels (i.e. d = 5, 6, 8, 11, 15, 20, 26, 33, 41, 50, & 60 pixels). For a good resolution of the directionality, we use 4° steps, i.e. 45 angle values from 0 to 180°. Therefore, we generate 11 × 45 = 495 GLCM matrices for each image.
We then calculate, for each matrix, the joint probability of occurrence of the specified pixel pair, Td:
| (4) |
where μx, μy, σx and σy are the means and standard deviations of px and py (px=Σi(pij) and py=Σj(pij)). Finally, the texture correlation value for each direction, Tθ (φ) is obtained by averaging Td for each angle:
| (5) |
The texture correlation values, HD, are normalized for each direction:
| (6) |
and texture correlation histograms are obtained by plotting HD(φ) against the orientation angles. An isotropic orientation of the features assessed gives a histogram that is a horizontal line, whereas a directional orientation produces one to several sharp peaks.
A directionality score is finally calculated from histogram plots by summing up the second moments around each peak from valley to valley [Tamura et al. 1978]:
| (7) |
where np is the number of peaks, φp is the angle at the pth peak position of HD, wp is the range of the pth peak between valleys and γ is a normalizing factor that constrains D to values from 0 (for an isotropic distribution) to 1 (single angle directionality). The factor γ is related to the number of peaks and to the distance between peaks, therefore it is calculated for each image. In the isotropic distribution (D=0), HD (φ) is the same for all the angles, hence HD (φ) = 1/45.
| (8) |
In our program, the location of peaks and valleys is entered by the user in response to a software query. The location is decided based on both the height and the slopes of the peaks. Other procedures and calculations are automated.
Software
All procedures were performed in MATLAB 7.11 (MathWorks, Natick, MA) with a customized program that will be made available upon request. The function graycomatrix in MATLAB Image Processing Toolbox was used to calculate the texture correlation in GLCMs with 8 gray levels and symmetric setting. The processing time is on the order of 10 seconds for a 500×500 pixels 8-byte image with a standard iMac computer (2.8 GHz Intel i5 processor, 4GB 1333 MHz DDR3 memory) or an equivalent PC.
For the sake of comparison, we also created a program to evaluate directionality based on the Edge algorithm [Tamura et al. 1978]. The threshold for edge selection was 12, the value suggested in the cited article. The number of subdivisions, n, was 45, the same as in the TeDT approach.
ImageJ, a free image processing software developed at NIH by Wayne Rasband (http://imagej.nih.gov/ij), was used for image processing such as smoothing and sharpening etc.
Test images (Figs. 2C, 3) were generated by a customized MATLAB program and then processed with “sharpen”, “smooth” and “noise” filters in ImageJ. The distance between two adjacent dots in Fig. 2C is 19 pixels and the diameter of the dots is 12 pixels. Fig. 2E was created in Adobe illustrator 10 (Adobe Systems, Mountain View, CA) and exported in TIFF format. The period of the sinusoid is 8 pixels. The directional histogram plots in Cartesian and in polar coordinates, as shown in Figs. 2, 3, 4 and 6, were generated in the customized MATLAB program.
Fig. 2. The new TeDT method alone assesses directionality when global and local features of the image diverge.
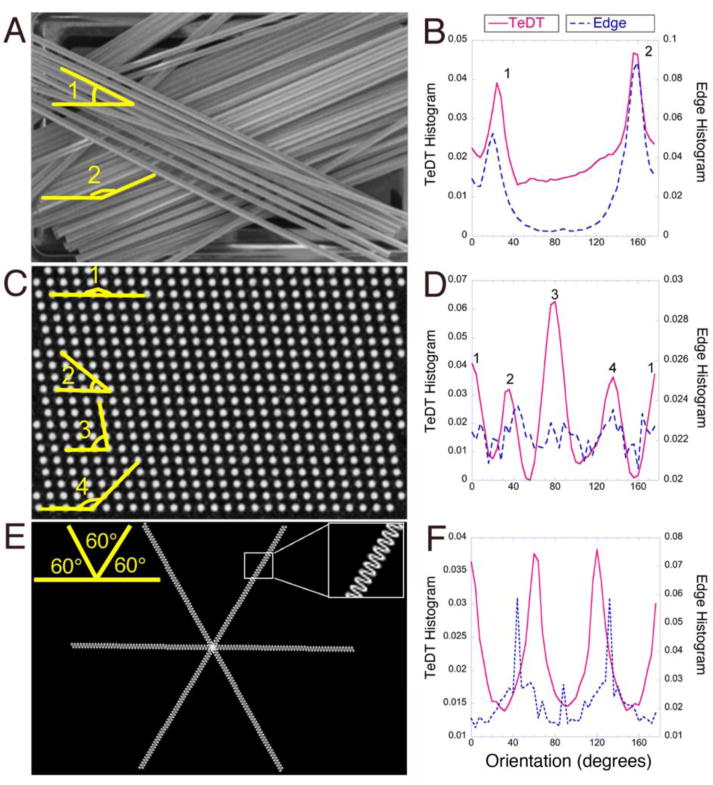
Images with different features were used to test the different directionality assessment approaches. Stirrers (A) have continuous straight structures with 30° and 160° angles (in yellow) i.e. the same global and local features. Both TeDT and Edge methods correctly detect the dominating angles (B). In contrast, computer-generated images of a field of dots (C) or curly filaments (E) have competing local and global features. TeDT detects every angle while the Edge method does not (D, F).
Fig. 3. Image processing procedures do not impact TeDT results.
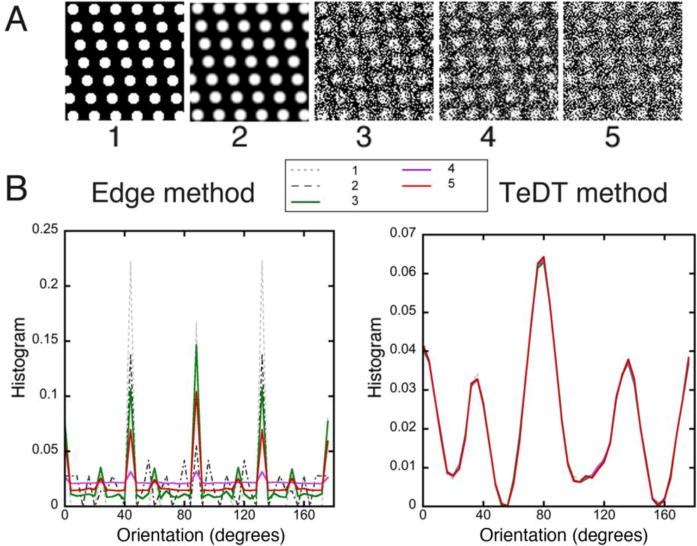
The original dot image and several variants obtained by image processing (A) were analyzed; 1: original image; 2: image processed by a smoothing filter; 3: image 2 with addition of salt-and-pepper noise; 4: image 2 with addition of Gaussian noise; 5: sharpening filter applied to 4. Treatments 2 and 5 were done in ImageJ; 3 and 4 were done in MATLAB with imnoise commands (noise level: 50%). As shown in the histogram plots (B), TeDT results are practically unchanged while Edge method plots show changes in both relative and absolute values of the peaks.
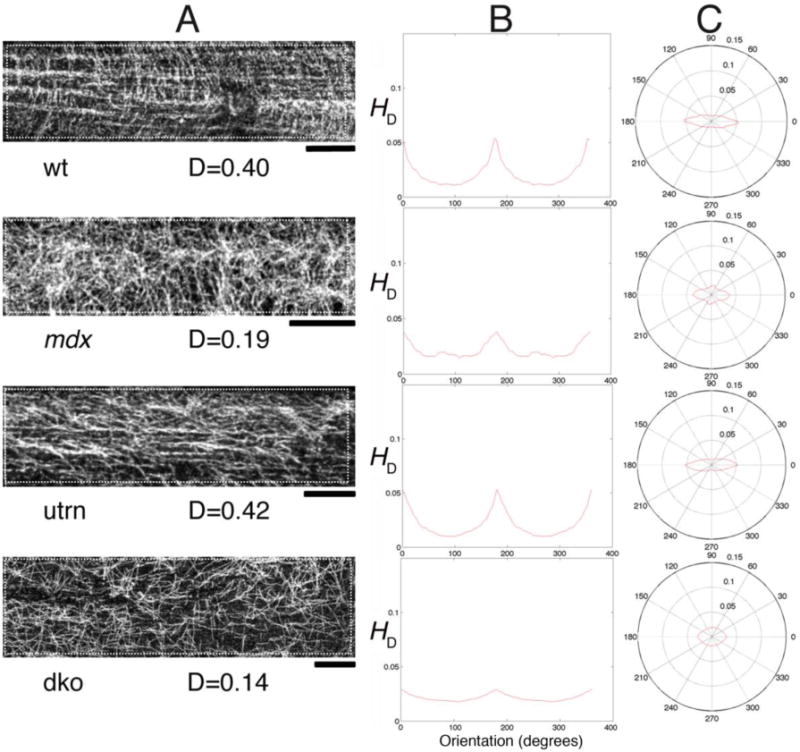
Fig. 4. Microtubule directionality detection by TeDT in fast-twitch muscle fibers from different mouse genotypes.
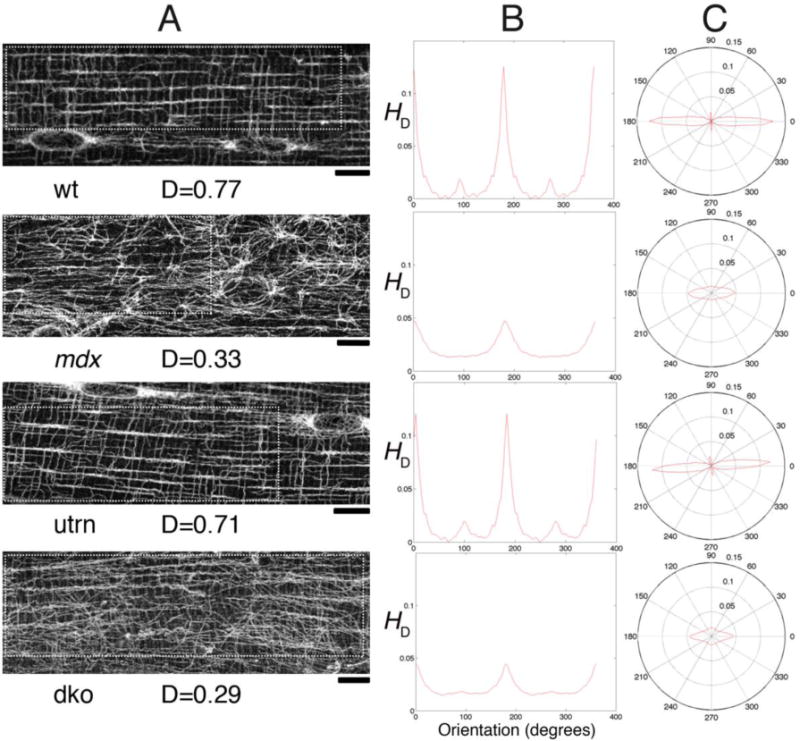
TeDT was used to compare microtubule organization in fibers from the fast-twitch EDL muscle of wild-type (wt), mdx, utrn (in which dystrophin’s homologue utrophin is knocked-out) and mdx-utrn double knockout (dko) mice. The left column shows a confocal image for each mouse group. The analysis was carried out on the regions of interest drawn with white dots to exclude the nuclei (arrows) which have their own organization. The directional histograms (HD) from 0 to 360° are presented in Cartesian (central column) and in polar coordinates (right column). D is the directionality score (see Methods) for each of the images. Bar: 10μm.
Fig. 6. Microtubule directionality detection by TeDT in slow-twitch muscle fibers from different mouse genotypes.
Microtubules of SOL muscle fibers from wt, mdx, utrn and dko mice were analyzed as those of EDL were in Fig. 4. The left column shows a confocal image for each mouse group. The directional histograms (HD) from 0 to 360° in Cartesian and in polar coordinates are shown in the middle and right columns respectively. Bar: 10μm
For data analysis and graphing, we used KaleidaGraph (Synergy Software, Reading, PA). Statistical box plot representation is used to display the results. Each box covers 50% of the data in that group with the top and bottom of the box marking the upper and lower quartile of the population. The median value is indicated by the horizontal line inside the box. The vertical lines extending from the top and bottom of each box mark the minimum and maximum values within the data set. The points outside the range are outliers.
Results
TeDT detects both local and global image features
To develop and assess TeDT, we analyzed images with defined dominant angles by both TeDT and Edge methods (Fig. 2). The first image (Fig. 2A) is a photograph of drink stirrers. Visual observation reveals two dominant orientations (angles 1 and 2), around 30° and 160°. Both TeDT and the Edge methods find these angles (Fig. 2B). The plot shapes are slightly different, likely because the Edge method only calculates the pixels that are on edges, while TeDT counts all pixels in the image. This example shows that both methods are effective at detecting dominant orientations of straight and continuous objects, whose global features are not different from their local features. We next analyzed computer-generated images (Figs. 2C, E; see Methods). Fig. 2C has equally spaced dots along 4 axes: 0°, 40°, 80° and 140° (angles 1 to 4) while Fig. 2E shows continuous but curly lines, a purposefully exaggerated model for the shape of acetylated (stable) microtubules. In these two examples, TeDT correctly detects the dominant angles while the Edge method does not. We also evaluated a different Edge method-based technique, the Structure Tensor [Rezakhaniha et al. 2012] to analyze the directionality of Figs. 2 (Supplemental text and Figs. S1–S4). After optimization of all parameters, the Structure Tensor method worked better than the original Edge method for Fig. 2E but still failed to create the correct plot for Fig. 2C. We did not pursue the evaluation of the Structure Tensor method further.
TeDT detects dominant angles when local and global image properties differ; it should therefore be useful for the analysis of a broad variety of images and since its directionality scores are directly calculated from the histogram plots they should be more reliable as well.
TeDT Directionality results are not affected by image quality
Because it may be necessary to compare images taken with different imaging parameters, an ideal directionality tool should give similar results despite differences in image characteristics such as noise and contrast. To evaluate the sensitivity of TeDT and Edge methods to variations in image quality we altered noise and contrast of the computer-generated dot image with ImageJ filters (Fig. 3A) and calculated the directionality plots of the modified images (Fig. 3B). Image 1 refers to the original image, 2 to the original treated with a smoothing filter and 3–4 to the original with addition of noise (Salt-and-Pepper noise, 3; Gaussian noise, 4), followed by smoothing. Image 5 results from sharpening image 4. Because these procedures alter the local features, they strongly modify both amplitude and location of the peaks in the Edge plots. On the other hand, TeDT generates almost identical curves under all conditions tested.
TeDT finds dominant orientations and directionality of muscle microtubules in images from fast-twitch mouse muscles
The impetus to develop TeDT came from the need for help in the analysis of microtubules in the mdx mouse, the rodent model for DMD [Percival et al. 2007; Prins et al. 2009].
We first applied TeDT to tubulin immunofluorescence images from the fast-twitch EDL muscle fibers from 4 mouse genotypes (Fig. 4A): wild-type (wt), mdx, utrophin-knockout (utrn), and mdx-utrophin double knockout (dko). The dko is considered a better DMD model than mdx because utrophin normally compensates for the absence of dystrophin [Isaac et al. 2013]. We previously determined by visual analysis that wt and utrn have normal lattice patterns, while mdx and the dko have disorganized microtubules. Now we confirm and quantitate these observations with TeDT (Fig. 4); dominant orientations can be identified from two different directionality plots; the Cartesian plot of HD (Fig. 4B) and the polar plot (Fig. 4C). It is not surprising to see both wt and utrn EDL microtubules with two dominant angles, parallel (0°) and perpendicular (90°) to the fiber axis. The longitudinal microtubules dominate because their bundles are thicker -include more pixels- than the thin perpendicular microtubules. In contrast, mdx and dko microtubules are disorganized; the 90° peak is lost from the plots; a small peak remains at 0°, the dominant orientation.
The directionality scores are in Fig. 5. Wt microtubules have an average directionality score of 0.70 ± 0.12 (average ± S.D, number of analyzed images n=14) while mdx have a score of 0.33 ± 0.17 (n=11). The distributions are significantly different between these two groups, with a t-test score p<0.0001. Utrn group score is 0.69 ± 0.09 (n=9) and its distribution is not different from the wt group (p>0.50). Dko score is 0.40 ± 0.16 (n=13), very similar to mdx (p>0.25), and significantly lower than the scores in wt and utrn groups (p<0.001). Thus TeDT confirms our visual examination and, more importantly, adds the strength of statistical analysis to support the notion that the absence of dystrophin causes microtubule defects in the EDL muscle of the 4 mouse strains analyzed.
Fig. 5. TeDT analysis confirms and quantitates visual analysis of directionality for fast-twitch muscle microtubules.
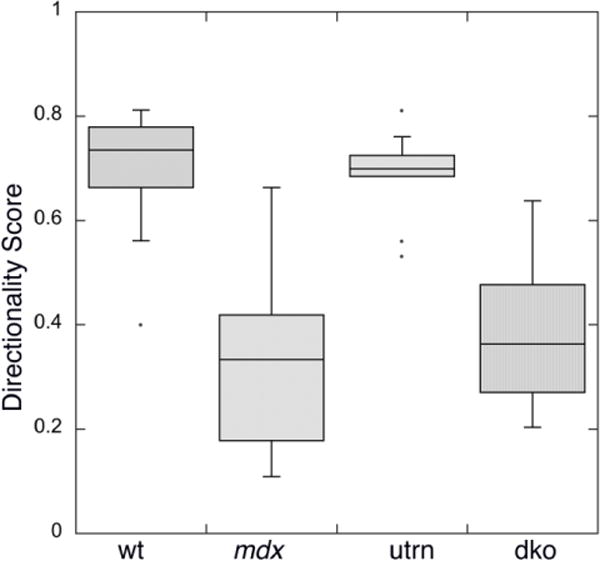
Muscle microtubule images were analyzed for each group examined in Fig. 4. The directionality scores D (see methods) were plotted in KaleidaGraph with probability box representation. The scores for wt (0.70 ± 0.12) and utrn (0.69 ± 0.09) are significantly higher than the scores for mdx (0.33 ± 0.17) and dko (0.40 ± 0.16) with p<0.001. No significant difference was detected between wt and utrn (p>0.50), and between mdx and dko (p>0.25).
TeDT reveals microtubule alterations in slow-twitch muscle fibers of dystrophin-lacking mice
We next applied TeDT to the analysis of microtubules from the slow-twitch soleus (SOL) muscle of the same mouse strains. Because microtubules in wt SOL fibers (Fig. 6A) do not form a regular lattice like those in wt EDL fibers we had not been able to assess these images before. The 0° direction is still favored, although it is not as dominant as in wt EDL. Most striking is the loss of the 90° peak: microtubules are almost totally randomly distributed between 50° and 150° orientations. For each strain the average directionality score (Fig. 7) is significantly lower than that of EDL, but the differences among the four strains remain. Wt SOL muscles have an average directionality score of 0.42 ± 0.22 (n=20), mdx muscles 0.28 ± 0.15 (n=16), utrn 0.40 ± 0.15 (n=12), and dko 0.26 ± 0.12 (n=17). Wt and utrn SOL muscle microtubules have similar directionality scores (t-test score p>0.25); both are significantly higher than the mdx and dko group (p<0.05); mdx and dko strains have similar directionalities (p>0.25). Therefore TeDT indicates that alterations in microtubule organization take place in slow-twitch fibers as well.
Fig. 7. TeDT analysis detects directionality differences which could not be observed visually in slow-twitch muscle microtubules.
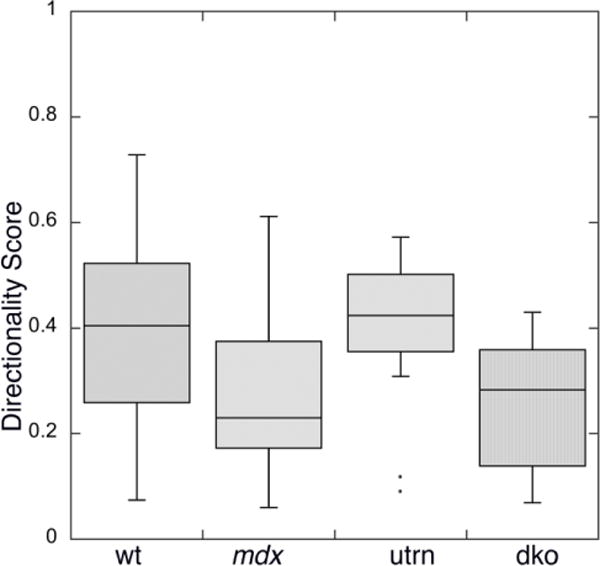
Muscle microtubule images were analyzed for each mouse group. The figure was plotted in KaleidaGraph with probability box representation. The directionality scores for wt (0.42 ± 0.22) and utrn (0.40 ± 0.15) are significantly higher than the scores for mdx (0.28 ± 0.15) and dko (0.26 ± 0.12) with p value less than 0.05. No significant difference was detected between wt and utrn (p>0.25), and between mdx and dko (p>0.25). These results are similar to those found for fast-twitch fibers.
TeDT detects microtubule alterations in young mdx mice before the first wave of degeneration
The progression of disease in the muscles of mdx mice follows a characteristic path with cycles of muscle degeneration and regeneration starting at 3–4 weeks and occurring throughout the mouse life [Tanabe et al. 1986; Gorospe et al. 1997; Percival et al. 2007]. If microtubule pattern differences result from the absence of dystrophin and not from the resulting cycles of degeneration and regeneration, alterations should be detectable at 3 weeks. However, at that age, microtubules are not as well organized as in adult muscle, even in fast-twitch fibers, making alterations more difficult to assess. We used TeDT to compare microtubule directionality in EDL muscles of wt and mdx young (3 wk) and adult (7–12 wk) mice. As shown in Fig. 8 and Table 1, differences between wt and mdx are significant, but differences between adult and young, whether wt or mdx, are not, supporting the notion that changes in directionality are linked to the loss of dystrophin and not to the effects of degeneration-regeneration cycles.
Fig. 8. Directionality comparison between mice of different ages.
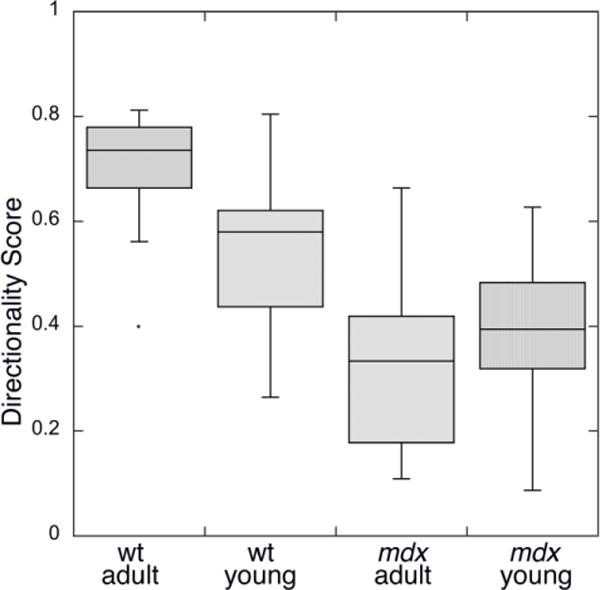
Microtubule images were analyzed from wt and mdx, young (~3 wk-old) and adult (7–12 wk-old) mice. The adult wt mice have higher directionality scores (0.70 ± 0.12) than young wt mice (0.54 ± 0.16), while adult mdx mice have slightly lower scores (0.33 ± 0.17) than young mdx mice (0.39 ± 0.13). However neither differences between young and older wt nor those between young and older mdx are significant (p>0.50).
Table 1.
Directionality score statistics for young and adult mice.
| wt adult (n=14) |
wt young (n=26) |
mdx adult (n=11) |
mdx young (n=34) |
|
|---|---|---|---|---|
| mean ± S. D | 0.70 ± 0.12 | 0.54 ± 0.16 | 0.33 ± 0.17 | 0.39 ± 0.13 |
| mdx young | p<0.01 | p<0.01 | p>0.50 | |
| mdx adult | p<0.05 | p<0.05 | ||
| wt young | p>0.50 |
Row 2: average directionality score for each group; rows 3–5: p values of two-tailed student t tests for comparing corresponding groups (column vs row).
Discussion
In this paper, we introduce TeDT, a new texture co-occurrence approach for assessing and quantitating directionality. This tool has significant advantages over the traditional Edge method when it comes to detect directionality from imperfect and irregular shapes, which are common in biological structures. The Edge method has been widely adopted in directionality detection and image classification [Tamura et al. 1978; Boland and Murphy 2001; Lin et al. 2003; Shamir et al. 2009; Abbadeni 2011]. However, two key steps can lead to problems with biological structures: i) images are first processed with local operators, usually 3 × 3 edge filters; this gives priority to local features and misses global ones if they are different (as in the structures shown in Fig. 2C and 2E); ii) a threshold step aims at excluding non-edge features. This step in theory could improve the detection sensitivity. However the selection of threshold values is complex, because several factors could affect that value, such as noise level, image resolution etc. Structure tensor methods have also been applied to directionality detection [Jähne 1993; Bigun et al. 2004; Rezakhaniha et al. 2012]. However, they are also based on local filters and therefore present similar drawbacks to the Edge method. When Rezakhaniha et al. (2012) used structure tensors to quantify collagen waviness and orientation, they had to use two different methods to measure the local and global directionality separately. Our own results (Supplementary material) demonstrate that this approach produces results similar to those of the Edge method. Furthermore, methods based on local filters appear quite sensitive to imaging conditions and post-acquisition procedures (Figs. 3 and S4), leading to the recommendation that certain post-acquisition procedures be avoided [Jain and Vailaya 1996; Boland and Murphy 2001].
In contrast, techniques based on texture co-occurrence, such as TeDT and our previously published MARS technique [Liu et al. 2013], detect the image pattern even in the presence of a high noise level (Fig. 3). Although imaging parameters also affect texture correlation values, the impact is the same for all directions. Thus, the final histogram plot remains almost unchanged and the directionality scores are consistent, because the scores are only determined by the sharpness of the curves.
TeDT calculates texture features for elements in the range of 5–60 pixels. This range is well suited to the images we analyze in our studies and is adjustable to different sizes or steps, depending on the size of texture features. However, in low magnification images or images of features such as short rods, an Edge method technique might be preferable because small features may be missed by our method.
We also noticed that the directionality score decreases when the number of peaks in the histogram increases. With all other features (intensity etc) remaining equal, a unidirectional microtubule pattern will have a higher score than a more complex two-directional pattern such as a perfect orthogonal grid. It is important to understand this behavior of the score which may be counterintuitive and to consider both graphic results and calculated score.
To assess TeDT, we have applied it to the analysis of differences in muscle microtubule organization related to DMD. We have compared different muscle fiber types, mouse genotypes, and disease stages. Microtubule distribution in skeletal muscle may reflect muscle fiber health and muscle microtubules are particularly relevant to DMD. However, how the lack of dystrophin affects muscle microtubules and muscle health is still not clear. It was therefore important to determine whether microtubule defects are present in young mdx mice before their muscles become affected and whether microtubules are defective in the utrn mouse. Visual evaluation was possible only for fast-twitch fibers which normally have the most regular periodic organization. Now, TeDT reproduces the results of the visual evaluation for the fast-twitch fibers, and provides their quantitation. More interestingly, it produces similar results for the slow-twitch fibers and confirms that mdx microtubules are affected at an early stage. A recent publication [Khairallah et al. 2012] proposed that microtubules are disturbed in older mdx mice only. However, in this study, microtubules were rated based on their density rather than pattern.
For this proof-of-concept TeDT analysis, we worked with a limited number of images. For definitive conclusions on the differences in muscle microtubule organization related to DMD, larger scale analysis will be needed. Based on the current study we believe that TeDT will be of great help in this analysis. We also envision that TeDT will prove useful in the exploration of other biological structures.
Acknowledgments
The authors thank Jim Ervasti (University of Minnesota) for the mouse muscle samples, provided in the context of a previous collaboration, Kristien J.M. Zaal, Sarah Oddoux, Aster Kenea and Andrew Milgroom from the Light Imaging Section for sample images, critical reading of the manuscript, and many stimulating discussions. This work was supported by the Intramural Program of National Institute of Arthritis and Musculoskeletal and Skin Diseases.
References
- Abbadeni N. Computational Perceptual Features for Texture Representation and Retrieval. IEEE T Image Process. 2011;20(1):236–246. doi: 10.1109/TIP.2010.2060345. [DOI] [PubMed] [Google Scholar]
- Amadasun M, King R. Textural Features Corresponding to Textural Properties. IEEE T Syst Man Cyb. 1989;19(5):1264–1274. [Google Scholar]
- Bauer NG, Richter-Landsberg C, Ffrench-Constant C. Role of the Oligodendroglial Cytoskeleton in Differentiation and Myelination. Glia. 2009;57(16):1691–1705. doi: 10.1002/glia.20885. [DOI] [PubMed] [Google Scholar]
- Bigun J, Bigun T, Nilsson K. Recognition by symmetry derivatives and the generalized structure tensor. IEEE T Pattern Anal. 2004;26(12):1590–1605. doi: 10.1109/TPAMI.2004.126. [DOI] [PubMed] [Google Scholar]
- Boland MV, Murphy RF. A neural network classifier capable of recognizing the patterns of all major subcellular structures in fluorescence microscope images of HeLa cells. Bioinformatics. 2001;17(12):1213–1223. doi: 10.1093/bioinformatics/17.12.1213. [DOI] [PubMed] [Google Scholar]
- Gorospe J, Nishikawa B, Hoffman E. Pathophysiology of dystrophin deficiency: a biological and clinical enigma. UK: Cambridge University Press; 1997. [Google Scholar]
- Haralick RM. Statistical and Structural Approaches to Texture. P IEEE. 1979;67(5):786–804. [Google Scholar]
- Haralick RM, Shanmuga K, Dinstein I. Textural Features For Image Classification. IEEE T Syst Man Cyb SMC. 1973;3(6):610–621. [Google Scholar]
- Holtzer H, Forryschaudies S, Dlugosz A, Antin P, Dubyak G. Interactions between Ifs, Microtubules, and Myofibrils in Fibrogenic and Myogenic Cells. Ann N Y Acad Sci. 1985;455:106–125. doi: 10.1111/j.1749-6632.1985.tb50407.x. [DOI] [PubMed] [Google Scholar]
- Isaac C, Wright A, Usas A, Li H, Tang Y, Mu X, Greco N, Dong Q, Vo N, Kang J, et al. Dystrophin and utrophin “double knockout” dystrophic mice exhibit a spectrum of degenerative musculoskeletal abnormalities. J Orthop Res. 2013;31(3):343–9. doi: 10.1002/jor.22236. [DOI] [PMC free article] [PubMed] [Google Scholar]
- Jähne B. Spatio-temporal image processing : theory and scientific applications. Berlin; New York: Springer-Verlag; 1993. p. vii, 208. [Google Scholar]
- Jain AK, Vailaya A. Image retrieval using color and shape. Pattern Recogn. 1996;29(8):1233–1244. [Google Scholar]
- Khairallah RJ, Shi GL, Sbrana F, Prosser BL, Borroto C, Mazaitis MJ, Hoffman EP, Mahurkar A, Sachs F, Sun YZ, et al. Microtubules Underlie Dysfunction in Duchenne Muscular Dystrophy. Sci Signal. 2012;5(236):ra56. doi: 10.1126/scisignal.2002829. [DOI] [PMC free article] [PubMed] [Google Scholar]
- Lin HC, Chiu CY, Yang SN. Finding textures by textual descriptions, and relevance feedbacks. Pattern Recogn Lett. 2003;24(14):2255–2267. [Google Scholar]
- Liu W, Raben N, Ralston E. Quantitative evaluation of skeletal muscle defects in second harmonic generation images. J Biomed Opt. 2013;18(2):26005. doi: 10.1117/1.JBO.18.2.026005. [DOI] [PMC free article] [PubMed] [Google Scholar]
- Lu ZM, Joseph D, Bugnard E, Zaal KJM, Ralston E. Golgi complex reorganization during muscle differentiation: Visualization in living cells and mechanism. Mol Biol Cell. 2001;12(4):795–808. doi: 10.1091/mbc.12.4.795. [DOI] [PMC free article] [PubMed] [Google Scholar]
- Oddoux S, Zaal KJ, Tate V, Kenea A, Nandkeolyar SA, Reid E, Liu W, Ralston E. Microtubules that form the stationary lattice of muscle fibers are dynamic and nucleated at Golgi elements. J Cell Biol. 2013;203(2):205–13. doi: 10.1083/jcb.201304063. [DOI] [PMC free article] [PubMed] [Google Scholar]
- Percival JM, Gregorevic P, Odom GL, Banks GB, Chamberlain JS, Froehner SC. RAAV6-Microdystrophin rescues aberrant golgi complex organization in mdx Skeletal muscles. Traffic. 2007;8(10):1424–1439. doi: 10.1111/j.1600-0854.2007.00622.x. [DOI] [PubMed] [Google Scholar]
- Prins KW, Humston JL, Mehta A, Tate V, Ralston E, Ervasti JM. Dystrophin is a microtubule-associated protein. J Cell Biol. 2009;186(3):363–369. doi: 10.1083/jcb.200905048. [DOI] [PMC free article] [PubMed] [Google Scholar]
- Ralston E, Lu ZM, Ploug T. The organization of the Golgi complex and microtubules in skeletal muscle is fiber type-dependent. J Neurosci. 1999;19(24):10694–10705. doi: 10.1523/JNEUROSCI.19-24-10694.1999. [DOI] [PMC free article] [PubMed] [Google Scholar]
- Ralston E, Ploug T, Kalhovde J, Lomo T. Golgi complex, endoplasmic reticulum exit sites, and microtubules in skeletal muscle fibers are organized by patterned activity. J Neurosci. 2001;21(3):875–883. doi: 10.1523/JNEUROSCI.21-03-00875.2001. [DOI] [PMC free article] [PubMed] [Google Scholar]
- Rezakhaniha R, Agianniotis A, Schrauwen JT, Griffa A, Sage D, Bouten CV, van de Vosse FN, Unser M, Stergiopulos N. Experimental investigation of collagen waviness and orientation in the arterial adventitia using confocal laser scanning microscopy. Biomech Model Mechanobiol. 2012;11(3–4):461–73. doi: 10.1007/s10237-011-0325-z. [DOI] [PubMed] [Google Scholar]
- Sakurai T, Fujita Y, Ohto E, Oguro A, Atomi Y. The decrease of the cytoskeleton tubulin follows the decrease of the associating molecular chaperone alpha B-crystallin in unloaded soleus muscle atrophy without stretch. FASEB J. 2005;19(7):1199–+. doi: 10.1096/fj.04-3060fje. [DOI] [PubMed] [Google Scholar]
- Shamir L, Wolkow CA, Goldberg IG. Quantitative measurement of aging using image texture entropy. Bioinformatics. 2009;25(23):3060–3063. doi: 10.1093/bioinformatics/btp571. [DOI] [PMC free article] [PubMed] [Google Scholar]
- Tamura H, Mori S, Yamawaki T. Textural Features Corresponding To Visual-Perception. IEEE T Syst Man Cyb. 1978;8(6):460–473. [Google Scholar]
- Tanabe Y, Esaki K, Nomura T. Skeletal-Muscle Pathology in X-Chromosome-Linked Muscular-Dystrophy (Mdx) Mouse. Acta Neuropathol (Berl) 1986;69(1–2):91–95. doi: 10.1007/BF00687043. [DOI] [PubMed] [Google Scholar]
- Tassin AM, Maro B, Bornens M. Fate of Microtubule-Organizing Centers during Myogenesis Invitro. J Cell Biol. 1985;100(1):35–46. doi: 10.1083/jcb.100.1.35. [DOI] [PMC free article] [PubMed] [Google Scholar]
- Vassy J, Irinopoulou T, Beil M, Rigaut JP. Spatial distribution of cytoskeleton intermediate filaments during fetal rat hepatocyte differentiation. Microsc Res Tech. 1997;39(5):436–443. doi: 10.1002/(SICI)1097-0029(19971201)39:5<436::AID-JEMT6>3.0.CO;2-E. [DOI] [PubMed] [Google Scholar]
- Verderame M, Alcorta D, Egnor M, Smith K, Pollack R. Cytoskeletal F-Actin Patterns Quantitated with Fluorescein Isothiocyanate-Phalloidin in Normal and Transformed-Cells. P Natl Acad Sci-Biol. 1980;77(11):6624–6628. doi: 10.1073/pnas.77.11.6624. [DOI] [PMC free article] [PubMed] [Google Scholar]
- Vignaud T, Blanchoin L, Thery M. Directed cytoskeleton self-organization. Trends Cell Biol. 2012;22(12):671–682. doi: 10.1016/j.tcb.2012.08.012. [DOI] [PubMed] [Google Scholar]
- Warren RH. Microtubular Organization in Elongating Myogenic Cells. J Cell Biol. 1974;63(2):550–566. doi: 10.1083/jcb.63.2.550. [DOI] [PMC free article] [PubMed] [Google Scholar]
- Zaal KJM, Reid E, Mousavi K, Zhang T, Mehta A, Bugnard E, Sartorelli V, Ralston E. Who Needs Microtubules? Myogenic Reorganization of MTOC, Golgi Complex and ER Exit Sites Persists Despite Lack of Normal Microtubule Tracks. Plos One. 2011;6(12):e29057. doi: 10.1371/journal.pone.0029057. [DOI] [PMC free article] [PubMed] [Google Scholar]


