

Abstract
BACKGROUND
Ethanol is a teratogen that affects numerous developmental processes in the nervous system, which includes development and survival of GABAergic and glutamatergic neurons. Possible molecular mechanisms accounting for ethanol’s effects on nervous system development include perturbed fibroblast growth factor (Fgf) and Sonic hedgehog (Shh) signaling. In zebrafish, forebrain GABAergic neuron development is dependent on Fgf19 and Shh signaling. The present study was conducted to test the hypothesis that ethanol affects GABAergic and glutamatergic neuron development by disrupting Fgf, Shh, and agrin function.
METHODS
Zebrafish embryos were exposed to varying concentrations of ethanol during a range of developmental stages, in the absence or presence of morpholino oligonucleotides (MOs) that disrupt agrin or Shh function. In situ hybridization was employed to analyze glutamic acid decarboxylase (GAD1) gene expression, as well as markers of glutamatergic neurons.
RESULTS
Acute ethanol exposure results in marked reduction in GAD1 gene expression in forebrain and hindbrain, and reduction of glutamatergic neuronal markers in hindbrain. Subthreshold ethanol exposure, combined with agrin or Shh MO treatment, produces a similar diminution in expression of markers for GABAergic and glutamatergic neurons. Consistent with the ethanol effects on Fgf and Shh pathways, Fgf19, Fgf8 or Shh mRNA overexpression rescues ethanol-induced decreases in GAD1 and atonal1a gene expression.
CONCLUSIONS
These studies demonstrate that GABAergic and glutamatergic neuron development in zebrafish forebrain or cerebellum is sensitive to ethanol exposure, and provides additional evidence that a signaling pathway involving agrin, Fgfs and Shh may be a critical target of ethanol exposure during zebrafish embryogenesis.
Keywords: heparan sulfate proteoglycan, fetal alcohol spectrum disorder, GAD1, Sonic hedgehog, Fgf, alcohol
INTRODUCTION
The effects of alcohol exposure on fetal central nervous system (CNS) development are well documented, with ethanol perturbing ocular development (Chan et al, 1991; Dangata and Kaufman 1997; Stromland 1985; Stromland and Pinazo-Duran 1994), development of auditory structures (Church and Kaltenbach 1997), forebrain development (Clarren et al, 1978; Mattson and Riley 1996) and hindbrain development (Cragg and Phillips 1985; Goodlett et al, 1990). In rodents, the developmental timing of ethanol exposure defines the CNS regions that are affected, with early ethanol exposures impacting ocular and forebrain development, and late-stage exposures affecting hindbrain development (Sulik and Johnston 1982; Sulik et al, 1981, 1984; Van Maele-Fabry et al, 1995; Maier et al, 1997; Dunty et al, 2002; Parnell et al, 2009; Godin et al, 2010).
A prominent forebrain feature of prenatal ethanol exposure during CNS development is holoprosencephaly. Ethanol exposure at embryonic day 7 (E7) leads to holoprosencephaly in mouse (Sulik et al, 1981; Aoto et al, 2008). An acute ethanol exposure of 0.25 days at E7 is sufficient to induce holoprosencephaly (Aoto et al, 2008). Severe impairment of telencephalic development also results from prenatal ethanol exposure, with an almost complete absence of the telencephalon and eyes being observed in embryos exhibiting severe holoprosencephaly (Aoto et al, 2008).
Development of the mammalian cerebellum is also highly sensitive to prenatal ethanol exposure, with a reduction in the number of GABAergic Purkinje cells observed in mouse and rat cerebellum (Bauer-Moffett and Altman, 1977; Cragg and Phillips, 1985; Goodlett et al, 1990; Hamre and West, 1993; Napper and West, 1995; Goodlett and Eilers, 1997; Maier et al, 1999; Karacay et al, 2008). Purkinje cell loss in rodent cerebellum as a result of alcohol exposure is dependent on the timing of exposure, with the greatest Purkinje cell loss occurring with ethanol exposures at postnatal day 4–5 (PD4-5), which is approximately equivalent to the third trimester of human gestation (Hamre and West, 1993). Rat pups exposed to ethanol after PD7 were shown to be less sensitive to ethanol-induced reductions in Purkinje cells (Hamre and West, 1993). However, rats exposed to ethanol at all three trimester equivalents exhibited the greatest Purkinje cell loss, when compared to the extent of cell loss with only a third-trimester equivalent ethanol exposure (Maier et al, 1999), suggesting that cerebellar development is sensitive to ethanol exposure throughout CNS development. This loss of cerebellar neurons is likely a result of cell death, as significant apoptosis is induced in the brains of rats exposed prenatally to alcohol (Olney et al, 2000; 2002). Prenatal ethanol exposure in mice also results in augmented hindbrain cell death based on vital dye staining (Dunty et al, 2001), and in zebrafish embryos ethanol exposure produces increased levels of cell death in hindbrain (Carvan et al, 2004).
Analyses on possible molecular targets of prenatal ethanol exposure suggest that at least some of the effects of ethanol on CNS development may occur due to impaired extracellular matrix (ECM) function, in particular signaling pathways involving fibroblast growth factors (Fgfs) and morphogens such as Sonic hedgehog (Shh). Fgf2 and Fgf8 expression levels and function are altered in prenatal mice exposed to ethanol (Aoto et al, 2008; Rubert et al, 2006). Shh signaling is a likely key target of fetal ethanol exposure as in zebrafish Shh mRNA overexpression rescues many of the morphological phenotypes induced by ethanol exposure (Ahlgren et al, 2002; Aoto et al, 2008; Arenzana et al, 2006; Li et al, 2007; Loucks and Ahlgren 2009). However, other recent studies have suggested that Shh signaling is likely not disrupted during ocular development in zebrafish exposed to ethanol, as cholesterol injection could not rescue ethanol-mediated effects on eye development (Kashyap et al, 2011). Fgf and Shh function is regulated by interactions with heparan sulfate proteoglycans (HSPGs) (Ornitz, 2000; Bornemann et al, 2004; Park et al, 2003; Takeo et al, 2005), and therefore our laboratory has been examining the role of the HSPG agrin in Fgf and Shh function. Previous studies from our laboratory demonstrated that the HSPG agrin in zebrafish regulates ocular development via a Fgf-dependent mechanism (Liu et al, 2008) and that ethanol-mediated disruption of zebrafish ocular development results from perturbed agrin and Shh function (Zhang et al, 2011).
Evidence exists for the dependence of forebrain GABAergic neuron development on Shh and Fgf signaling. Ventral forebrain GABAergic neuron specification in mice requires Fgf and Shh signaling (Gulasci and Lillien, 2003; Yung et al, 2002). The specification and development of GABAergic neurons in zebrafish forebrain requires coordinated Fgf19 and Shh signaling, with Shh signaling modulating Fgf19 expression (Miyake et al, 2005). In addition, Fgf3 and Fgf8 gene expression in zebrafish forebrain is under the control of Shh signaling (Miyake et al, 2005), raising the possibility that ethanol-mediated reductions in forebrain Fgf8 gene expression (Aoto et al, 2008) may be due to ethanol disrupting Shh function. In view of this accumulation of evidence that Shh function may be a critical target of ethanol exposure, this raises the interesting possibility that forebrain GABAergic neuron development may be perturbed by prenatal ethanol exposure.
Our recent studies in zebrafish have focused on the role of agrin in ethanol-mediated disruption of zebrafish nervous system development, with an emphasis on ocular development (Zhang et al, 2011). Agrin is a large ECM and cell surface HSPG (Tsen et al, 1995), originally characterized in the electric ray Torpedo californica NMJ (Nitkin et al, 1987), whose hallmark function is the regulation of neuromuscular junction synapse formation. Agrin also appears to contribute to CNS synapse formation, as in vitro agrin regulates GABAergic synapse formation (Ferreira 1999) and localizes to GABAergic synapses (Hering and Kroger 1999). However, in vivo agrin knockout experiments suggest agrin is only required for excitatory synapse formation (Ksiazek et al, 2007). As our previous studies in zebrafish have shown that agrin-induced microphthalmia is due at least in part to agrin-Fgf interactions (Liu et al, 2008), agrin binds to Fgfs with high affinity (Kim et al, 2003), and agrin loss-of-function following ethanol exposure can be rescued by Shh overexpression (Zhang et al, 2011), it is tempting to hypothesize that agrin may be a critical modulator of the function of Fgfs and Shh during the development of GABAergic neurons. The present work was therefore undertaken to assess whether neuronal systems known to be dependent on Fgf and Shh signaling for proper development are also sensitive to ethanol exposure, as well as dependent on agrin interactions with Fgfs and/or Shh. Our studies reported here show that both GABAergic and glutamatergic neurons in zebrafish are sensitive to ethanol exposure, and that ethanol appears to mediate this sensitivity via disruption of signaling pathways involving agrin, Fgf8/19 and/or Shh.
MATERIALS AND METHODS
Animals
Zebrafish were obtained from Zebrafish International Resource Center. The AB strain was used in these studies and fish were housed in automatic fish housing systems (Aquaneering, San Diego, CA) at 28.5° C.
Ethanol treatment of zebrafish embryos
Zebrafish embryos in fish water containing a 1:500 dilution of 0.1% methylene blue (to prevent fungal infection) and 0.003% 1-phenyl-2-thiourea (PTU, to inhibit pigmentation) were exposed to 0.5%–2.0% ethanol from 6–10 hpf, 10–18 hpf, 6–24 hpf, 24–48 hpf, or 48–72 hpf. Ethanol was diluted with fish water to its final concentration, and at the selected developmental stage for ethanol treatment embryos were placed in fresh fish water containing ethanol. At the end of the exposure period fish water containing ethanol was removed, embryos were washed once with fresh fish water, and then transferred to fresh fish water for the remainder of the experimental time-course.
Antisense morpholino injection
Antisense morpholino oligonucleotides (MOs) to agrin and Shh (Gene Tools, Philomath, OR) were designed against exon/intron splice sites. The LG2 agrin MO, which we have shown previously to produce mild to severe phenotypes depending on the concentration of MO injected into one-cell embryos (Kim et al, 2007; Zhang et al, 2011), was employed for these studies. We have shown previously that all agrin MO-induced defects are specific and not p53-mediated off-target defects (Liu et al, 2008). MOs were solubilized in water at a concentration of 0.1–1.0 mM before injection into one to two-cell stage embryos. Agrin MOs (0.1 pmol for subthreshold, 1 pmol for severe agrin morphant phenotypes) consistently produced reproducible phenotypes with an injection volume of 1 nl and robustly reduced agrin expression at 1 pmol injections. A general control MO purchased from Gene Tools to preclude MO toxicity, and used at the same concentration and volume, produces no detectable effects on zebrafish development as shown previously (Kim et al, 2007).
For subthreshold agrin or Shh MO experiments, embryos were injected with 0.1 pmol LG2 MO or 0.3 pmol Shh MO, and at 6 hpf were then exposed to 0.5% or 1% ethanol until 24 hpf. For Shh mRNA or Fgf8/19 mRNA rescue of agrin MO/ethanol exposure, embryos were co-injected with 0.1 pmol LG2 MO and 20 pg of capped ShhN 183 mRNA or 0.15 pg Fgf8 or 200pg Fgf19 mRNA. N-terminal 183 amino acid zebrafish Shh (ShhN183), full length Fgf8 and Fgf19 cDNAs were synthesized by using 22 hpf zebrafish embryo mRNA as template and oligodT as primer, using Superscript reverse transcriptase. PCR primers for ShhN183 were CGGAATTCATGCGGCTTTTGACGAGAGTG and GCTCTAGATCAGCAATGAATGTGGGCTTTGG. PCR primers for Fgf8 were CGGAATTCATGAGACTCATACCTTCACGG and GCTCTAGACTAACGCTCTCCTGAGTAGC. PCR primers for Fgf19 were CGGAATTCATGTTCCTCTTACTCTTTGTCAC and GCTCTAGATCATCTTTTGTTGAAGCTGGG. The PCR product was subcloned into pCS2 vector and confirmed by sequencing. Capped mRNA was synthesized with Ambion cap mRNA kit.
Whole-mount in situ hybridization
Whole-mount in situ hybridization was performed as previously described, with probe hybridization at 65°C (Kim et al, 2007; Liu et al, 2008). Digoxygenin-labeled riboprobes were transcribed from cDNAs encoding agrin (Kim et al, 2007), parvalbumin7 (Bae et al, 2009), Fgf8, GAD1, Gli1, Fgf19, Atonal1a, DAT, vglut1, and GABAARα6 receptor. cDNAs were synthesized by using 24 hpf zebrafish embryo mRNA as template for GAD1, Gli1, Fgf19, and atonal1a. 3dpf zebrafish embryo mRNA was used as template for DAT riboprobe synthesis. 7dpf zebrafish embryo mRNA was used as template for vglut1 and GABAARα6. PCR primers for GAD1 were GACTGATGGCGTCTTCTGC and CACCAGGATCTGCTCCAGG. PCR primers for Gli1 were GATGCCAGTGGATATGCAGC and CAGGATGACTGTAGATGTTCC. PCR primers for Fgf19 were CGGAATTCGTCTTTAATTACTGCAGATAATAC and GCTCTAGATGAACATCCACAAGAGATCAAT. PCR primers for atonal1a were CGGAATTCCCAGTACGAGGACGGAACAT and GCTCTAGAATTGGCGTCAGACACAACAA. Primers for DAT were CATGCTGAGAGGCAGACCG and CAATACCAGAGCTTTCATGAAC. Primers for Vglut1 were CGGAATTCGCCATCATCGTAGCCAACTT and GCTCTAGAAAATCCACTGAAGCCCACAG. Primers for GABAARα6 receptor were CGGAATTCGGATAGATGACCGGCTGAAA and GCTCTAGACTGGAGCTCTCCTGTGGAAC. GAD1, Gli1 and DAT PCR products were subcloned into pGEMT easy vector and confirmed by sequencing. Fgf19, atonal1a, vglut1 and GABAARα6 PCR products were subcloned into pCS2 vector. For different treatments all embryos (control and treatments) were developed for staining for the same amount of time, and analyzed by two different individuals to score embryos for altered or normal staining as a result of treatment. The second laboratory member scoring the embryos was blinded to the treatments and in most cases their scoring of gene expression levels was the same as the unblinded laboratory member. Differences in percent of embryos displaying reduced gene expression as a result of treatment were analyzed for statistical significance using ANOVA.
Immunostaining of zebrafish embryos
Zebrafish embryos were assessed for parvalbumin7 protein expression using a mouse monoclonal antibody that was a generous gift from Dr. Masahiko Hibi, using previously published protocols from our laboratory (Kim et al, 2007). Ethanol concentration test. After 6–24 hpf ethanol exposure, embryos in their chorion or that had been dechorionated were briefly washed either once or three times with 50mM Tris buffer pH 7. 15 embryos were pooled in 135 μl 50mM Tris buffer pH 7.4 (volume of one embryo was estimated to be 1 μl), the embryos were diluted 10 times, homogenized, and centrifuged. Supernatant was tested for ethanol according to the kit directions (Diagnostic Chemicals, Prince Edward Island, Canada). Each measurement of embryo ethanol concentration treatment was repeated three times using 15 pooled embryos for each experiment.
RESULTS
Ethanol tissue levels in zebrafish embryos
In order to better correlate our ethanol exposures with blood alcohol levels observed following human ethanol consumption, we quantified tissue ethanol levels in 24 hpf zebrafish embryos immediately following a 6–24 hpf ethanol exposure (Table 1). As shown in Table 1, exposure to 1.5% ethanol produces tissue ethanol concentrations approximating those seen in human binge drinking, with 2% ethanol exposure leading to slightly higher ethanol tissue concentrations (Table 1). In embryos with detached chorion and a single brief wash before measurement, ethanol concentrations approximated 32% of waterborne ethanol concentration (Reimers et al, 2004). Embryos washed for three times before measurement of ethanol concentrations displayed lower tissue ethanol levels, with dechorionated embryos having 25 mM concentration and embryos in their chorion having 75 mM concentration, following exposure to 1.5% ethanol.
Table 1.
Tissue ethanol concentrations in zebrafish correlate to the level of ethanol exposure.
| Ethanol treatment 6–24hpf | Ethanol Concentration (mM) | |
|---|---|---|
| Without chorion | In chorion | |
| Control | 0.4 ± 0.6 | 0.7 ± 0.6 |
| 0.5% ethanol | 16.5 ± 3.3 | 42.0 ± 2.2 |
| 1.5% ethanol | 44.0 ± 6.7 | 113.7 ± 15.1 |
| 2% ethanol | 64.9 ± 12.5 | 154.2 ± 12.2 |
Tissue levels were calculated from three experiments with 15 embryos that were pooled per experiment, and are shown as Mean ± S.D.
Forebrain GABAergic neuron development is sensitive to ethanol exposure
Our previous studies demonstrated that ethanol-induced perturbation of ocular development in zebrafish was mediated via molecular signaling pathways that utilized agrin and Shh (Zhang et al, 2011). Several studies demonstrate a dependence of mouse forebrain inhibitory interneuron development on Shh signaling (Yung et al, 2002; Gulasci and Lillien, 2003), as well as zebrafish forebrain GABAergic neuron specification (Miyake et al, 2005). We therefore postulated that zebrafish forebrain GABAergic neuron development would be sensitive to ethanol exposure. As a first experiment to test this possibility, we analyzed Gli1 mRNA expression in zebrafish embryos exposed to ethanol. Gli1 is a transcription factor that is activated following Shh binding to its receptor (Patched) and removal of Smoothened inhibition of the Shh signaling pathway. As shown in Figure 1, following ethanol exposure from 6–24 hpf Gli1 mRNA expression is markedly decreased in 24 hpf zebrafish embryos. However, it can be seen that the marked decrease in Gli1 expression was not observed until exposure of zebrafish embryos to 2% ethanol, whereas exposure to 1.5% ethanol will produce the typical morphological phenotypes of FASD, such as small eye phenotype (Zhang et al, 2011). We also show that treatment with either agrin or Shh MO will produce a reduction in Gli1 expression, with Shh MO treatment producing Gli1 expression similar to that observed with exposure to 2% ethanol (Figure 1 E, F). The number of treated embryos exhibiting decreased Gli1 expression as a result of the treatments was: 0.5% ethanol 0/30; 2% ethanol 60/70 (85.7%); 1pm agrin MO 30/32 (93.8%), and 1.5pm Shh MO 45/50 (90%).
Figure 1. Decreased Gli1 expression in 1 dpf ethanol-treated embryos, and agrin or Shh morphants.
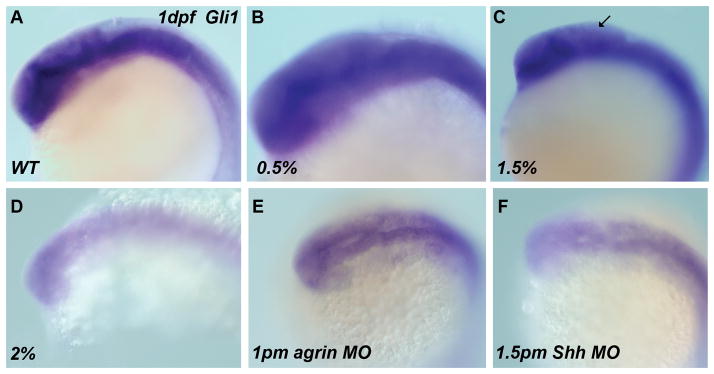
All embryos are 1 dpf stage and viewed from a dorsolateral orientation. All ethanol exposures were from 6–24 hpf. (A) WT; (B) 0.5% ethanol; (C) 1.5% ethanol; (D) 2% ethanol; (E) 1pm agrin MO and (F) 1.5pm Shh MO. The expression in 0.5% ethanol (B) is similar to that in (A) WT. It appears 1.5% ethanol results in a modest decrease in hindbrain Gli1 expression (arrow), with a more marked decreased expression observed with 2% ethanol exposure (D), 1pm agrin MO (C) and 1.5pm Shh MO (F).
In view of the observed widespread decrease in Gli1 expression in zebrafish embryos, this raised the possibility that neuron populations dependent on Shh signaling for development, such as forebrain GABAergic neurons, would be sensitive to ethanol exposure during development. To address this possibility, embryos exposed to a range of ethanol concentrations from 6–24 hpf were analyzed for glutamic acid decarboxylase (GAD1) mRNA expression, with this biosynthetic enzyme being a marker of GABAergic neurons. These data indicate that even with exposure to 1.5% ethanol GAD1 gene expression is reduced in 1 dpf zebrafish forebrain, although a more marked decrease is observed with 2% ethanol exposure (Figure 2 A, C, E, G). A similar decrease in GAD1 gene expression is observed following treatment with either agrin or Shh MO (Figure 2 I, K). We next assessed GAD1 expression in hindbrain at 3 dpf, an age when cerebellar GABAergic Purkinje cells are beginning to mature (Bae et al, 2009). When this analysis is extended to 3 dpf zebrafish embryos, a similar effect of ethanol exposure on GABAergic neuron development is observed in forebrain and hindbrain (Figure 2). The number of embryos exhibiting reduced GAD1 gene expression was quantified, with these data showing: 0.5% ethanol 2/55 (3.6%) in 1 dpf and 0/44 (0%) in 3 dpf; 1.5% ethanol 37/61(60.7%) in 1 dpf and 18/50 (36%) in 3 dpf; 2% ethanol 48/48 (100%) in 1dpf and 34/64 (53.1%) in 3 dpf; 1pm agrin MO 60/64 (93.8%) in 1 dpf and 80/100 (80.0%) in 3 dpf; 1.5pm Shh MO 30/48 (62.5%) in 1 dpf and 47/84 (56.0%) in 3 dpf. Collectively, these studies suggest that throughout the developing zebrafish brain, inhibitory GABAergic interneurons are sensitive to ethanol exposure.
Figure 2. Effect of ethanol and MO treatment on expression of GABAergic neuronal markers.

(A, C, E, G, I and K) GAD1 expression in 1 dpf embryos. (Bi-Bii, Di-Dii, Fi-Fii, Hi-Hii, Ji-Jii and Li-Lii) GAD1 expression in 3 dpf embryos. All ethanol exposures were from 6–24 hpf. (A–Bii) WT; (C–Dii) 0.5% ethanol; (E–Fii) 1.5% ethanol; (G–Hii) 2% ethanol, (I–Jii) 1pm agrin MO and (K–Lii) 1.5pm Shh MO. The expression in 0.5% ethanol (C–Dii) is similar to that in WT embryos (A–Bii). Decreased expression is observed in all other treated embryos, for both higher concentrations of ethanol and agrin or Shh MOs (E–Lii). Arrows denote forebrain staining in 1 dpf embryos (lateral view), open arrows denote forebrain staining in 3 dpf embryos (lateral view), and arrowheads denote hindbrain staining in 3 dpf embryos (dorsal view).
Since these studies on GAD1 gene expression indicate a susceptibility of these interneurons to ethanol exposure, we wanted to determine if other neuron cell types would be susceptible to ethanol exposure. We elected to examine the effect of ethanol on dopaminergic neurons, as populations of zebrafish dopaminergic neurons require Shh, but not Fgf8, signaling for differentiation (Holzschuh et al, 2003). We visualized these neurons using dopamine transporter (DAT) expression (Luo et al, 2008). In 1 dpf zebrafish embryos, we observe DAT expression in groups of neurons in forebrain, with ethanol exposure or agrin and Shh MO treatment not affecting DAT expression (Figure 3). In 5 dpf zebrafish embryos we observe a similar pattern of DAT expression following ethanol exposure, as well as Shh MO treatment, although agrin MO treatment results in an altered pattern of DAT expression (Figure 3). Thus, our studies suggest dopaminergic neuron development is not susceptible to ethanol exposure and that ethanol exposure is not having a global effect on neuronal development, but rather specific populations of neurons such as GABAergic neurons are sensitive to ethanol exposure.
Figure 3. Ethanol exposure has no affect on development of dopaminergic neurons.

(A, C, E and G) 1 dpf; (B, D, F and H) 5 dpf. (A–B) WT; (C–D) 2% ethanol; (E–F) 1pm agrin MO; (G–H) 1.5pm Shh MO. Embryos were examined using DAT in situ hybridization. Double-end arrows point to the DAT expression in 1 dpf embryos, and arrows point to the DAT expression in 5 dpf embryos. It can be seen that similar DAT expression is observed in treated embryos (C–H) and WT embryos (A–B).
Timing of ethanol exposure regulates developmental phenotypes
The ethanol exposure used to disrupt GAD1 gene expression was from 6–24 hpf, a period in zebrafish that encompasses both gastrulation from 5.25–10 hpf and the beginning of neurulation at 10 hpf and continuing through 24 hpf. Thus, we were interested in determining whether specific developmental processes, such as gastrulation vs neurulation, were more sensitive to ethanol exposure with a resulting disruption of forebrain GABAergic neuron specification. As shown in Figure 4 and summarized in Table 2, exposure to ethanol from 6–10 hpf did not have a noticeable effect on GABAergic neuron development in 1 dpf forebrain, as well as 3 dpf forebrain or hindbrain. Conversely, ethanol exposure from 10–18 hpf produced a marked diminution in GAD1 gene expression in both forebrain and hindbrain, especially following 2% ethanol exposure (Figure 4). A majority of embryos exhibited diminished GAD1 expression following ethanol exposure from 10–18 hpf (Table 2), suggesting that ethanol exposure during neurulation, as opposed to gastrulation, appears to more critical to inducing ethanol-mediated defects in early CNS development.
Figure 4. Ethanol exposure from 10–18 hpf induces more severe GAD1 expression phenotypes than ethanol exposure from 6–10 hpf.

(A–Jii) Analysis of GAD1 mRNA expression in 1 dpf embryos (lateral view, A, C, E, G and I) and 3 dpf embryos (lateral view and dorsal view respectively, Bi-Bii, Di-Dii, Fi-Fii, Hi-Hii and Ji-Jii). (A, B) WT; (C, D) 6–10 hpf 1.5% ethanol; (E, F) 6–10 hpf 2% ethanol; (G, H) 10–18 hpf 1.5% ethanol; (I, J) 10–18 hpf 2% ethanol. GAD1 expression in (C–Fii, Hi-Hii) is similar to that in WT (A–Bii). Decreased GAD1 expression is observed in (G and I–Jii). The ratio of the embryos from different ethanol exposure times and concentrations that show the above abnormal phenotypes is shown in Table 2.
Table 2.
The ratio of embryos with different ethanol exposure times and concentrations that show decreased GAD1 expression.
| Ethanol exposure time | Treatment | Ratio showing decreased GAD1 phenotype | |||
|---|---|---|---|---|---|
| 1 dpf | 3 dpf | ||||
| Overall | Mean ± SD (%) | Overall | Mean ± SD (%) | ||
| 6–10hpf | 1.5% ethanol | 2/28 | 6.7 ± 5.9 | 1/31 | 3.4 ± 5.0 |
| 2% ethanol | 10/35 | 28.6 ± 1.4* | 14/54 | 24.7 ± 5.3* | |
| 10–18hpf | 1.5% ethanol | 24/44 | 54.1 ± 6.8** | 17/54 | 32.0 ± 5.2** |
| 2% ethanol | 35/47 | 73.9 ± 8.3** | 29/63 | 46.2 ± 3.4** | |
Overall ratio came from three independent experiments, and data are shown as % Mean ± S.D
Significantly different from control, P<0.05
Significantly different from control, P<0.001
We extended our analyses on GAD1 gene expression to assess the effects of later ethanol exposures on GABAergic neuron development. In rodent GABAergic neuron development is sensitive to ethanol exposure across all three trimester equivalents of human gestation (Hamre and West, 1993; Maier et al, 1999). Thus, we exposed zebrafish embryos to 2% ethanol from 6–24 hpf, 24–48 hpf or 48–72 hpf, as an approximation of the three trimester equivalents. As shown in Figure 5A, B, in 5 dpf zebrafish embryos GAD1 expression levels following a 6–24 hpf ethanol exposure appear to be similar to control embryos. In contrast, following either a 24–48 hpf or 48–72 hpf ethanol exposure, the level of GAD1 gene expression is markedly reduced in 5 dpf zebrafish brain (Figure 5 C, D). The ratio of different treated embryos that show decreased GAD1 expression is 12/65 (18.5%) with 6–24 hpf exposure, 37/47 (78.7%) with 24–48 hpf exposure, and 41/56 (73.2%) with 48–72 hpf exposure. These data therefore suggest that ethanol exposures throughout development can produce deficits in GABAergic neuron development, although at later stages of zebrafish embryo development the most marked effects on GAD1 expression appear to result from later ethanol exposures.
Figure 5. Effect of timing of ethanol exposure on GAD1 and parv7 expression in 5 dpf zebrafish brain.

(A–D), whole-mount in situ hybridization of GAD1. (E–H), whole-mount in situ hybridization of parv7. (I–L), immunohistochemistry for parv7 protein. GAD1 expression in WT (A) and embryos exposed to 2% ethanol from 6–24 hpf (B) appears normal when analyzed in 5 dpf zebrafish brain. GAD1 expression levels are diminished in 5 dpf embryos exposed to 2% ethanol from 1–2 dpf hpf (C) or 2–3 dpf (D). E–H, parv7 mRNA expression in control embryos and embryos exposed to 2% ethanol appears unchanged as a result of ethanol exposure. I–L, Parv7 protein levels were assessed by immunohistochemistry in 5 dpf embryos. Weak hindbrain expression (arrows) is detected in control embryos (I) and embryos exposed to 2% ethanol from 1–2 dpf (K) or 2–3 dpf (L). However, enhanced parv7 immunostaining is detected in 44/51 embryos exposed to 2% ethanol from 6–24 hpf (J). The double arrow denotes similar levels of fin parv7 immunostaining in all treatments. Dorsal views are shown for all embryos.
Since the effects of ethanol on development of GABAergic neurons could be resulting in selective altered expression of GAD1, but not affecting other aspects of GABAegic neuron differentiation, we analyzed a second molecular marker of GABAergic neurons, parvalbumin7 (pvalb7; Bae et al, 2009). As shown in Figure 5 E–H, similar levels of pvalb7 gene expression were observed in 5 dpf embryos following exposure to 2% ethanol at all time points. However, unexpectedly we observed augmented immunostaining for parv7 protein in embryos exposed to 2% ethanol from 6–24 hpf, but not during the 1–2 dpf and 2–3 dpf treatments (Figure 5 I–L). In 5 dpf embryos treated with Shh MO we also detected enhanced parv7 immunostaining coupled with normal GAD1 and parv7 mRNA expression levels, similar to embryos exposed to 2% ethanol from 6–24 hpf (data not shown).
Role of Fgf and Shh signaling in GABAergic neuron development and susceptibility to ethanol
Previous studies on the molecular pathways regulating forebrain GABAergic neuron development in zebrafish indicated that these neurons require Fgf19 signaling that acts downstream of Shh signaling (Miyake et al, 2005). As we show that forebrain GABAergic neuron development is susceptible to ethanol exposure, this raises the question of whether ethanol is disrupting Fgf19 and/or Shh signaling to disrupt GAD1 gene expression. We therefore first examined whether ethanol exposure leads to alterations in Fgf19 gene expression in zebrafish, since cyclopamine treatment that disrupts Shh signaling will reduce zebrafish Fgf19 gene expression (Miyake et al, 2005). Figure 6 illustrates the effect of ethanol exposure on Fgf19 expression, with exposure to either 1.5% or 2% ethanol from 6–24 hpf resulting in diminished Fgf19 mRNA expression. We also observed a similar effect of agrin or Shh MO treatment on Fgf19 gene expression (Figure 6 E, F). Consistent with ethanol and agrin or Shh MO treatment reducing Fgf19 expression, we find that combining a subthreshold dose of ethanol with low doses of MO produces diminished Fgf19 mRNA expression in 1 dpf zebrafish embryos (Figure 7). Interestingly, even with low dose Shh MO injection we observed the reduced expression of Fgf19 in about 50% of embryos, whereas low dose agrin MO had no effect on Fgf19 expression (Figure 7 B and E and Table 3). We are able to rescue the ethanol- and MO-mediated decrease in Fgf19 gene expression by overexpression of Shh mRNA (Figure 7 D, H). The number of embryos exhibiting reduced Fgf19 mRNA expression is quantified in Table 3 and demonstrates the efficacy of the Shh rescue on Fgf19 expression. Thus, these data suggest that ethanol is acting via an agrin and Shh signaling pathway to regulate Fgf19 gene expression in early zebrafish embryos.
Figure 6. Fgf19 gene expression is decreased by ethanol exposure and agrin or Shh MO in 1dpf embryos.
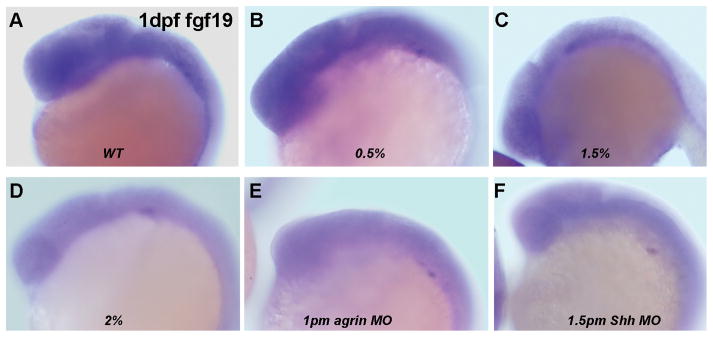
Lateral view of WT (A) and 6–24 hpf ethanol exposed embryos (B–D). (B) 0/5% ethanol; (C) 1.5% ethanol; (D) 2% ethanol; (E) 1pm agrin MO; (F) 1.5pm Shh MO. (B) 0.5% ethanol has no effect on Fgf19 expression and is WT-like. Fgf19 expression is markedly decreased in (C–F). The ratio of embryos with decreased Fgf19 expression with different treatments is quantified in Table 3.
Figure 7. Low dosage of ethanol and agrin MO or Shh MO induces decreased Fgf19 expression, which can be rescued by Shh mRNA.
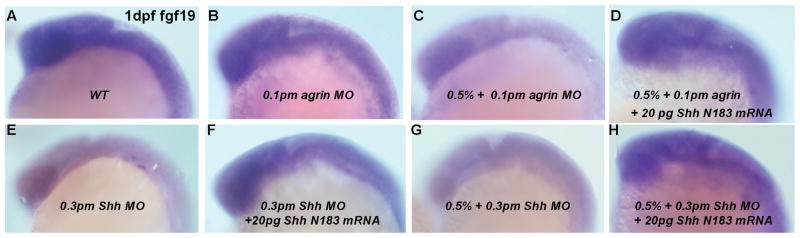
All embryos analyzed were 1 dpf and all ethanol exposure times were 6–24 hpf. Lateral views are shown. (A) WT; (B) 0.1pm agrin MO; (C) 0.5% ethanol and 0.1pm agrin MO; (D) 0.5% ethanol, 0.1pm agrin MO and 20pg Shh N183 mRNA; (E) 0.3pm Shh MO; (F) 0.3pm Shh MO and 20pg Shh N183 mRNA; (G) 0.5% ethanol and 0.3pm Shh MO; (H) 0.5% ethanol, 0.3pm Shh MO and 20pg Shh N183 mRNA. (A–B, D, F, H) WT-like expression levels; (C, E, G) decreased Fgf19 expression. The ratio of decreased Fgf19 expression in different treatment groups is quantified in Table 3.
Table 3.
The ratio of different treated embryos that show disrupted Fgf19 gene expression at 1 dpf following ethanol exposure from 6–24 hpf.
| Treatment | Ratio of disrupted Fgf19 expression | |
|---|---|---|
| Overall | Mean +/− SD (%) | |
| 0.5% ethanol | 2/38 | 5.3 ± 4.7 |
| 1.5% ethanol | 19/34 | 55.7 ± 5.1a |
| 2% ethanol | 41/49 | 87.5 ± 11.7a |
| 1pm agrin MO | 69/101 | 71.7 ± 9.9a,b |
| 1.5pm Shh MO | 113/127 | 89.3 ± 3.4a,c |
| 0.1pm agrin MO | 6/41 | 13.1 ± 6.9 |
| 0.5% ethanol plus 0.1pm agrin MO | 23/44 | 52.7 ± 2.8a,b |
| 0.5% ethanol plus 0.1pm agrin MO and 20pg Shh N183 mRNA | 3/44 | 6.1 ± 5.6 |
| 0.3pm Shh MO | 25/42 | 59.2 ± 2.2 |
| 0.3pm Shh MO and 20 pg Shh N183 mRNA | 3/45 | 6.5 ± 0.6d |
| 0.5% ethanol plus 0.3pm Shh MO | 47/51 | 93.4 ± 5.8a,d |
| 0.5% ethanol plus 0.3pm Shh MO and 20pg Shh N183 mRNA | 7/43 | 16.6 ± 1.6d,e |
Overall ratio came from three independent experiments, and data are shown as % Mean ± S.D
Significantly different from 0.5% ethanol, P<0.001
Significantly different from 0.1 pm agrin MO, P<0.001
Significantly different from 0.3pm Shh MO, P<0.05
Significantly different from 0.3pm Shh MO, P<0.001
Significantly different from 0.5% ethanol plus 0.3pm Shh MO, P<0.001
Based on this effect of ethanol on Fgf19 gene expression in zebrafish forebrain, we predicted that ethanol-, agrin- and Shh-mediated reductions in GAD1 expression would be rescued by overexpression of genes acting downstream of the ethanol disruption, in this case Fgf19 and Shh. Analyzing 1 dpf forebrain following ethanol exposure from 6–24 hpf, we observed rescue of the reduced GAD1 expression phenotype induced by combined ethanol and agrin or Shh MO treatment by either Shh, Fgf8 or Fgf19 mRNA overexpression (Figure 8 A–C). We observed a similar pattern of GAD1 gene expression in 3 dpf forebrain and hindbrain as a consequence of ethanol exposure from 6–24 hpf (Figure 8 D–G). Combined subthreshold ethanol and either agrin or Shh MO results in a markedly reduced level of GAD1 gene expression, when compared to subthreshold ethanol or MO treatment alone (Figure 8 D–G). Rescue of GAD1 expression is observed in each of these combined ethanol and MO treatment groups following Shh, Fgf8 or Fgf19 overexpression (Figure 8 H–O). The number of embryos exhibiting reduced GAD1 mRNA expression is quantified in Table 4 and demonstrates the efficacy of the Shh, Fgf8 and Fgf19 rescues. In most cases it appears that Fgf19 overexpression is most effective in rescuing the GAD1 expression phenotype in both 1 dpf and 3 dpf embryos, possibly as a result of Fgf19 being downstream of Shh signaling as shown previously (Miyake et al, 2005).
Figure 8. GAD1 expression is decreased in embryos with combined treatment of low dosage ethanol and agrin or Shh MO, which can be rescued by Shh, Fgf8 or Fgf19 mRNA.

All ethanol exposures were 6–24 hpf. (A–Cv) Lateral view of 1 dpf embryos; (Di-Oii) Lateral or dorsal view of 3 dpf embryos. (A) WT; (Bi) 0.1pm agrin MO, which has WT-like expression; (Bii-Bv) 0.5% ethanol and 0.1pm agrin MO with or without mRNA co-injection. (Ci) 0.3pm Shh MO which has WT-like expression; (Cii-Cv) 0.5% ethanol and 0.3pm Shh MO with or without mRNA co-injection. GAD1 expression is decreased in embryos without mRNA rescue (Bii, Cii) and was rescued in 20pg Shh N183 mRNA (Biii, Ciii), 0.15pg fgf8 mRNA (Biv, Civ) and 200pg Fgf19 mRNA overexpression (Bv, Cv). (Di-Dii) WT; 3 dpf embryos (Ei-Eii) 1% ethanol display WT-like GAD1 expression; (Fi-Fii) 0.1pm agrin MO with WT-like expression; (Gi-Jii) 1% ethanol and 0.1pm agrin MO with or without mRNA co-injection. (Ki-Kii) 0.3pm Shh MO with WT-like expression; (Li-Oii) 1% ethanol and 0.3pm Shh MO with or without mRNA co-injection. GAD1 expression is decreased in embryos without Shh, Fgf8 or Fgf19 mRNA (Gi-Gii and Li-Lii) and was rescued in Shh mRNA (Hi, Hii and Mi, Mii), Fgf8 mRNA (Ii, Iii and Ni, Nii) or Fgf19 mRNA (Ji, Jii and Oi, Oii). The ratio of different treated embryos that have decreased GAD1 expression is shown in Table 4.
Table 4.
The ratio of different treated embryos that show decreased GAD1 expression following ethanol exposure from 6–24 hpf.
| Embryo stage | Treatment | Ratio of decreased GAD1 expression | |
|---|---|---|---|
| Overall | Mean ± SD (%) | ||
| 1dpf | 0.1pm agrin MO | 5/48 | 10.5 ± 3.4 |
| 0.5% ethanol plus 0.1pm agrin MO | 41/73 | 56.8 ± 13.8a,b | |
| 0.5% ethanol plus 0.1pm agrin MO and 20pg Shh N183 mRNA | 17/89 | 19.7 ± 1.6c | |
| 0.5% ethanol plus 0.1pm agrin MO and 0.15pg fgf8 mRNA | 9/47 | 19.6 ± 2.2c | |
| 0.5% ethanol plus 0.1pm agrin MO and 200pg fgf19 mRNA | 5/44 | 9.2 ± 8.2d | |
| 0.3pm Shh MO | 1/35 | 2.8 ± 4.8 | |
| 0.5% ethanol plus 0.3pm Shh MO | 42/101 | 43.7 ± 7.3a,e | |
| 0.5% ethanol plus 0.3pm Shh MO and 20pg Shh N183 mRNA | 19/145 | 13.0 ± 1.0d | |
| 0.5% ethanol plus 0.3pm Shh MO and 0.15pg fgf8 mRNA | 3/48 | 5.0 ± 4.8d | |
| 0.5% ethanol plus 0.3pm Shh MO and 200pg fgf19 mRNA | 3/46 | 3.7 ± 6.4d | |
| 3dpf | 1% ethanol | 11/46 | 25.1 ± 3.5 |
| 0.1pm agrin MO | 0/27 | 0 ± 0 | |
| 1% ethanol plus 0.1pm agrin MO | 19/38 | 48.3 ± 4.8f | |
| 1% ethanol plus 0.1pm agrin MO and 20pg Shh N183 mRNA | 7/39 | 17.0 ± 2.9d | |
| 1% ethanol plus 0.1pm agrin MO and 0.15pg fgf8 mRNA | 6/36 | 15.3 ± 3.4d | |
| 1% ethanol plus 0.1pm agrin MO and 200pg fgf19 mRNA | 3/27 | 9.7 ± 8.7d | |
| 0.3pm Shh MO | 2/24 | 7.4 ± 6.4 | |
| 1% ethanol plus 0.3pm Shh MO | 23/43 | 53.8 ± 1.6g | |
| 1% ethanol plus 0.3pm Shh MO and 20pg Shh N183 mRNA | 6/28 | 20.5 ± 6.5h | |
| 1% ethanol plus 0.3pm Shh MO and 0.15pg fgf8 mRNA | 10/42 | 23.7 ± 2.6i | |
| 1% ethanol plus 0.3pm Shh MO and 200pg fgf19 mRNA | 4/32 | 11.1 ± 10.1h | |
Overall ratio came from three independent experiments, and data are also shown as % Mean ± S.D
Significantly different from 0.5% ethanol, P<0.001
Significantly different from 0.1 pm agrin MO, P<0.001
Significantly different from ethanol plus agrin MO, P<0.05
Significantly different from ethanol plus respective MO, P<0.001
Significantly different from 0.3 pm Shh MO, P<0.001
Significantly different from 1% ethanol or 0.1pm agrin MO, P<0.05
Significantly different from 1% ethanol or 0.3pm Shh MO, P<0.01
Significantly different from ethanol plus respective MO, P<0.001
Significantly different from ethanol plus respective MO, P<0.01
Cerebellar granule cell development is sensitive to ethanol exposure
Since granule cells are susceptible to acute ethanol exposure in mammalian cerebellum (Hamre and West, 1993), and a strong correlation exists between granule cell and Purkinje cell loss in cerebellum (Hamre and West, 1993), we were interested in ascertaining if granule cell development would be sensitive to ethanol exposure in zebrafish cerebellum. Presumptive granule cell cells are derived from the upper rhombic lip, which in mouse and zebrafish brain is characterized by atoh1/atonal1 gene expression (Alder et al, 1996; Ben-Arie et al, 1997; Wang et al, 2005; Volkmann et al, 2008). We therefore examined atonal1a gene expression beginning at 18 hpf in zebrafish, and do not observe expression until 20 hpf (Figure 9 A, B). The pattern of expression changes from a ventricular pattern of expression in the rhombic lip at 20–30 hpf (type I pattern of expression, Figure 9 B–E) to a defined cluster of expression in the valvula cerebelli at 2–3 dpf (type II expression pattern; Figure 9 F–I). Expression of atonal1a mRNA in the zebrafish upper rhombic lip is markedly reduced by exposure to either 1.5% or 2.0% ethanol in 24 hpf embryos, and is also perturbed by either agrin or Shh MO injection (Figure 9 J). However, when analyzing 30 hpf embryos atonal1a gene expression is unaffected by ethanol or Shh MO treatment (Figure 9 K), suggesting that ethanol may cause a developmental delay in atonal1a expression, with expression reduced at 24 hpf but not at 30 hpf. Consistent with this conclusion, when atonal1a gene expression is analyzed in 2 dpf and 2d2hpf embryos the expression pattern resembles the type I pattern (rhombic lip) rather than the type II pattern, following exposure to 1.5% or 2% ethanol (Figure 9 L–N). It can also be seen that agrin and Shh MOs produce this developmental delay in atonal1a gene expression. By 3 dpf of development the pattern of gene expression appears normal following ethanol exposure or agrin and Shh MO injection, suggesting that by 3 dpf the developmental delay has recovered or that the type II pattern of expression at this developmental stage is resistant to these treatments. Table 5 summarizes the ratio of embryos with different patterns of atonal1a gene expression, as well as decreased expression, as a consequence of ethanol exposure or treatment with agrin or Shh MO.
Figure 9. Atonal1a expression patterns during zebrafish development and in response to ethanol exposure or MO treatment.

All ethanol treatments were from 6–24 hpf, and dorsal view is shown for all embryos. (A) 18 hpf; (B) 20 hpf; (C) 22 hpf; (D and Ji-Jv) 24 hpf; (E and Ki-Kiv) 30 hpf; (F and Li-Lv) 2 dpf; (G and Mi-Miv) 2d2hpf; (H and Ni-Niv) 2d6hpf; (I and Oi-Ov) 3 dpf. (A–I) WT; (Ji and Oi) 0.5% ethanol; (Jii, Ki, Lia, Lib, Mi, Ni and Oii) 1.5% ethanol; (Jiii, Kii, Lii, Mii, Nii and Oiii) 2% ethanol; (Jiv, Kiii, Liii, Miii, Niii and Oiv) 1pm agrin MO; (Jv, Kiv, Liv, Miv, Niv and Ov) 1.5pm Shh MO. There is no obvious expression of atonal1a that is observed in 18 hpf WT embryos (A). Atonal1a expression can be seen in 20 hpf and later stages (B–I). The expression pattern from 20 hpf to 30 hpf (B–E) is similar and designated as type-I pattern (indicated by arrow heads). The expression pattern from 2 dpf to 3 dpf (F–I) is similar and designated as type-II pattern (indicated by arrows). In 24 hpf embryos, there is no obvious change in atonal1a expression with 0.5% ethanol treatment (Ji), but is decreased with 1.5% ethanol (Jii), 2% ethanol (Jiii), 1 pm agrin MO (Jiv) and 1.5pm Shh MO (Jv). In 30 hpf embryos, there is no obvious change with 1.5% ethanol exposure (Ki), or 2% ethanol (Kii), 1.5pm Shh MO (Kiv), but is decreased in 1pm agrin MO (Kiii). In 2 dpf embryos, while in WT the expression pattern is type-II (F), in 1.5% ethanol exposed embryos, we observed both type-II (Lia) and type-I patterns (Lib). Most embryos with 2% ethanol exposure (Liii), 1pm agrin MO (Liv) and 1.5pm Shh MO (Lv) have type-I expression pattern. In 2d2hpf embryos, 1.5% ethanol exposed embryos have type-II expression (Mi); 2% ethanol resembles type-II pattern (Mii); and morphants show type-I pattern (Miii-Miv). In 2d6hpf embryos, both 1.5% and 2% ethanol (Ni-Nii) are similar to WT and have type-II pattern, and morphants have type-I pattern (Niii-Niv). In 3 dpf embryos, all treated embryos (Oi-Ov) are similar to WT and have type-II expression pattern. The ratio of the expression patterns for atonal1a in different treatment groups is shown in Table 5.
Table 5.
The ratio of Atonal1a expression patterns with different ethanol and MO treatments.
| Embryos stage | Treatment | Ratio of changed Atonal1a expression |
|---|---|---|
| 24 hpf | WT | Type-I pattern |
| 0.5% ethanol | 1/48 decreased (0.02%) | |
| 1.5% ethanol | 35/35 decreased (100%) | |
| 2% ethanol | 42/42 decreased (100%) | |
| 1pm agrin MO | 44/44 decreased (100%) | |
| 1.5pm Shh MO | 47/48 decreased (97.9%) | |
| 30hpf | WT | Type-I pattern |
| 1.5% ethanol | 30/30 type-I pattern (100%) | |
| 2% ethanol | 30/30 type-I pattern (100%) | |
| 1pm agrin MO | 28/30 decreased (93.3%) | |
| 1.5pm Shh MO | 30/30 type-I pattern (100%) | |
| 2d | WT | Type-II pattern |
| 1.5% ethanol | 12/34 type-I pattern (35.3%) 22/34 type-II pattern (64.7%) |
|
| 2% ethanol | 30/30 type-I pattern (100%) | |
| 1pm agrin MO | 33/33 type-I pattern (100%) | |
| 1.5pm Shh MO | 36/36 type-I pattern (100%) | |
| 2d2hpf | WT | Type-II pattern |
| 1.5% ethanol | 30/30 type-II pattern (100%) | |
| 2% ethanol | 30/30 close to type-II pattern (100%) | |
| 1pm agrin MO | 30/30 type-I pattern (100%) | |
| 1.5pm Shh MO | 30/30 type-I pattern (100%) | |
| 2d6hpf | WT | Type-II pattern |
| 1.5% ethanol | 30/30 type-II pattern (100%) | |
| 2% ethanol | 30/30 type-II pattern (100%) | |
| 1pm agrin MO | 30/32 type-I pattern (93.8%); 2/32 type-II pattern (6.2%) | |
| 1.5pm Shh MO | 31/36 type-I pattern (86.1%); 5/36 type-II pattern (13.9%) | |
| 3dpf | WT | Type-II pattern |
| 0.5% ethanol | 38/38 Type-II pattern (100%) | |
| 1.5% ethanol | 32/32 Type-II pattern (100%) | |
| 2% ethanol | 38/38 Type-II pattern (100%) | |
| 1pm agrin MO | 35/35 Type-II pattern (100%) | |
| 1.5pm Shh MO | 43/43 Type-II pattern (100%) |
Since ethanol exposure, as well as agrin or Shh MO treatment, decreases atonal1a gene expression and delays maturation of an atonal1a-positive rhombic lip, we tested the possibility that ethanol mediates its effects on atonal1a expression via a molecular signaling pathway involving agrin, Shh and Fgfs. Subthreshold concentrations of ethanol and agrin or Shh MO were combined to reduce atonal1a gene expression (Figure 10A–C and G, H), with combined agrin MO and 0.5% ethanol decreasing expression in 52/90 embryos (57.8%), and combined Shh MO and ethanol decreasing expression in 48/85 embryos (56.5%). Overexpression of either Shh, Fgf8 or Fgf19 mRNA rescued this atonal1a expression phenotype (Figure 10 D–F and I–K), indicating that the development of atonal1a-positive presumptive granule cells involves a pathway requiring agrin, Shh and Fgfs, that is sensitive to ethanol exposure. With Shh mRNA rescue 20/73 (27.4%) of agrin MO/ethanol and 20/74 (27.0%) of Shh MO/ethanol embryos displayed decreased atonal1a expression. With Fgf8 mRNA rescue 3/31 (9.1%) of agrin MO/ethanol and 2/18 (7.1%) of Shh MO/ethanol embryos displayed decreased atonal1a expression. With Fgf19 mRNA rescue 5/43 (11.6%) of agrin MO/ethanol and 5/29 (17.2%) of Shh MO/ethanol embryos displayed decreased atonal1a expression.
Figure 10. Shh, Fgf8 or Fgf19 mRNA overexpression can rescue the more severe decreased Atonal1a expression phenotype in embryos treated with low dosage ethanol and agrin MO or Shh MO.

All ethanol exposures were from 6–24 hpf, with dorsal views shown. (A) WT; (B) 0.1pm agrin MO; (C–F) 0.1pm agrin MO, 0.5% ethanol with or without mRNA rescue: (C) no mRNA; (D) Shh mRNA; (E) Fgf8 mRNA and (F) Fgf19 mRNA. (G) 0.3pm Shh MO; (H–K) 0.3pm Shh MO, 0.5% ethanol with or without mRNA rescue: (H) no mRNA; (I) Shh mRNA; (J) Fgf8 mRNA and (K) Fgf19 mRNA. The atonal1a expression in (B, D–F, G and I–K) is similar to WT (A). Decreased expression is observed in embryos treated with low dose ethanol and MO, without any mRNA rescue (C and H).
As granule cell precursor development is susceptible to ethanol exposure, we wanted to specifically assess the effects of ethanol exposure on granule cell development using two distinct markers of differentiated mature cerebellar granule cells (vglut1 and GABAARα6). We first assessed expression of the vesicular glutamate transporter vglut1, which is expressed by differentiated glutamatergic granule cells in cerebellum (Bae et al, 2009). In both 3 dpf and 7 dpf zebrafish embryos we observed a marked decrease in vglut1 gene expression as a result of exposure to either 1.5% or 2% ethanol, as well as following agrin or Shh MO treatment (Figure 11). The ratio of embryos with decreased vglut1 expression with different treatments is: 3dpf, 0.5% ethanol 0/30 (0%); 1.5% ethanol 30/57 (52.6%); 2% ethanol 42/44 (95.5%); 1 pm agrin morphants 56/56 (100%); 1.5 pm Shh morphants 54/65 (83.1%); 7dpf, 0.5% ethanol 0/30 (0%); 1.5% ethanol 20/45 (44.4%); 2% ethanol 42/54 (77.8%); 1 pm agrin morphants 47/48 (97.9%); 1.5 pm Shh morphants 51/62 (82.3%). We also analyzed a second marker of mature granule cells, expression of the GABAA receptor subunit GABAARα6, which is only expressed by granule cells in cerebellum (Bae et al, 2009). GABAARα6 mRNA expression is also markedly diminished by ethanol exposure and agrin or Shh MO treatment, in 7 dpf zebrafish cerebellum, exhibiting a pattern of expression as was observed for vglut1 (Figure 12). The ratio of embryos with decreased GABAARα6 expression with different treatments is: 0.5% ethanol 0/52 (0%); 1.5% ethanol 31/35 (88.6%); 2% ethanol 45/51 (88.2%); 1 pm agrin morphants 58/60 (96.7%); 1.5 pm Shh morphants 62/66 (93.9%). Thus, two markers of mature granule cells in zebrafish cerebellum exhibit a pronounced diminution in expression as a consequence of ethanol exposure or agrin and Shh MO treatment. However, we have observed that subthreshold ethanol exposure combined with low dosage agrin or Shh MO treatment does not produce a reduction in vglut1 or GABAARα6 expression (data not shown), suggesting that ethanol’s effects on granule cell development may involve multiple molecular pathways acting in parallel.
Figure 11. Vglut1 mRNA expression is decreased in embryos exposed to ethanol or treated with agrin or Shh MOs.

All ethanol exposures were from 6–24 hpf, and embryos are shown in lateral or dorsal view. Embryos were analyzed at either 3 dpf (Ai–Aii, Ci–Cii, Ei–Eii, Gi–Gii, Ii–Iii, Ki and Kii) or 7 dpf (Bi–Bii, Di–Dii, Fi–Fii, Hi–Hii, Ji–Jii, Li and Lii). (Ai–Bii) WT; (Ci–Dii) 0.5% ethanol; (Ei–Fii) 1.5% ethanol; (Gi–Hii) 2% ethanol; (Ii–Jii) 1pm agrin MO; (Ki–Lii) 1.5pm Shh MO. It can be seen that while vglut1 expression after 0.5% ethanol exposure is similar to that in WT (A–D), exposure to 1.5% or 2% ethanol, and agrin or Shh MO, markedly reduces vglut1 expression in both brain and retina (E–L). Arrows indicate the vglut1 expression in hindbrain.
Figure 12. GABAARα6 mRNA expression is decreased in 7 dpf embryos exposed to ethanol or treated with agrin or Shh MO.

All ethanol exposures were from 6–24 hpf, with lateral and dorsal views shown. (Ai–Aii) WT; (Bi–Bii) 0.5% ethanol; (Ci–Cii) 1.5% ethanol; (Di–Dii) 2% ethanol; (Ei–Eii) 1 pm agrin MO; (Fi–Fii) 1.5 pm Shh MO. Again expression with exposure to 0.5% ethanol is WT-like (B). Arrows indicate GABAARα6 expression in hindbrain. This expression is decreased in embryos exposed to 1.5% or 2% ethanol, or treated with agrin or Shh MO (Ci-Fii).
Lastly, we qualitatively analyzed brain volume of 7 dpf zebrafish embryos exposed to ethanol or treated with agrin or Shh MO, using hematoxylin and eosin staining of paraffin sectioned brains. As shown in Figure 13, exposure to 2% ethanol or treatment with agrin or Shh MO results in a significant decrease in brain volume. These data are consistent with the morphological detection of microcephaly in embryos exposed to ethanol or treated with agrin or Shh MOs, as well as the marked reduction in expression of markers of GABAergic and glutamatergic neurons.
Figure 13. Decreased whole brain volume in ethanol-treated embryos and agrin or Shh morphants at 7 dpf.

(A) WT; (B) 6–24 hpf 2% ethanol exposure; (C) 1 pm agrin MO; (D) 1.5 pm Shh MO. The whole brain volume, as assessed by hematoxylin and eosin staining, is obviously decreased in the treated embryos (B–D) when compared to WT (A). The arrow and asterisk in each panel denote landmarks that indicate the same region of the embryo is being visualized, supporting a decreased brain volume in response to ethanol exposure.
DISCUSSION
Our rationale for the current studies was based on previous studies in rodent that have shown that prenatal ethanol exposure affects both forebrain and hindbrain development, with analysis of molecular pathways impacted by ethanol suggesting that in the telencephalon Shh and Fgf8 signaling are likely targets of ethanol (Aoto et al, 2008). Since the differentiation of GABAergic interneurons in rodent telencephalon is dependent on Shh signaling (Yung et al, 2002; Gulasci and Lillien, 2003), and these Shh-responsive progenitor cells are derived from Fgf-responsive stem cells (Marin and Rubenstein, 2001), this raises the possibility that forebrain GABAergic interneuron development will be susceptible to prenatal ethanol exposure. Likewise, in zebrafish GABAergic neuron specification is regulated by Shh and Fgf19 signaling, with Shh controlling expression of Fgf19 (Miyake et al, 2005). In cerebellum, the development of GABAergic Purkinje cells and glutamatergic granule cells is also adversely affected by ethanol exposure (Cragg and Phillips, 1985; Goodlett et al, 1990; Hamre and West, 1993; Napper and West, 1995; Goodlett and Eilers, 1997; Maier et al, 1999; Karacay et al, 2008). In view of evidence that Purkinje cells synthesize Shh (Dahmane et al, 1999), and proliferation of granule cell precursors is regulated by Shh (Wallace, 1999; Wechsler-Reya and Scott, 1999), we postulated that ethanol would perturb the development of forebrain and hindbrain neurons via a molecular pathway involving Shh and Fgfs, as well as the HSPG agrin. This postulate is also based on our recent work showing that agrin loss-of-function in agrin morphant zebrafish displayed a variety of ocular defects, which could be rescued by Fgf8 (Liu et al., 2008), and that these same ocular defects were produced by ethanol exposure in zebrafish and were agrin- and Shh-dependent, thus providing the foundation for the studies described here.
As we had hypothesized, when we analyzed GABAergic neuron development in zebrafish forebrain, using expression of GAD1 mRNA as a marker of these neurons, we observed a marked reduction in GAD1 expression as a consequence of ethanol exposure. The diminution in GAD1 expression was most pronounced in 1 dpf and 3 dpf forebrain and hindbrain following a 6–24 hpf exposure, which correlates to the periods of gastrulation and neurulation in zebrafish. A similar reduction in GAD1 expression could be elicited with 6–10 hpf (gastrulation) or 10–18 hpf (neurulation) ethanol exposures, although only a small percentage of embryos (29%) were affected by the 6–10 hpf exposure and approximately 74% were affected by the 10–18 hpf exposure at 1 dpf. This contrasts with 100% of embryos exhibiting decreased GAD1 expression in 1 dpf forebrain and hindbrain following the 6–24 hpf exposure. Thus, it appears likely that processes occurring during both gastrulation and neurulation, but primarily neurulation, are regulating GABAergic neuron differentiation that is susceptible to ethanol exposure. Examination of possible molecular mechanisms that are being disrupted by ethanol exposure, using MO treatments combined with subthreshold ethanol exposure, as well as mRNA rescue, suggest that a molecular pathway involving agrin, Shh, and Fgfs is disrupted by ethanol exposure. Both agrin and Shh MO treatment recapitulates the ethanol phenotype of reduced GAD1 expression, as does subthreshold ethanol combined with agrin or Shh MO. Consistent with previous studies in mouse and zebrafish, demonstrating a dependence of forebrain GABAergic neuron development on Shh and Fgf signaling (Yung et al, 2002; Gulasci and Lillien, 2003; Miyake et al, 2005), we show that overexpression of Shh, Fgf8 or Fgf19 mRNA is capable of rescuing the reduced GAD1 expression phenotype that is produced by the combined ethanol and MO treatment paradigm. Thus, our studies lend support to the previous studies that described a role for Shh and Fgf function in the differentiation of GABAergic inhibitory interneurons. However, our studies are the first to demonstrate that ethanol exposure disrupts Shh and Fgf signaling in forebrain and hindbrain, resulting in perturbed differentiation of GABAergic neurons.
Studies in rodent have shown that both Purkinje cell and granule cell development is perturbed by ethanol exposure, with the timing of ethanol exposure determining the extent of Purkinje cell or granule cell loss (Hamre and West, 1993; Napper and West, 1995; Maier et al, 1999; Karacay et al, 2008). To assess if embryonic ethanol exposure in zebrafish likewise will exhibit a dependence on timing to affect Purkinje cell development, we exposed zebrafish embryos to ethanol from 6–24 hpf, 24–48 hpf or 48–72 hpf. GAD1 mRNA expression was then analyzed in 3 dpf embryos, a stage when cerebellar Purkinje cells are first beginning to differentiate (Bae et al, 2008), and 5 dpf embryos, a stage when the cerebellum is beginning to become a layered structure (Bae et al, 2009). In 3 dpf embryos we observed that all treatment windows produced a reduction in GAD1 expression (data not shown), but in 5 dpf embryos only the 24–48 hpf and 48–72 hpf treatments resulted in markedly reduced GAD1 gene expression, based on decreased intensity of in situ hybridization staining. However, the 6–24 hpf treatment produces a pronounced microcephaly that is still present in 5 dpf embryos. Thus, although the level of GAD1 expression following the 6–24 hpf treatment appears similar to expression levels in untreated embryos, if brain volume is considered it is likely that a reduction in GAD1-positive GABAergic neurons is present in 5 dpf brain following this ethanol exposure. Consistent with this suggestion, our analysis of 7 dpf zebrafish brain by hematoxylin and eosin staining shows a markedly smaller brain volume in embryos treated with ethanol from 6–24 hpf. A characteristic feature of prenatal ethanol exposure in mice is marked apoptosis throughout the brain, including the forebrain (Ikonomidou et al, 2000; Dunty et al, 2001; Aoto et al, 2008) and cerebellum (Olney et al, 2000; Dunty et al 2001; Olney et al 2002). In zebrafish a similar loss of neurons via apoptosis has been observed following exposure of zebrafish embryos to ethanol (Carvan et al, 2004). A reduced brain volume has been observed in humans with FASD, which may be a consequence of augmented apoptosis as a result of prenatal ethanol exposure (Clarren et al, 1978; Clarren, 1981; Pfeiffer et al, 1979; Mattson and Riley, 1996; Roebuck et al, 1998). Thus, it is tempting to speculate that a similar apoptosis is occurring in zebrafish brain as a result of ethanol exposure, leading to the observed microcephaly and reduced brain volume. This apoptosis may account, at least in part, for the reduced gene expression that is observed when analyzing markers of GABAergic and glutamatergic neurons. However, our studies also suggest that while GABAergic neuron differentiation is being affected by a 6–24 hpf ethanol exposure at early stages of zebrafish development, such as 1 dpf and 3 dpf, by 5 dpf GABAergic neurons are displaying a normal pattern of differentiation, based on GAD1 gene expression. It should be noted that in other zebrafish CNS regions, such as retina, neuronal differentiation that is disrupted by ethanol exposure at early stages of development will recover to normal levels of differentiation at later stages of development (Kashyap et al, 2007).
Interestingly, when we assessed the effect of ethanol on a second molecular marker of GABAergic neurons, the calcium-buffering protein parv7 (Bae et al, 2009), we observed unchanged levels of parv7 gene expression in 5 dpf zebrafish embryos with all ethanol treatment periods. However, we did observe augmented parv7 protein immunostaining in 5 dpf hindbrain for embryos exposed to ethanol from 6–24 hpf, but not from 1–2 or 2–3 dpf. Thus, the up-regulation of parv7 immunostaining correlated with ethanol-exposed embryos that had recovered wild-type expression levels of GAD1 mRNA. We also observed a similar phenomenon with Shh MO treatment, with 5 dpf Shh morphant embryos displaying normal GAD1 and parv7 mRNA levels and augmented parv7 immunostaining (data not shown). It has been suggested that up-regulation of parvalbumin protein might be a compensatory mechanism to protect against ethanol-induced elevation of intracellular calcium (Rabe and Weight, 1988; Mitchell et al, 2000). In rat hippocampus, parvalbumin expression is increased in response to morphine administration, which was suggested to be a manifestation of the stress response in these neurons (Guo et al, 2012). This raises the interesting possibility that recovery of late GAD1 gene expression in GABAergic neurons, as a result of early ethanol exposure, may be dependent on augmentation in parv7 protein levels in the presence of static levels of parv7 mRNA. Our observations also suggest an alteration in parv7 protein turnover as a consequence of ethanol exposure in zebrafish hindbrain. Overall, these data clearly show that ethanol exposure is affecting GABAergic neuron differentiation and likely GABAergic neuron function, since GAD1 mRNA and parv7 protein levels are being altered due to ethanol exposure.
Studies in rodents have shown that glutamatergic neuron differentiation is perturbed by ethanol exposure, and it has been postulated that the effects on granule cell development arise due to the disruption of Purkinje cell development (Bonthius and West, 1991; Hamre and West, 1993; Luo, 2010). When we analyzed granule cell development beginning at early stages of zebrafish CNS development, we observed a pronounced effect of ethanol exposure on expression of the atonal1a transcription factor in the rhombic lip, suggestive of ethanol exposure disrupting development of granule cell progenitors in the rhombic lip. Interestingly, this effect of ethanol exposure appears to cause a delay in atonal1a gene expression, since the expression pattern observed at 24 hpf in untreated embryos is observed in 48 hpf embryos as a consequence of ethanol exposure. When mature granule cell development was analyzed in 3 dpf and 7 dpf embryos, using markers of mature differentiated granule cells such as vglut1 and GABAARα6, we observed a marked reduction in the expression of these genes. Since we observed a decreased expression of the granule cell progenitor marker atonal1a at early ages, as well as a delay in its expression, it is possible that ethanol exposure during zebrafish CNS development is both decreasing the number of granule cell progenitors, as well as causing a delay in the differentiation of granule cells, as was observed with GABAergic Purkinje cells. It is also possible that migration of atonal1a-positive granule cell progenitors to the cerebellum is impaired by ethanol exposure, and studies in rodents show that ethanol exposure perturbs granule cell migration from the external granule cell layer (Gonzalez-Burgos and Alejandre-Gomez, 1995; Kumada et al, 2010; Luo, 2010). In preliminary studies we have analyzed BrdU incorporation by rhombic lip cells, and these data suggest that ethanol exposure may be decreasing cell proliferation in the rhombic lip (data not shown). Since previous studies in mouse have shown that granule cell proliferation is dependent on Shh signaling (Wallace, 1999; Wechsler-Reya and Scott, 1999), it is tempting to speculate that ethanol exposure in zebrafish is decreasing proliferation of granule cell progenitors in the rhombic lip, thereby accounting for the decrease in expression of markers of mature granule cells. Ethanol also decreases granule cell precursor proliferation in the external granule cell layer (Luo, 2010). Our demonstration that Shh mRNA overexpression can rescue the reduced atonal1a expression phenotype therefore supports a mechanism where Shh regulates granule cell progenitor proliferation.
Our studies also show that overexpression of Fgf8 or Fgf19 mRNAs can rescue some of the observed ethanol-mediated phenotypes, including GABAergic neuron development and atonal1a expression in granule cell progenitors. Fgf signaling is a possible target of ethanol exposure during CNS development, with Fgf8 expression diminished in telencephalon (Aoto et al, 2008), and Fgf2 treatment diminishing cerebellar granule cell death in vitro and in vivo (Luo et al, 1997; Bonthius et al, 2003). Since Fgf signaling modulates Shh signaling in the generation of GABAergic interneurons from the lateral and medial ganglionic eminences (Marin and Rubenstein, 2001; Yung et al, 2002), this raises the interesting possibility that impaired Fgf function in the cerebellum following ethanol exposure may lead to perturbed Shh signaling/function. At least based on our analysis GAD1 gene expression in presumptive GABAergic Purkinje cells in zebrafish hindbrain, as well as atonal1a expression in granule cell progenitors in the rhombic lip, it appears that Fgf and Shh signaling are part of a molecular signaling pathway that is also modulated by HSPGs such as agrin, and that is sensitive to ethanol exposure.
In summary, in the present studies we have provided evidence for a similarity in the effects of ethanol exposure on the development of GABAergic and glutamatergic neurons in zebrafish, when compared to previous studies in rodents. Our studies also demonstrate that the ethanol-mediated disruption of GABAergic neuron development, as well as that of granule cell precursors, is via a molecular signaling pathway involving Shh and Fgfs, which is likely modulated by HSPGs such as agrin. Our demonstration of the similarity between ethanol-induced defects in CNS development between zebrafish and rodents, combined with evidence for a role of Shh and Fgf signaling in ethanol-induced FASD, provides further support for the potential the zebrafish model system may provide in elucidating the molecular basis of FASD. As we have shown, combinations of ethanol exposure and gene knockdown using MOs can be readily conducted using zebrafish embryos, providing a window into the molecular mechanisms underlying FASD.
Acknowledgments
The authors thank Dr. Ju-Ahng Lee for helpful advice during the completion of these studies, Dr. Hao Chen for assistance in histochemical analysis of zebrafish embryos, and Shanta Mackinnon for zebrafish care and husbandry.
Grant information: This work was supported by NIH grant U54 AA019765.
References
- Ahlgren SC, Thakur V, Bronner-Fraser M. Sonic hedgehog rescues cranial neural crest from cell death induced by ethanol exposure. Proc Natl Acad Sci USA. 2002;99:10476–10481. doi: 10.1073/pnas.162356199. [DOI] [PMC free article] [PubMed] [Google Scholar]
- Alder J, Cho NK, Hatten ME. Embryonic precursor cells from the rhombic lip are specified to a cerebellar granule neurons identity. Neuron. 1996;17:389–399. doi: 10.1016/s0896-6273(00)80172-5. [DOI] [PubMed] [Google Scholar]
- Aoto K, Shikata Y, Higashiyama D, Shiota K, Motoyama J. Fetal ethanol exposure activates protein kinase A and impairs Shh expression in prechordal mesendoderm cells in the pathogenesis of holoprosencephaly. Birth Defects Res (Part A) 2008;82:224–231. doi: 10.1002/bdra.20447. [DOI] [PubMed] [Google Scholar]
- Arenzana FJ, Carvan MJ, 3rd, Aijon J, Sanchez-Gonzalez R, Arevalo R, Porteros A. Teratogenic effects of ethanol exposure on zebrafish visual system development. Neurotoxicol Teratol. 2006;28:342–348. doi: 10.1016/j.ntt.2006.02.001. [DOI] [PubMed] [Google Scholar]
- Bae Y-K, Kani S, Shimizu T, Tanabe K, Nojima H, Kimura Y, Higashijima S-I, Hibi M. Anatomy of zebrafish cerebellum and screen for mutations affecting its development. Dev Biol. 2009;330:406–426. doi: 10.1016/j.ydbio.2009.04.013. [DOI] [PubMed] [Google Scholar]
- Bauer-Moffet C, Altman J. The effect of ethanol chronically administered to preweaning rats on cerebellar development: a morphological study. Brain Res. 1977;119:249–268. doi: 10.1016/0006-8993(77)90310-9. [DOI] [PubMed] [Google Scholar]
- Ben-Arie N, Bellen HJ, Armstrong DL, McCall AE, Gordadze PR, Guo Q, Matsuk MM, Zoghbi HY. Math1 is essential for genesis of cerebellar granule neurons. Nature. 1997;390:169–172. doi: 10.1038/36579. [DOI] [PubMed] [Google Scholar]
- Bonthius DJ, Bonthius NE, Napper RM, Astley SJ, Clarren SK, West JR. Purkinje cell deficits in nonhuman primates following weekly exposure to ethanol during gestation. Teratology. 1996;53:230–236. doi: 10.1002/(SICI)1096-9926(199604)53:4<230::AID-TERA5>3.0.CO;2-6. [DOI] [PubMed] [Google Scholar]
- Bonthius DJ, Karacay B, Dai D, Pantazis NJ. FGF-2, NGF and IGF-1, but not BDNF, utilize a nitric oxide pathway to signal neurotrophic and neuroprotective effects against alcohol toxicity in cerebellar granule cell cultures. Brain Res Dev Brain Res. 2003;140:15–28. doi: 10.1016/s0165-3806(02)00549-7. [DOI] [PubMed] [Google Scholar]
- Bornemann DJ, Duncan JE, Staatz W, Selleck S, Warrior R. Abrogation of heparan sulfate synthesis in Drosophila disrupts the Wingless, Hedgehog and Decapentaplegic signaling pathways. Development. 2004;131:1927–1938. doi: 10.1242/dev.01061. [DOI] [PubMed] [Google Scholar]
- Carvan MJ, 3rd, Loucks E, Weber DN, Williams FE. Ethanol effects on the developing zebrafish: neurobehavior and skeletal morphogenesis. Neurotoxicol Teratol. 2004;26:757–768. doi: 10.1016/j.ntt.2004.06.016. [DOI] [PubMed] [Google Scholar]
- Chan T, Bowell R, O’Keefe M, Lanigan B. Ocular manifestations in fetal alcohol syndrome. Br J Ophthalmol. 1991;75:524–526. doi: 10.1136/bjo.75.9.524. [DOI] [PMC free article] [PubMed] [Google Scholar]
- Church MW, Kaltenbach JA. Hearing, speech, language and vestibular disorders in the fetal alcohol syndrome: a literature review. Alcohol Clin Exp Res. 1997;21:495–512. doi: 10.1111/j.1530-0277.1997.tb03796.x. [DOI] [PubMed] [Google Scholar]
- Clarren SK. Recognition of fetal alcohol syndrome. JAMA. 1981;245:2436–2439. [PubMed] [Google Scholar]
- Clarren SK, Alvord EC, Jr, Sumi SM, Streissguth AP, Smith DW. Brain malformations related to prenatal exposure to ethanol. J Pediatrics. 1978;92:64–67. doi: 10.1016/s0022-3476(78)80072-9. [DOI] [PubMed] [Google Scholar]
- Cragg BG, Phillips SC. Natural loss of Purkinje cells during development and increased loss with alcohol. Brain Res. 1985;325:151–160. doi: 10.1016/0006-8993(85)90311-7. [DOI] [PubMed] [Google Scholar]
- Dahmane N, Ruiz I, Altaba A. Sonic hedgehog regulates the growth and patterning of the cerebellum. Development. 1999;126:3089–3100. doi: 10.1242/dev.126.14.3089. [DOI] [PubMed] [Google Scholar]
- Dangata YY, Kaufman MH. Morphometric analysis of the postnatal mouse optic nerve following prenatal exposure to alcohol. J Anat. 1997;191:49–56. doi: 10.1046/j.1469-7580.1997.19110049.x. [DOI] [PMC free article] [PubMed] [Google Scholar]
- Dunty WC, Jr, Chen SY, Zucker RM, Dehart DB, Sulik KK. Selective vulnerability of embryonic cell populations to ethanol-induced apoptosis: implications for alcohol-related birth defects and neurodevelopmental disorder. Alcohol Clin Exp Res. 2001;25:1523–1535. [PubMed] [Google Scholar]
- Dunty WC, Jr, Zucker RM, Sulik KK. Hindbrain and cranial nerve dysmorphogenesis result from acute maternal ethanol administration. Dev Neurosci. 2002;24:328–342. doi: 10.1159/000066748. [DOI] [PubMed] [Google Scholar]
- Ferreira A. Abnormal synapse formation in agrin-depleted hippocampal neurons. J Cell Sci. 1999;112:4729–4738. doi: 10.1242/jcs.112.24.4729. [DOI] [PubMed] [Google Scholar]
- Godin EA, O’Leary-Moore SK, Khan AA, Parnell SE, Ament JJ, Dehart DB, Johnson BW, Allan Johnson G, Styner MA, Sulik KK. Magnetic resonance microscopy defines ethanol-induced brain abnormalities in prenatal mice: effects of acute insult on gestational day 7. Alcohol Clin Exp Res. 2010;34:98–111. doi: 10.1111/j.1530-0277.2009.01071.x. [DOI] [PMC free article] [PubMed] [Google Scholar]
- Goodlett CR, Marcussen BL, West JR. A single day of alcohol exposure during the brain growth spurt induces brain weight restriction and cerebellar Purkinje cell loss. Alcohol. 1990;7:107–114. doi: 10.1016/0741-8329(90)90070-s. [DOI] [PubMed] [Google Scholar]
- Goodlett CR, Eilers AT. Alcohol-induced Purkinje cell loss with a single binge exposure in neonatal rats: A stereological study of temporal windows of vulnerability. Alcohol Clin Exp Res. 1997;21:738–744. [PubMed] [Google Scholar]
- Gulasci A, Lillien L. Sonic hedgehog and bone morphogenetic protein regulate interneuron development from dorsal telencephalic progenitors in vitro. J Neurosci. 2003;23:9862–9872. doi: 10.1523/JNEUROSCI.23-30-09862.2003. [DOI] [PMC free article] [PubMed] [Google Scholar]
- Guo M, Bryant J, Sultana S, Jones O, Royal W., III Effects of vitamin A deficiency and opioids on parvalbumin + interneurons in the hippocampus of the HIV-1 transgenic rat. Curr HIV Res. 2012;10:463–468. doi: 10.2174/157016212802138715. [DOI] [PMC free article] [PubMed] [Google Scholar]
- Hamre KM, West JR. The effects of the timing of ethanol exposure during the brain growth spurt on the number of cerebellar Purkinje and granule cell nuclear profiles. Alcohol Clin Exp Res. 1993;17:610–622. doi: 10.1111/j.1530-0277.1993.tb00808.x. [DOI] [PubMed] [Google Scholar]
- Hering H, Kroger S. Synapse formation and agrin expression in stratospheroid cultures from embryonic chick retina. Dev Biol. 1999;214:412–28. doi: 10.1006/dbio.1999.9410. [DOI] [PubMed] [Google Scholar]
- Holzschuh J, Hauptmann G, Driever W. Genetic analysis of the roles of Hh, FGF8, and Nodal signaling during catecholaminergic system development in the zebrafish brain. J Neurosci. 2003;23:5507–5519. doi: 10.1523/JNEUROSCI.23-13-05507.2003. [DOI] [PMC free article] [PubMed] [Google Scholar]
- Ikonomidou C, Bittigau P, Ishimaru MJ, Wozniak DF, Koch C, Genz K, Price MT, Stefovska V, Horster F, Tenkova T, Dikranian K, Olney JW. Ethanol-induced apoptotic neurodegeneration and fetal alcohol syndrome. Science. 2000;287:1056–1060. doi: 10.1126/science.287.5455.1056. [DOI] [PubMed] [Google Scholar]
- Irving C, Mason I. Signaling by FGF8 from the isthmus patterns anterior hindbrain and establishes the anterior limit of Hox gene expression. Development. 2000;127:177–186. doi: 10.1242/dev.127.1.177. [DOI] [PubMed] [Google Scholar]
- Karacay LB, Li S, Bonthius DJ. Maturation-dependent alcohol resistance in the developing mouse: cerebellar neuronal loss and gene expression during alcohol-vulnerable and –resistant periods. Alcohol Clin Exp Res. 2008;32:1439–1450. doi: 10.1111/j.1530-0277.2008.00720.x. [DOI] [PubMed] [Google Scholar]
- Kashyap B, Frederickson LC, Stenkamp DL. Mechanisms for persistent microphthalmia following ethanol exposure during retinal neurogenesis in zebrafish embryos. Vis Neurosci. 2007;24:409–421. doi: 10.1017/S0952523807070423. [DOI] [PMC free article] [PubMed] [Google Scholar]
- Kashyap B, Frey RA, Stenkamp DL. Ethanol-induced microphthalmia is not mediated by change sin retinoic acid or sonic hedgehog signaling during retinal neurogenesis. Alcohol Clin Exp Res. 2011;35:1644–1661. doi: 10.1111/j.1530-0277.2011.01511.x. [DOI] [PMC free article] [PubMed] [Google Scholar]
- Kim MJ, Cotman SL, Halfter W, Cole GJ. The heparan sulfate proteoglycan agrin modulates neurite outgrowth mediated by FGF-2. J Neurobiol. 2003;55:261–277. doi: 10.1002/neu.10213. [DOI] [PubMed] [Google Scholar]
- Kim MJ, Liu IH, Song Y, Lee JA, Halfter W, Balice-Gordon RJ, Linney E, Cole GJ. Agrin is required for posterior development and axon pathway formation in embryonic zebrafish. Glycobiology. 2007;17:231–247. doi: 10.1093/glycob/cwl069. [DOI] [PubMed] [Google Scholar]
- Ksiazek I, Burkhardt C, Lin S, Seddik R, Maj M, Bezakova G, Jucker M, Arber S, Caroni P, Sanes JR, Bettler B, Ruegg MA. Synapse loss in cortex of agrin-deficient mice after genetic rescue of perinatal death. J Neurosci. 2007;27:7183–7195. doi: 10.1523/JNEUROSCI.1609-07.2007. [DOI] [PMC free article] [PubMed] [Google Scholar]
- Li YX, Yang HT, Zdanowicz M, Sicklick JK, Qi Y, Camp TJ, Diehl AM. Fetal alcohol exposure impairs Hedgehog cholesterol modification and signaling. Lab Invest. 2007;87:231–240. doi: 10.1038/labinvest.3700516. [DOI] [PubMed] [Google Scholar]
- Liu A, Losos K, Joyner AL. FGF8 can activate Gbx2 and transform regions of the rostral mouse brain into a hindbrain fate. Development. 1999;121:3267–3278. doi: 10.1242/dev.126.21.4827. [DOI] [PubMed] [Google Scholar]
- Liu IH, Zhang C, Kim MJ, Cole GJ. Retina development in zebrafish requires the heparan sulfate proteoglycan agrin. Dev Neurobiol. 2008;68:877–898. doi: 10.1002/dneu.20625. [DOI] [PubMed] [Google Scholar]
- Loucks EJ, Ahlgren SC. Deciphering the role of Shh signaling in axial defects produced by ethanol exposure. Birth Defects Res (Part A) 2009;85:556–567. doi: 10.1002/bdra.20564. [DOI] [PubMed] [Google Scholar]
- Luo GR, Chen Y, Li XP, Liu TX, Le WD. Nr4a2 is essential for the differentiation of dopaminergic neurons during zebrafish embryogenesis. Mol Cell Neurosci. 2008;39:202–210. doi: 10.1016/j.mcn.2008.06.010. [DOI] [PubMed] [Google Scholar]
- Luo J. Mechanisms of ethanol-induced death of cerebellar granule cells. Cerebellum. 2010;11:145–154. doi: 10.1007/s12311-010-0219-0. [DOI] [PMC free article] [PubMed] [Google Scholar]
- Luo J, West J, Pantazis N. Nerve growth factor and basic fibroblast growth factor protect rat cerebellar granule cells in culture against ethanol-induced cell death. Alcohol Clin Exp Res. 1997;21:1108–1120. [PubMed] [Google Scholar]
- Maier SE, Chen WJ, Miller JA, West JR. Fetal alcohol exposure and temporal vulnerability regional differences in alcohol-induced microencephaly as a function of the timing of binge-like alcohol exposure during rat brain development. Alcohol Clin Exp Res. 1997;21:1418–1428. doi: 10.1111/j.1530-0277.1997.tb04471.x. [DOI] [PubMed] [Google Scholar]
- Maier SE, Miller JA, Blackwell JM, West JR. Fetal alcohol exposure and temporal vulnerability: regional differences in cell loss as a function of the timing of binge-like alcohol exposure during brain development. Alcohol Clin Exp Res. 1999;23:726–734. doi: 10.1111/j.1530-0277.1999.tb04176.x. [DOI] [PubMed] [Google Scholar]
- Marin O, Rubenstein JLR. A long, remarkable journey: tangential migration in the telencephalon. Nat Neurosci Rev. 2001;2:780–790. doi: 10.1038/35097509. [DOI] [PubMed] [Google Scholar]
- Mattson SN, Riley EP. Brain anomalies in fetal alcohol syndrome. In: Abel EL, editor. Fetal Alcohol Syndrome: From Mechanism to Prevention. Boca Raton: CRC Press; 1996. pp. 50–68. [Google Scholar]
- Mitchell JJ, Paiva M, Heaton MB. Effect of neonatal ethanol exposure on parvalbumin-expressing GABAergic neurons of the rat medial septum and cingulate cortex. Alcohol. 2000;21:49–57. doi: 10.1016/s0741-8329(99)00101-9. [DOI] [PubMed] [Google Scholar]
- Miyake A, Nakayama Y, Konishi M, Itoh N. Fgf19 regulated by Hh signaling is required for zebrafish forebrain development. Dev Biol. 2005;288:259–275. doi: 10.1016/j.ydbio.2005.09.042. [DOI] [PubMed] [Google Scholar]
- Napper RM, West JR. Permanent neuronal cell loss in the cerebellum of rats exposed to continuous low blood alcohol levels during the brain growth spurt: a stereological investigation. J Comp Neurol. 1995;362:283–292. doi: 10.1002/cne.903620210. [DOI] [PubMed] [Google Scholar]
- Nitkin RM, Smith MA, Magill C, Fallon JR, Yao Y-MM, Wallace BG, McMahan UJ. Identification of agrin, a synaptic-organizing protein from Torpedo electric organ. J Cell Biol. 1987;105:2471–2478. doi: 10.1083/jcb.105.6.2471. [DOI] [PMC free article] [PubMed] [Google Scholar]
- Olney JW, Ishimaru MJ, Bittigau P, Ikonomidou C. Ethanol-induced apoptotic neurodegeneration in the developing brain. Apoptosis. 2000;5:515–521. doi: 10.1023/a:1009685428847. [DOI] [PubMed] [Google Scholar]
- Olney JW, Tenkova T, Dikranian K, Qin YQ, Labruyere J, Ikonomidou C. Ethanol-induced apoptotic neurodegeneration in the developing C57BL/6 mouse brain. Brain Res Dev Brain Res. 2002;133:115–126. doi: 10.1016/s0165-3806(02)00279-1. [DOI] [PubMed] [Google Scholar]
- Ornitz DM. FGFs, heparan sulfate and FGFRs: complex interactions essential for development. Bioassays. 2000;22:108–112. doi: 10.1002/(SICI)1521-1878(200002)22:2<108::AID-BIES2>3.0.CO;2-M. [DOI] [PubMed] [Google Scholar]
- Park Y, Rangel C, Reynolds MM, Caldwell MC, Johns M, Nayak M, Welsh CJ, McDermott S, Datta S. Drosophila perlecan modulates FGF and hedgehog signals to activate neural stem cell division. Dev Biol. 2003;253:247–257. doi: 10.1016/s0012-1606(02)00019-2. [DOI] [PubMed] [Google Scholar]
- Parnell SE, O’Leary-Moore SK, Godin EA, Dehart DB, Johnson BW, Allan Johnson G, Styner MA, Sulik KK. Magnetic resonance microscopy defines ethanol-induced brain abnormalities in prenatal mice: effects of acute insult on gestational day 8. Alcohol Clin Exp Res. 2009;33:1001–1011. doi: 10.1111/j.1530-0277.2009.00921.x. [DOI] [PMC free article] [PubMed] [Google Scholar]
- Pfeiffer J, Majewski F, Fischbach H, Bierich JR, Volk B. Alcohol embryo- and fetopathy. J Neurol Sci. 1979;41:125–137. doi: 10.1016/0022-510x(79)90033-9. [DOI] [PubMed] [Google Scholar]
- Rabe CS, Weight JF. Effects of ethanol on neurotransmitter release and intracellular free calcium in PC12 cells. J Pharmacol Exp Ther. 1988;244:417–422. [PubMed] [Google Scholar]
- Reimers MJ, Flockton AR, Tanguay RL. Ethanol- and acetaldehyde- mediated developmental toxicity in zebrafish. Neurotoxicol Teratol. 2004;26:769–781. doi: 10.1016/j.ntt.2004.06.012. [DOI] [PubMed] [Google Scholar]
- Roebuck TM, Mattson SN, Riley EP. A review of the neuroanatomical findings in children with fetal alcohol syndrome or prenatal exposure to alcohol. Alcohol Clin Exp Res. 1998;22:279–294. doi: 10.1111/j.1530-0277.1998.tb03658.x. [DOI] [PubMed] [Google Scholar]
- Rubert G, Minana R, Pascual M, Guerri C. Ethanol exposure during embryogenesis decreases the radial glial progenitor pool and affects the generation of neurons and astrocytes. J Neurosci Res. 2006;84:483–496. doi: 10.1002/jnr.20963. [DOI] [PubMed] [Google Scholar]
- Stromland K. Ocular abnormalities in the fetal alcohol syndrome. Acta Ophthamol Suppl. 1985;171:1–50. [PubMed] [Google Scholar]
- Stromland K, Pinazo-Duran MD. Optic nerve hypoplasia: comparative effects in children and rats exposed to alcohol during pregnancy. Teratology. 1994;50:100–111. doi: 10.1002/tera.1420500204. [DOI] [PubMed] [Google Scholar]
- Sulik KK, Johnston MC, Webb MA. Fetal alcohol syndrome: embryogenesis in a mouse model. Science. 1981;214:36–938. doi: 10.1126/science.6795717. [DOI] [PubMed] [Google Scholar]
- Sulik KK, Johnston MC. Embryonic origin of holoprosencephaly: interrelationship of the developing brain and face. Scan Electron Microsc. 1982;(Pt. 1):309–322. [PubMed] [Google Scholar]
- Sulik KK, Lauder JM, Dehart DB. Brain malformations in prenatal mice following acute maternal ethanol administration. Int J Dev Neurosci. 1984;2:203–214. doi: 10.1016/0736-5748(84)90014-5. [DOI] [PubMed] [Google Scholar]
- Takeo S, Akiyama T, Firkus C, Aigaki T, Nakato H. Expression of a secreted form of Dally, a Drosophila glypican, induces overgrowth phenotype by affecting action range of Hedgehog. Dev Biol. 2005;284:204–218. doi: 10.1016/j.ydbio.2005.05.014. [DOI] [PubMed] [Google Scholar]
- Tsen G, Halfter W, Kröger S, Cole GJ. Agrin is a heparan sulfate proteoglycan. J Biol Chem. 1995;270:3392–3399. doi: 10.1074/jbc.270.7.3392. [DOI] [PubMed] [Google Scholar]
- Van Maele-Fabry G, Gofflot F, Clotman F, Picard JJ. Alterations of mouse embryonic branchial nerves and ganglia induced by ethanol. Neurotoxicol Teratol. 1995;17:497–506. doi: 10.1016/0892-0362(95)00009-g. [DOI] [PubMed] [Google Scholar]
- Volkmann K, Rieger S, Babaryka A, Koster RW. The zebrafish cerebellar rhombic lip is spatially patterned in producing granule cell populations of different functional compartments. Dev Biol. 2008;313:167–180. doi: 10.1016/j.ydbio.2007.10.024. [DOI] [PubMed] [Google Scholar]
- Wallace VA. Purkinje-cell-derived sonic hedgehog regulates granule neuron precursor cell proliferation in the developing mouse cerebellum. Curr Biol. 1999;9:445–448. doi: 10.1016/s0960-9822(99)80195-x. [DOI] [PubMed] [Google Scholar]
- Wang VY, Rose MF, Zoghbi HY. Math1 expression redefines the rhombic lip derivatives and reveals novel lineages within the brainstem and cerebellum. Neuron. 2005;48:31–43. doi: 10.1016/j.neuron.2005.08.024. [DOI] [PubMed] [Google Scholar]
- Wechsler-Reya RJ, Scott MP. Control of neuronal precursor proliferation in the cerebellum by sonic hedgehog. Neuron. 1999;22:103–114. doi: 10.1016/s0896-6273(00)80682-0. [DOI] [PubMed] [Google Scholar]
- Wiellette EL, Sive H. Early requirement for fgf8 function during hindbrain pattern formation in zebrafish. Dev Dynam. 2004;229:393–399. doi: 10.1002/dvdy.10464. [DOI] [PubMed] [Google Scholar]
- Yung SY, Gokhan S, Jurcsak J, Molero AE, Abrajano JJ, Mehler MF. Differential modulation of BMP signaling promotes the elaboration of cerebral cortical GABAergic neurons or oligodendrocytes from a common sonic hedgehog-responsive ventral forebrain progenitor species. Proc Natl Acad Sci USA. 2002;99:16273–16278. doi: 10.1073/pnas.232586699. [DOI] [PMC free article] [PubMed] [Google Scholar]
- Zhang C, Turton QM, MacKinnon S, Sulik KK, Cole GJ. Agrin function associated with ocular development is a target of ethanol exposure in embryonic zebrafish. Birth Defects Res (Part A) 2011;91:129–141. doi: 10.1002/bdra.20766. [DOI] [PMC free article] [PubMed] [Google Scholar]