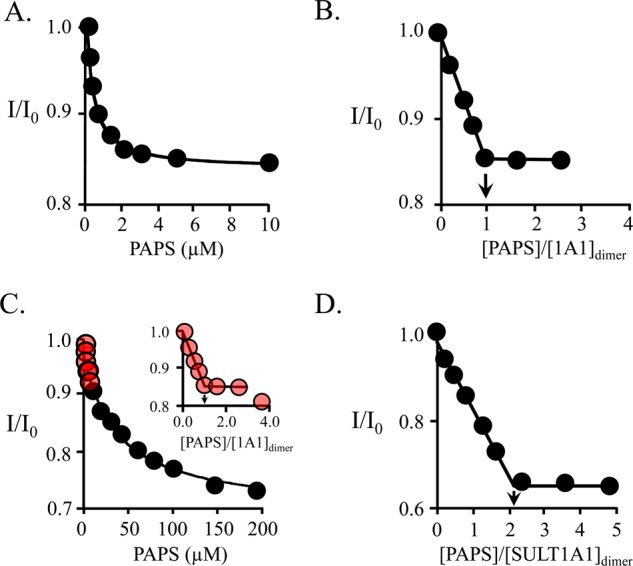
Figure 1.

Equilibrium binding of PAPS to SULT1A1. (A) PAPS binding to the high-affinity subunit. Binding was monitored via ligand-induced changes in the intrinsic fluorescence of SULT1A1 (λex = 295 nm; λem = 345 nm). Reaction conditions included SULT1A1 (0.05 μM, dimer), MgCl2 (5.0 mM), NaPO4 (50 mM), pH 7.2, and 25 ± 2 °C. Each point is the average of three independent determinations. The solid line through the data represents a least-squares fit using a model that assumes a single binding site per dimer. Kd = 0.37 ± 0.05 μM. (B) PAPS binding stoichiometry at the high-affinity site. The conditions were identical to those in described for panel A except that [SULT1A1] = 3.0 μM dimer (16Kd). The stoichiometry was 1.1 ± 0.2 PAPS molecules per dimer. (C) PAPS binding at the low-affinity site. Experimental conditions were identical to those in described for panel B. PAPS binding is biphasic. The high- and low-affinity phases are colored red (inset) and black, respectively. The line through the points represents a least-squares fit to the low-affinity phase using a model that assumes a single binding site per dimer. Kd = 30 ± 4 μM. (D) Full-site PAPS binding stoichiometry. The reaction conditions were identical to those described for panel A except that [SULT1A1] = 475 μM dimer (16Kd for the low-affinity site). The stoichiometry was 2.1 ± 0.2 PAPS molecules per dimer, or 1.1 ± 0.1 per subunit.
