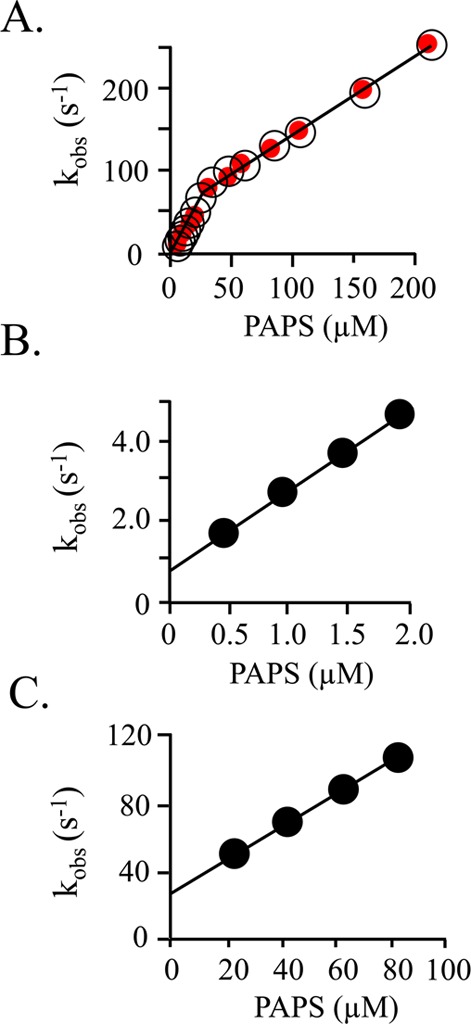
Figure 2.

Pre-steady-state binding of PAPS to SULT1A1. (A) Composite kobs vs [PAPS] plot. Two well-isolated binding phases are observed. Binding was monitored via changes in SULT1A1 intrinsic fluorescence (λex = 290 nm; λem ≥ 330 nm). kobs values are the average of three independent determinations. Reaction conditions included SULT1A1 (0.050 μM, dimer), MgCl2 (5.0 mM), NaPO4 (50 mM), pH 7.2, and 25 ± 2 °C. Red dots indicate the kobs values predicted using the kon and koff values obtained from the experiments associated with panels B and C. (B) kobs vs [PAPS] for the high-affinity subunit. Reaction conditions were identical to those described for panel A except that [SULT1A1] = 0.030 μM (dimer). kon = 2.0 ± 0.2 μM–1 s–1; koff = 0.70 ± 0.02 s–1. (C) kobs vs [PAPS] for the low-affinity subunit. Reaction conditions were identical to those described for panel A except the SULT1A1 (2.0 μM, dimer) was equilibrated with PAPS [8.0 μM, 26Kd(high affinity), 0.27Kd(low affinity)] before being mixed with PAPS at higher concentrations (20–80 μM). kon = 0.96 ± 0.01 μM s–1; koff = 29 ± 1 s–1. All reactions were pseudo-first-order in PAPS concentration.
