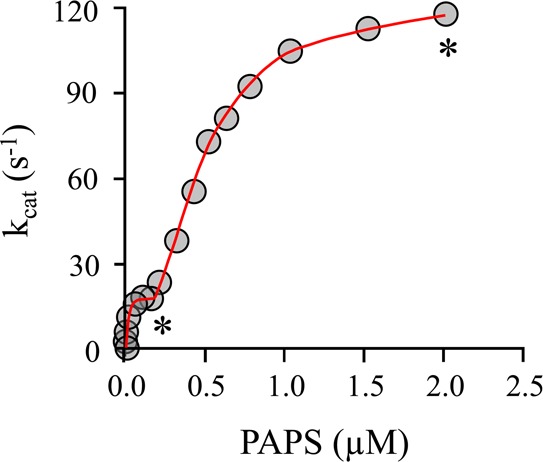
Figure 5.

SUTL1A1 turnover as a function of PAPS occupancy. A plot of SULT1A turnover vs [PAPS] is biphasic. The first and second phases correspond to saturation of the high- and low-affinity PAPS binding sites, respectively. The reaction was monitored via 1-HPS fluorescence (λex = 320 nm; λem = 380 nm). The conditions included SULT1A1 (1.0 nM, dimer), 1-HP (160 μM, 20Kd), MgCl2 (5.0 mM), NaPO4 (50 mM), pH 7.2, and 25 ± 2.0 °C. The asterisks indicate the PAPS concentrations (0.20 and 2.0 μM) used in initial rate studies to obtain Michaelis parameters for the E·PAP and E·(PAPS)2 forms.
