Abstract
Susceptibility tensor imaging (STI) provides a novel approach for noninvasive assessment of the white matter pathways of the brain. Using mouse brain ex vivo, we compared STI with diffusion tensor imaging (DTI), in terms of tensor values, principal tensor values, anisotropy values, and tensor orientations. Despite the completely different biophysical underpinnings, magnetic susceptibility tensors and diffusion tensors show many similarities in the tensor and principal tensor images, for example, the tensors perpendicular to the fiber direction have the highest gray-white matter contrast, and the largest principal tensor is along the fiber direction. Comparison to DTI fractional anisotropy, the susceptibility anisotropy provides much higher sensitivity to the chemical composition of the white matter, especially myelin. The high sensitivity can be further enhanced with the perfusion of ProHance, a gadolinium-based contrast agent. Regarding the tensor orientations, the direction of the largest principal susceptibility tensor agrees with that of diffusion tensors in major white matter fiber bundles. The STI fiber tractography can reconstruct the fiber pathways for the whole corpus callosum and for white matter fiber bundles that are in close contact but in different orientations. There are some differences between susceptibility and diffusion tensor orientations, which are likely due to the limitations in the current STI reconstruction. With the development of more accurate reconstruction methods, STI holds the promise for probing the white matter micro-architectures with more anatomical details and higher chemical sensitivity.
Keywords: Susceptibility tensor imaging, diffusion tensor imaging, fiber tractography, white matter, myelin
Introduction
Brain white matter contains a massive number of myelinated axons, with each axon surrounded by multi-layers of lipid membranes. These myelinated white matter fibers form a very complicated network that connects different gray matter regions and play important roles in relaying and coordinating information between them. Noninvasive assessment of the white matter fiber pathways and the tissue microstructures have long been a main topic of neuroscience. While the anisotropic water diffusion has been extensively used by diffusion tensor imaging (DTI) to extract useful information of fiber orientation and myelination, the anisotropic magnetic susceptibility, most likely originated from the highly aligned myelin lipids, was studied only recently. He and Yablonskiy were the first to report the dependence of gradient echo (GRE) signal phase on the white matter fiber orientations (1). Subsequent studies further revealed the dependence of magnetic susceptibility on the white matter fiber orientation (2,3). These orientation dependences give rise to the exciting possibility of probing the white matter fiber pathways using exclusively GRE signal phase. With the successful research in the past few years, susceptibility tensor imaging (STI) has emerged as an effective novel approach to extract useful information of white matter fiber orientation and myelination from gradient echo signal phase (2,4–6).
STI used a second order tensor to model the quantitative relationship between the anisotropic magnetic susceptibility of brain white matter and GRE signal phase (2). This tensor model allows easy inversion of GRE signal phase to derive the susceptibility tensors, and to further extract the fiber orientation. STI was first demonstrated in mouse brain ex vivo (4,7). The fiber directions by STI were shown to be consistent with that by DTI in several major fiber pathways (4). Clear magnetic susceptibility anisotropy was also observed in major white matter fiber bundles (4). Soon after, STI is demonstrated in human brain in vivo with the capability of fiber orientation mapping (6). This study further suggested that the radially aligned myelin lipids are the major source of MRI-observed susceptibility anisotropy. Theoretically, 6 head orientations are required for STI, however, in these early studies, more head orientations (n=11~19) were used to show the feasibility of STI with higher image quality. Significant progresses have also been achieved to make STI more efficient (5,8). For example, STI of human brain with fewer head orientations was realized by incorporating fiber orientation from DTI, which showed promise for mapping the susceptibility anisotropy (5). With the introduction of cylindrically symmetric susceptibility tensor (CSST), the number of head rotations can be further reduced (8).
While STI is rapidly advancing, the similarities and differences between STI and DTI are still not very clear. In addition, the accuracies of STI-derived fiber orientation and susceptibility anisotropy are still lower than those of DTI, despite that GRE signal phase can provide much higher spatial resolution than diffusion weighted images. The key factors that influence the accuracy of STI reconstruction remain to be identified. In this study, we compared STI with DTI using ex-vivo mouse brains. Our results revealed many similarities between STI and DTI. More importantly, the results show that the susceptibility anisotropy offers much higher sensitivity to the chemical composition of the white matter than DTI fractional anisotropy. We compared the susceptibility tensor and diffusion tensor orientations, using both a voxel-by-voxel approach and the fiber tractography. Finally, we evaluated and discussed the limitations in the current method that could introduce errors in susceptibility tensor reconstruction and tensor orientation quantification. Our results provide useful information for better understanding of the susceptibility anisotropy of the brain and for designing more accurate STI reconstruction methods for future preclinical and clinical applications.
Materials and Methods
Mouse Brain Imaging
Mouse brain imaging has been described previously (2,4). Briefly, three adult C57BL/6 (Jackson Laboratory, Bar Harbor, ME) brains were scanned using a 7T 21-cm-bore magnet. After anesthesia and the necessary surgical steps, a catheter was inserted into the left ventricle of the mouse heart to perfuse the animal with a mixture of 0.9% saline and ProHance (10:1, v:v) (Bracco Diagnostics, Princeton, NJ), and then with a mixture of 10% buffered formalin and ProHance (10:1, v:v) (9). The perfused mouse brain was surgically separated from the body, but kept within the cranium to prevent potential mechanical damage. The specimen was sealed tightly in a cylindrical tube, and was then placed inside a hollow sphere. The mouse brain was then scanned with a 3D spoiled-gradient-recalled-echo (SPGR) sequence with the following parameters: field of view (FOV) = 22×22×22 mm3, matrix = 256×256×256, flip angle = 60°, TE = 8.0 ms, TR = 70 ms. A total of 15~19 head orientations were sampled that roughly cover the spherical surface evenly.
Wild-type control mice (C3HeB/FeJ, n = 2) of 10-weeks old and age-matched dysmyelinating shiverer mice (C3FeSWV-Mbp-Shi, n = 2) were scanned at 9.4 T as described previously (6). Briefly, the mouse brains were perfused with formalin following the procedures described by Johnson et al. (9). The perfusion-fixed mouse brains were scanned on a 9.4 T (400 MHz) 89-mm-diameter vertical bore Oxford magnet with a GE EXCITE MR imaging console (GE Healthcare, Waukesha, WI). Due to the spatial constraints of this coil, the mouse brain can only be rotated around the anterior-posterior axis, i.e., the long axis. This is sufficient for assessing the susceptibility anisotropy, but not sufficient for determining the full susceptibility tensor. 3D spoiled-gradient-recalled (SPGR) images were acquired using the following parameters: FOV = 22×11×11 mm3, matrix = 256×128×128, flip angle = 40°, TE = 20 ms, and TR = 200 ms. The number of head orientations was 7 and 19 for the two control mice and 6 and 11 for the two shiverer mice.
To determine the fiber orientations, diffusion tensor images were acquired with a 3D spin-echo sequence with the same FOV and matrix size. One image volume was acquired without diffusion weighting and six diffusion encoding directions were used at a b-value of 1500 s/mm2. All experiments were approved by the Institutional Animal Care and Use Committee of Duke University.
Susceptibility Tensor Model and Image Reconstruction
GRE signal phase was unwrapped using Laplacian-based phase unwrapping and converted to frequency shift (10). The background frequency was removed with a modified SHARP method (10,11). Susceptibility tensors were reconstructed with a k-spaced-based approach with or without regularization (4,7). Briefly, in k-space, the normalized frequency shift, δ(k) = FT(Δϕ/TE/γ μ0H0), can be represented as a weighted summation of susceptibility tensors as (4):
| [1] |
where
| [2] |
Ĥ is the direction of the applied field, whose elements are Hi, k is the spatial frequency vector, whose elements are ki,, γ is the gyromagnetic ratio of water proton, H0 is the magnitude of the applied magnetic field, and χ is the second-order (or rank-2) susceptibility tensor. Susceptibility tensor can be estimated by solving the following linear equations in k-space:
| [3] |
where A is the coefficient matrix, whose elements are aij, and χ is a vector of χij. The susceptibility tensors were calculated with direct inversion of Eq.3. This is different from our previous ex-vivo mouse brain and in-vivo human brain studies (4,6) in that the no k-spaced-based regularization is used in the current study.
Susceptibility Tensor Decomposition and Fiber Tractography
The obtained susceptibility tensor was decomposed into three eigenvalues, i.e. χ1, χ2, χ3, in a descending order, and corresponding eigenvectors. The susceptibility anisotropy (Δχ) was calculated with the following definition:
| [4] |
In contrast, DTI fractional anisotropy (FA) is calculated using the following standard formulation:
| [5] |
Where λ1, λ2, λ3 are the eigenvalues of diffusion tensors, and λ̅ was the mean diffusivity.
The STI and DTI fiber tractography were performed using DTI Studio as described previously (4). Like DTI, STI fiber tracking also needs a scalar map to determine the starting and ending point of fiber tracking. The susceptibility index (SI) was used for this purpose as described in the previous study (4). Briefly, tracking a specific pathway is initiated from a given voxel (or region of interest) when SI is above the threshold (SI>0.35) and propagated through a continuous vector field defined by the major eigenvector that is corresponding to the most paramagnetic principal susceptibility. Tracking is terminated when the SI decreases below a minimum threshold (SI <0.35). Tracking is also terminated when the angle between two adjacent vectors is larger than a given tolerance (60°). This STI-based fiber tracking was performed with the DtiStudio (12) (Johns Hopkins University) by substituting the diffusion tensor with susceptibility tensor. 3D visualization was performed using Avizo (Visualization Science Group, Inc. Burlington, MA). As a comparison, DTI-based fiber tracking was also done following the same procedure, in which the threshold for staring the fiber tracking is FA>0.30, and the threshold for terminating the fiber tracking is FA <0.30.
Calculation of Susceptibility Anisotropy using Quantitative Susceptibility Maps
While Eq. 4 provide an approach to calculate susceptibility anisotropy using STI, it is not always possible to obtain the susceptibility tensors due to the spatial constraints. In this case, the following relationship can be used to calculate the susceptibility anisotropy of a selected white matter fiber bundle using the quantitative susceptibility maps (6):
| [6] |
Where χ is the quantitative susceptibility using single orientation methods, and α is the angle between a selected white matter segments with the main magnetic field direction, and χ0 is baseline susceptibility.
Numerical Simulations: the Influence of Phase Processing
One of the challenges in quantitative susceptibility mapping (QSM) and STI is that lack of accurate phase/susceptibility reference to determine the absolute magnetic susceptibility. This is due to the fact that the magnetic field outside the head is not measureable using GRE signal phase, while the magnetic field profiles near the air-head and tissue-bone boundaries is the most important information for calculating the absolute magnetic susceptibility. In the current methods, the phase outside the brain is set to zero, while the background phase is removed. To evaluate the effect of background phase removal on the susceptibility tensor reconstruction, we created a numerical phantom based on the anterior commissure segmented using diffusion tensor images. The susceptibility value outside the anterior commissure is set to zero, while the magnetic susceptibility of the anterior commissure is set to 0.1ppm (χP) along the fiber direction and −0.05ppm (χ⊥) perpendicular to the fiber direction. As such the mean magnetic susceptibility of the white matter remains zero.
The susceptibility tensors were simulated using the eigenvectors of DTI and the principal susceptibility values of [χP,χ⊥,χ⊥]. The phase values inside the entire field of view were calculated using Eq. 1 and 2. Then, the background phase is removed using the aforementioned modified SHARP method. The susceptibility tensors were recalculated from the resulting processed phase. The tensor orientation and the susceptibility values were further evaluated using the methods described in the previous susceptibility tensor decomposition and fiber tractography section.
Results
Comparison of Susceptibility and Diffusion Tensor Values
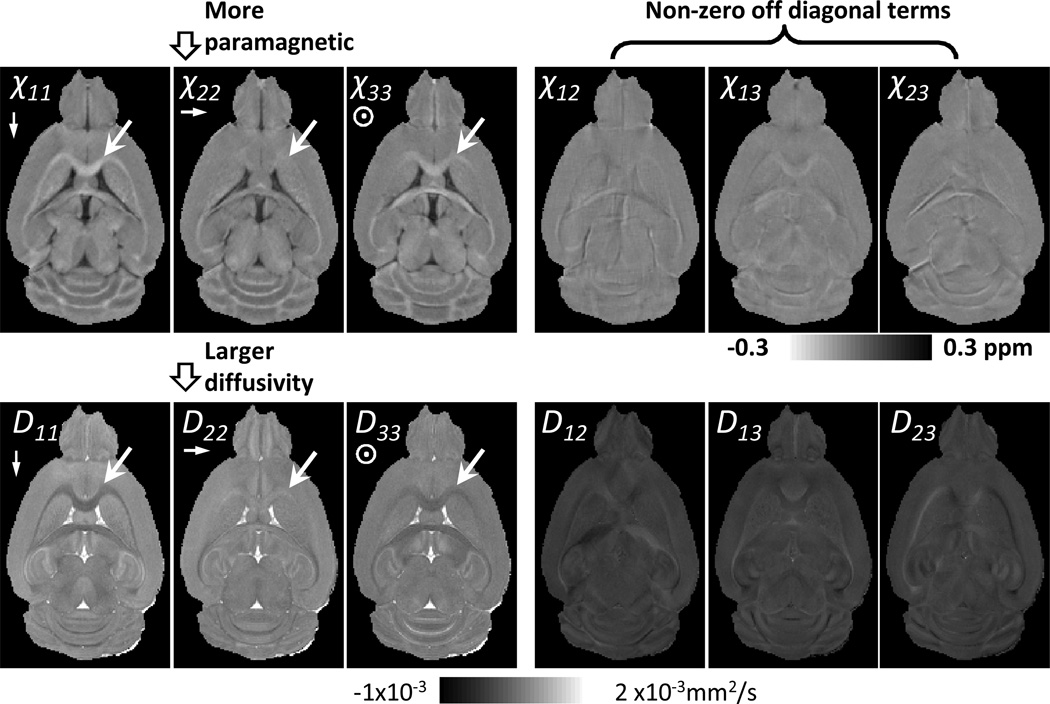
Fig. 1 compared the susceptibility and diffusion tensors. Visually, they shared many similarities. The white arrows pointed to a segment of corpus callosum, the fiber direction of which is approximately perpendicular to χ11 and χ33 (and D11 and D33), and parallel to χ22 (and D22). For this white matter segment, χ11 and χ33 is more diamagnetic than χ22, while D11 and D33 have less diffusivity than D22. In terms of gray-white matter contrast, χ22 or D22 has lower contrast than χ11 and χ33 or D11 and D33. For the off-diagonal tensors, χ12, χ13 and χ23 were all non-zero similar to that of diffusion tensors. On the other hand, there are also dramatic differences between quantitative values of susceptibility and diffusion tensors. Both GRE signal phase and magnetic susceptibility values are relative. Essentially, the susceptibility tensors χ11, χ22 and χ33 are referenced to the mean susceptibility of the brain tissue. As shown in Fig. 4, χ11, χ22 and χ33 are close to zero for gray matter, while they are negative for white matter, with the corresponding diamagnetic values dependent on the fiber orientation. In contrast, the diffusion tensors, i.e. D11, D22 and D33, are calculated using the non-diffusion weighted image as the reference, so the values of D11, D22 and D33 are always positive. Similar to χ12, χ13 and χ23, the off diagnostic terms of diffusion tensors, i.e. D12, D13 and D23, can be either positive or negative.
Fig. 1.
Representative images of susceptibility tensors and diffusion tensors. The arrow pointed to a segment of corpus callosum which is along the χ22 and D22 directions. Obvious similarities between STI and DTI can be seen in this region.
Fig. 4.
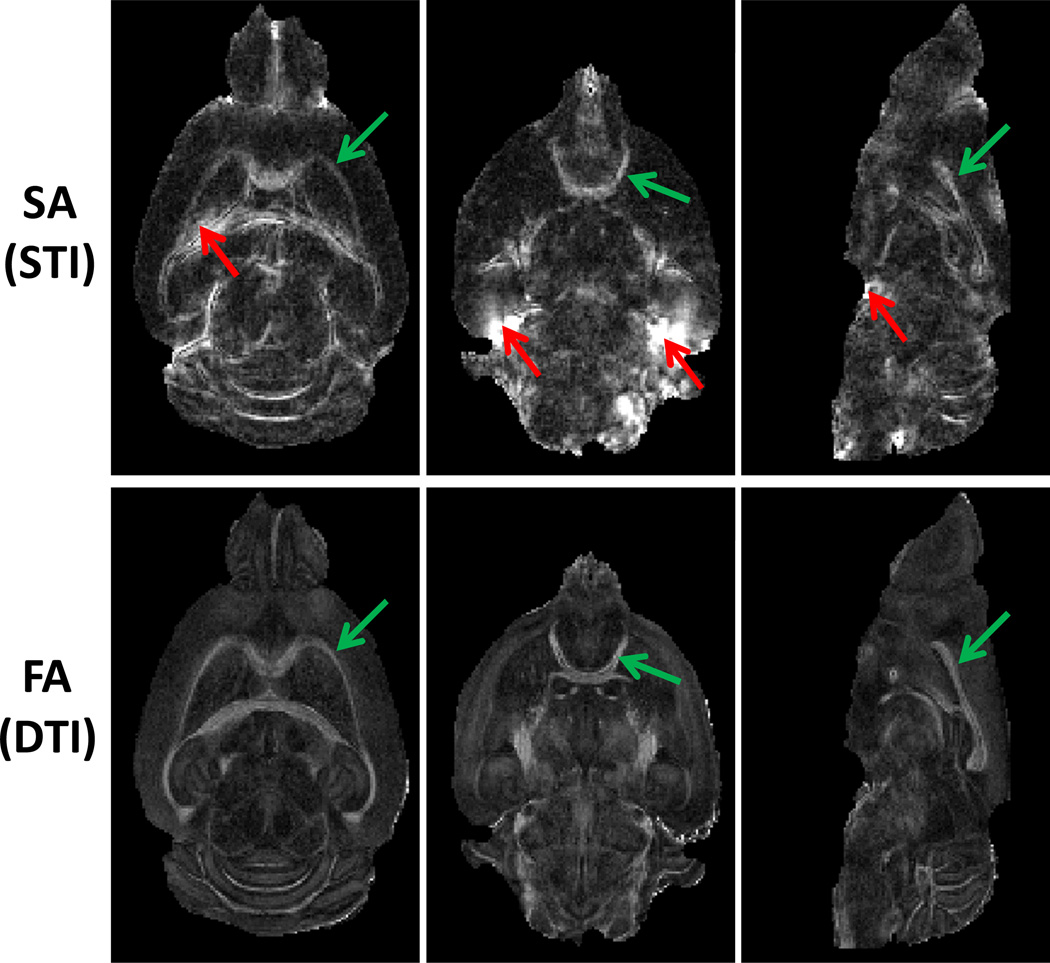
Representative images of susceptibility anisotropy and diffusion anisotropy. The green arrow pointed to regions with excellent quantification of both susceptibility and diffusion anisotropy. The red arrow pointed to regions with strong susceptibility anisotropy originated from the artifacts due to the strong susceptibility difference at the tissue interfaces.
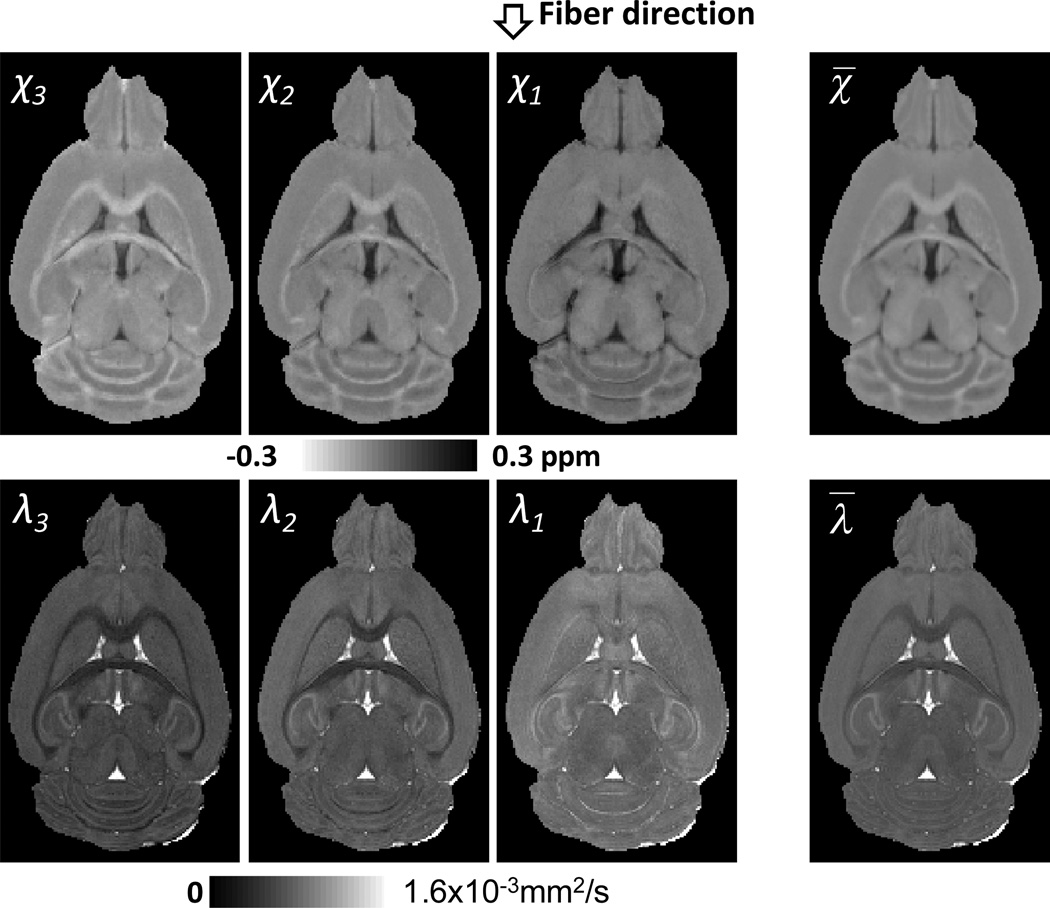
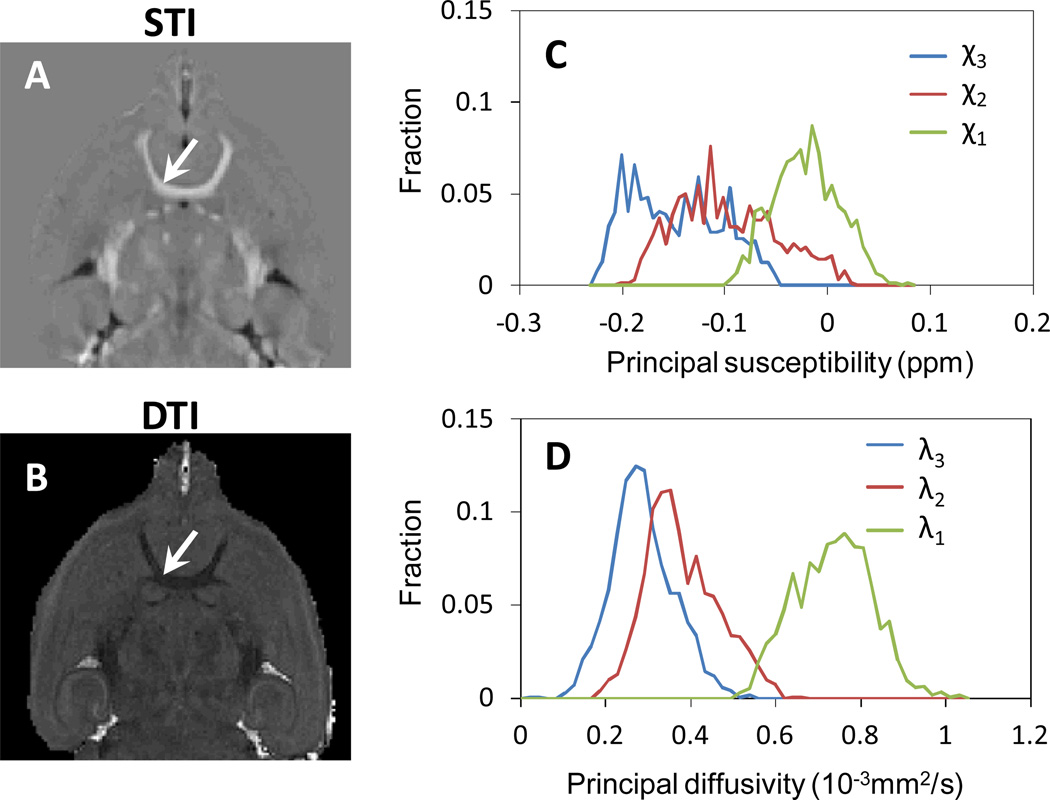
Fig. 2 compared the principal susceptibility with principal diffusivity. As from the fiber tractography results, the principal susceptibility χ1 is along the fiber direction, while the other χ2 and χ3 is perpendicular to the fiber direction. This is consistent with diffusion tensors that λ1 is along the fiber direction, while λ2 and λ3 are perpendicular to the fiber direction. Fig. 3 compared the principal susceptibilities and principal diffusivities in anterior commissure. The mean principal susceptibility values are −0.02ppm, −0.10ppm, and −0.15ppm for χ1, χ2 and χ3, respectively. The difference between χ2 and χ3 are 0.05 ppm, which is smaller than that between χ1 and χ2 (0.08ppm). Similarly, the λ1, λ2 and λ3 are 0.73 ×10⁻³mm2/s, 0.38×10⁻³mm2/s and 0.29×10⁻³mm2/s, with less similarity between λ1 and λ2 than between λ2 and λ3.
Fig. 2.
Representative images of the principal susceptibility and diffusion tensors and the mean magnetic susceptibility and the mean diffusivity.
Fig. 3.
Comparison of principal susceptibilities and diffusivities in anterior commissure. The arrows points to the anterior commissure. A: The histogram of principal susceptibility values. B: The histogram of principal diffusivity values. From the figure, χ2 is more similar to χ3 than χ1, which is consistent with the DTI results that λ2 is more similar to λ3 than λ1.
Comparison of Susceptibility and Diffusion Anisotropy Values
Fig. 4 shows the susceptibility anisotropy (SA) and the diffusion anisotropy (FA) maps. From the figure, the major white matter fiber bundles, including corpus callosum and anterior commissure (green arrows), showed clear susceptibility anisotropy and diffusion anisotropy. DTI FA values are highly consistent throughout the whole brain. In contrast, due to the nonlocal nature of GRE signal phase and the complicated STI reconstruction process, strong susceptibility artifacts at tissue interfaces was observed in the susceptibility anisotropy maps (red arrow).
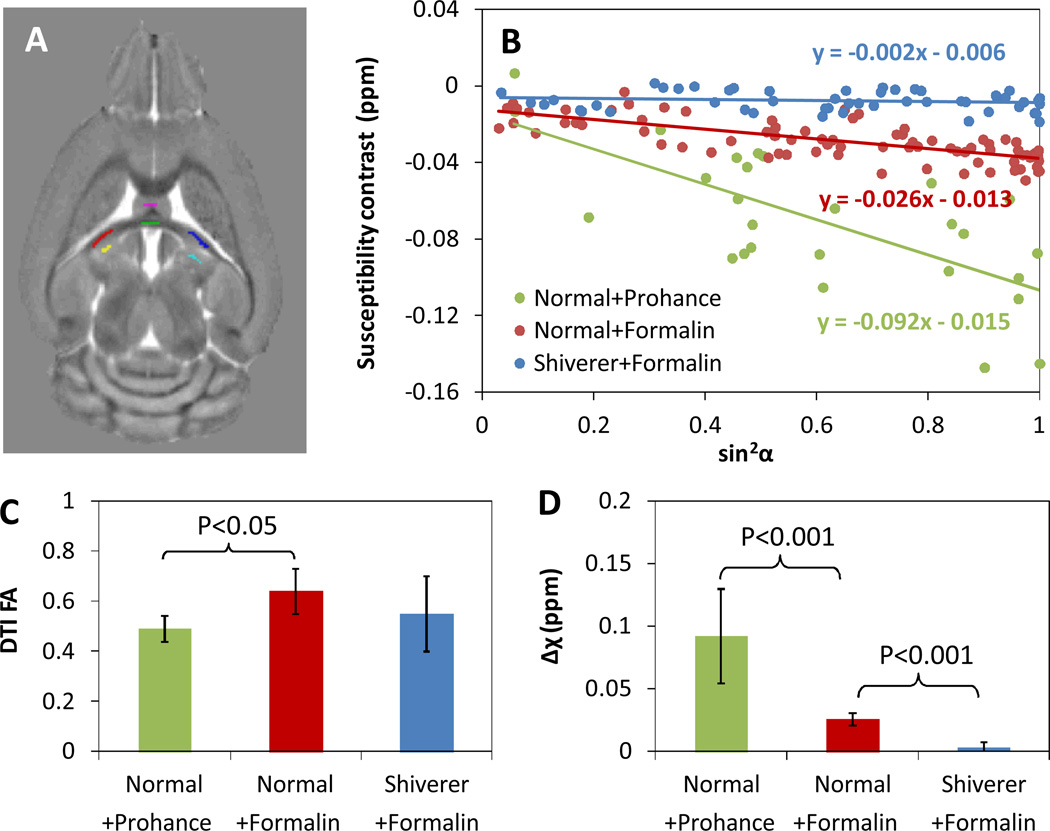
Fig. 5 compared the SA calculated using Eq. 6 with DTI FA in healthy brains perfused with Prohance, healthy brains perfused with formalin, and dysmyelinated shiverer brains perfused with formalin. Although there are differences in DTI FAs between the three different mouse brain specimens, the changes are within 25% of the largest FA values. In contrast, the loss of myelination in the shiverer mouse leads to more than 90% reduction of magnetic susceptibility anisotropy (P<0.001), while the perfusion with Prohance will increase the magnetic susceptibility by more than 3 folds (P<0.001).
Fig. 5.
Comparison between susceptibility anisotropy calculated using Eq. 6 and DTI FA. A: the anatomical labels of gray and white matters in hippocampal commissure used for the ROI-based analysis. B: Changes of white-gray matter susceptibility contrast with the sine square of the angle between the fiber and the main magnetic field. C: The DTI FA values of the three types of perfused brain specimens: normal (control) brain with ProHance, normal brain with formalin, and Shiverer brain with formalin. Our previous study has demonstrated that mouse brains perfused with formalin and saline yield the same phase and susceptibility contrasts (17). D: The susceptibility anisotropy values for the three type of perfused brain specimens.
Comparison of STI and DTI Tensor Orientations
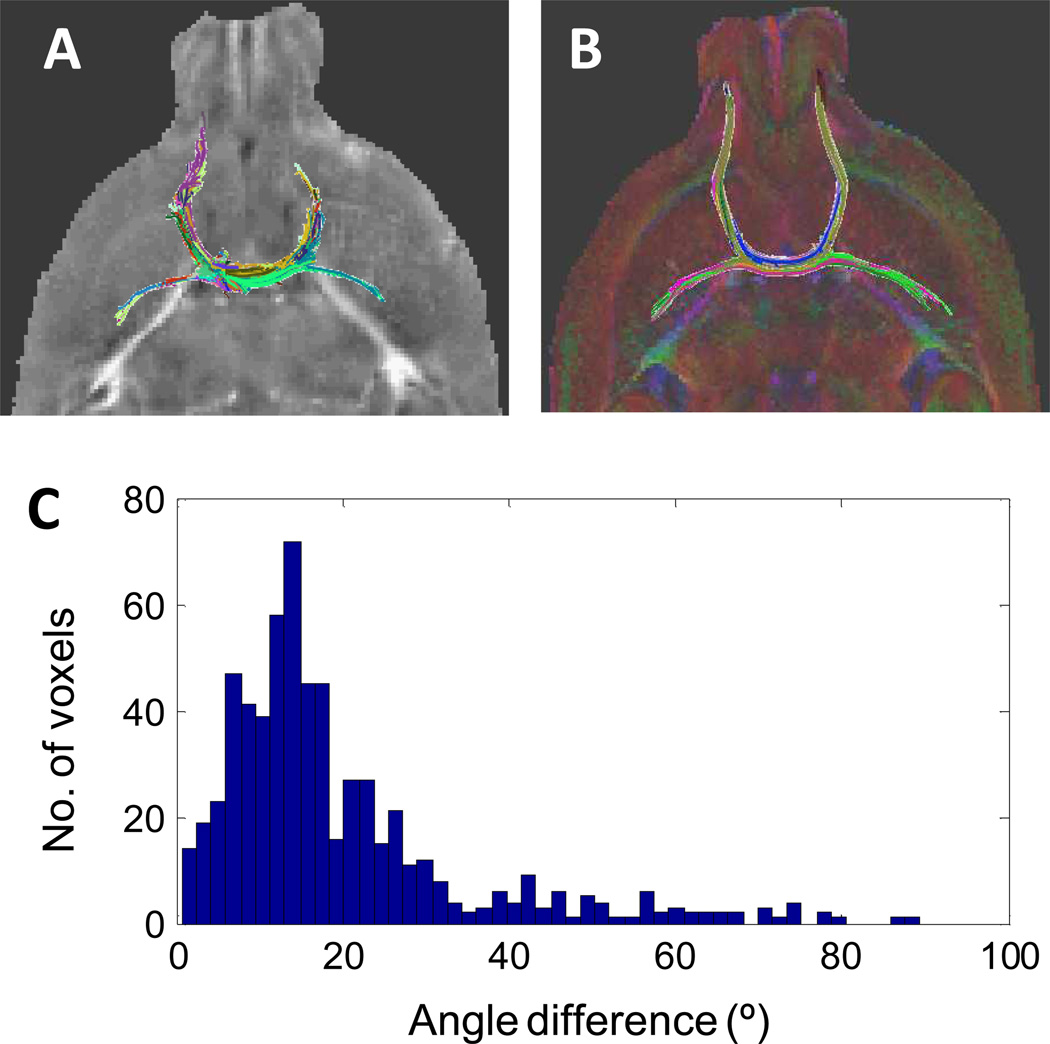
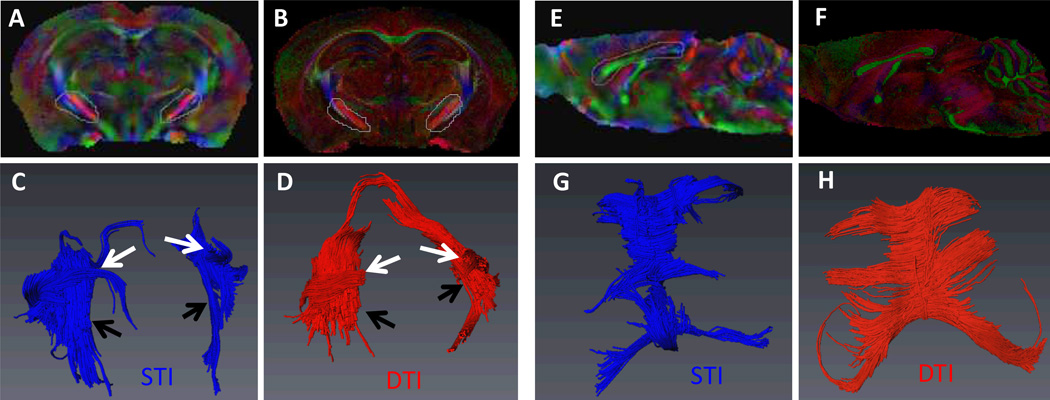
Fig. 6 A–B shows the fiber tractography of anterior commissure obtained by STI and DTI. The length of STI-determined fibers is also shorter than that by DTI. This could be due to the difference between the STI- and DTI-determined fiber orientations (Fig. 6C). In addition to anterior commissure, we further compared the STI fiber tractography of the whole corpus callusom with that of DTI (Fig. 7A–D). Similar fiber tracks were obtained with both STI and DTI. Furthermore, as shown in Fig. 6E–H, STI tractography can also resolve white matter fiber bundles that are in close contact but in different orientations. Overall, STI-based fiber tracking still shows less number of fibers, average length, and maximum length compare to that of DTI (Table 1).
Fig. 6.
Comparison of STI and DTI fiber tractography in anterior commissure. A–B: STI- and DTI determined fiber tracts. C: The differences in the fiber directions between DTI and STI in the anterior commissure.
Fig. 7.
Comparison between STI and DTI fiber tractography. A–D: The corpus callosum fiber pathways obtained by STI and DTI fiber tractography. E–H: The selected white matter fibers that are in close contact but in different orientations.
Table 1.
Comparison of STI and DTI fiber tracking statistics
| Method | Mouse | Number of fibers |
Average length (mm) |
Maximum length (mm) |
|
|---|---|---|---|---|---|
| Anterior commissure | STI | No. 1 No. 2 |
640 576 |
2.5 2.3 |
7.8 6.0 |
| DTI | No. 1 No. 2 |
512 257 |
3.6 4.7 |
9.1 10.1 |
|
| Hippocampal commissure | STI | No. 1 No. 2 |
1358 1722 |
1.5 1.8 |
3.0 4.3 |
| DTI | No. 1 No. 2 |
1888 1906 |
2.9 3.3 |
5.7 6.8 |
|
| Corpus Callosum | STI | No. 1 No. 2 |
2562 2356 |
2.6 1.9 |
10.1 6.4 |
| DTI | No. 1 No. 2 |
3158 2243 |
4.2 3.7 |
18.8 11.1 |
|
| Internal Capsule | STI | No. 1 No. 2 |
3239 2173 |
3.1 2.1 |
10.4 7.2 |
| DTI | No. 1 No. 2 |
3827 3115 |
3.2 2.6 |
11.8 7.9 |
|
Phase Processing on the Accuracy of STI Reconstruction
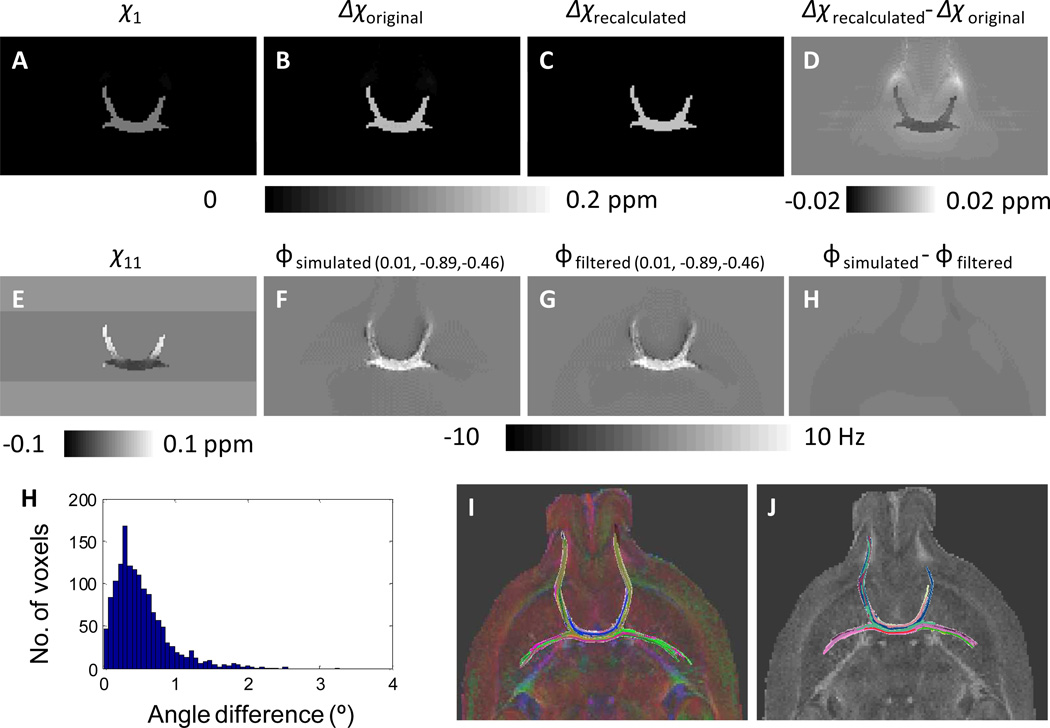
Fig. 8 illustrated the influence of phase processing on susceptibility tensor reconstruction. The background frequency removal procedure will set the frequency outside the brain tissue to be zero, that will lead to a low frequency difference between the original simulated frequency map and the background removed frequency map (Fig. 8H). As a result, the recalculated susceptibility anisotropy using Eq. 4 is significantly underestimated in the entire white matter regions, and the difference is 5±4% of the original susceptibility anisotropy value (Fig. 8D). In contrast, the susceptibility anisotropy becomes nonzero in the adjacent gray matter regions (Fig. 8D). In addition to the alterations in susceptibility anisotropy values, a derivation of the tensor orientation is also observed (Fig. 8I). As a result, the length of the fiber obtained from the recalculated susceptibility tensors using the background removed frequency map is significantly shorter than the original fiber length (Fig.8J and K).
Fig. 8.
Numerical simulation of the effect of phase processing on the accuracy of STI reconstruction. A–H: the principal susceptibility (A), susceptibility anisotropy (B), susceptibility tensor (E), frequency shift (F), the background removed frequency shift (G), the difference between the background removed frequency shift and the original frequency shift (H), the recalculated susceptibility anisotropy (C), and the difference between the recalculated susceptibility anisotropy and the original susceptibility anisotropy (D). (0.01, −0.89,−0.46) indicated the field direction used in the simulation of frequency shifts. I: the difference between the simulated fiber directions and original fiber directions. J: the original DTI fiber tracts. K: the fiber tracts using the susceptibility tensors reconstructed from the background removed frequency shifts.
Discussion
In this study, we achieved high quality STI of ex-vivo mouse brains. We compared the susceptibility tensors and diffusion tensors in terms of tensors values, principal tensor values, the anisotropy values, the tensor orientations. Despite the many visual similarities in the tensor values and principal tensor values, susceptibility tensor offers much higher sensitivity to myelin and ProHance distribution (Fig. 5). Differences in the tensor orientation were observed between DTI and STI, which can cause shorter fiber tracts by STI comparing to that by DTI. Using simulation, we showed that some errors in susceptibility anisotropy and tensor orientation can be partly explained by the limitations in the susceptibility tensors reconstruction, such as the background phase/frequency removal. Although the current image quality of STI is still not as good as that of DTI, the chemical sensitivity of STI and the successful tracking of the major white matter fiber pathways demonstrate the potential of STI for the study of brain white matter.
It is encouraging that STI can track complex white matter fiber bundles that are in close contact but in different orientations (Fig. 7A–D). The fiber tracking in corpus callosum by STI is also quite similar to that of DTI (Fig. 7E–H). Further, in the anterior commissure, a major fiber bundle with very simple structures, the angle difference between DTI and STI falls mostly in the range of smaller angles (Fig. 6C). These agreements in the major white matter fiber pathways clearly demonstrate that the direction of χ1 is along the fiber direction. Furthermore, more similarities are observed between χ2 and χ3 than that between χ1 and χ2 (Fig. 3). These findings provide strong evidence that susceptibility anisotropy is originated from white matter microstructures with radial symmetry. Previously, it have been shown that susceptibility tensor orientation is always aligned with fiber direction even if the involved molecules do not aligned with membrane surface norm on the microscopic level (6). These results provide a strong experimental evidence to support the definition of susceptibility anisotropy in Eq. 4. In addition, they are also in agreement with the use of cylindrically symmetric susceptibility tensor (CSST) for efficient susceptibility tensor reconstruction (8).
It is now increasingly accepted that the radially aligned myelin lipids is the major source of the MRI-determined macroscopic susceptibility anisotropy (6,8). It has been long known that many biomolecules shows anisotropic magnetic properties at the molecular level (13–15). Particularly, a classical NMR study reported a size-dependent frequency shift of the membrane lipids of lipoprotein particles (16). According to the theory, this shift can only be explained with anisotropic magnetic susceptibility of the membrane lipids, with a value of −0.22 ppm (16). Li et al showed that this susceptibility anisotropy value of myelin lipids can account very well for the magnetic susceptibility variations with different fiber orientations in both mouse brain and human brain in vivo (6). This interpretation is further supported by the loss of phase and susceptibility contrast, as well as susceptibility anisotropy in the dysmyelinating shiverer mouse (6,17), and by recent susceptibility anisotropy measurements of human brain in vivo (5,8).
Another independent line of evidence supporting the major role of myelin lipids comes from the multi-compartment properties of GRE signals in white matter. Brain white matter contains complex microstructures with multiple compartments with varying properties. The micro-compartments of white matter, including the myelin water, axonal water and interstitial water, have been studied in quite many previous studies using magnitude decay (18–20). Recently, it is found that different white matter micro-compartments have different frequency shifts (21). This frequency difference among micro-compartments give rise to the nonlinear evolution of gradient echo signal phase, since the MR signal of different compartments are decaying at different rates (21,22). Wharton and Bowtell have developed an elegant hollow cylinder model to demonstrate that the evolution of GRE magnitude and phase can be explained by the myelin lipids with anisotropic magnetic susceptibility (23). A similar but more comprehensive biophysical model was also developed by Sukstanskii and Yablonskiy with similar conclusions (24). Very recently, Sati et al investigated the evolution of signal phase and magnitude as a function of TE at ultra-high magnetic field and reported that the magnetic susceptibility values of myelin lipids are −0.06 ppm and −0.28 ppm for fields tangential and radial to the myelin sheath (25), which is consistent with our previous study (6), but this susceptibility anisotropy value (−0.22 ppm) is slightly higher than −0.12 ppm reported by Wharton and Bowtell (23).
As shown in Fig. 5, the susceptibility anisotropy offers much higher sensitivity to the chemical composition of the white matter than the DTI FA, including both the myelin and the gadolinium contrast agent, the ProHance. The biophysical underpinnings of reduced contrast in shiverer mouse was attributed to myelin (17). According to Li et al (6), the susceptibility anisotropy is linearly related to the myelin content. It is possible that in shiverer mouse, the myelin content is significantly reduced (by ~90% according to the susceptibility anisotropy measurement). However, the residual myelin is still sufficient to constrain the radial diffusivity, thus leading to a slighter decrease in DTI FA. The mechanisms of the increased susceptibility anisotropy with ProHance perfusion remains unknown and is outside the scope of this study. The dramatic different sensitivity of SA and DTI FA to white matter chemical composition reminds us that that they reflect completely different aspects of white matter microstructures. While diffusion anisotropy is related to anisotropic water diffusion, susceptibility anisotropy is related to the anisotropic magnetic properties of the highly aligned myelin lipids (6) and probably also the aligned gadolinium contrast agent. The large dynamic range of susceptibility anisotropy makes it a promising candidate for assessing the white matter abnormalities in various neurological disorders, such as multiple sclerosis, Alzheimer’s diseases and etc.
Despite the promise of STI with its unique chemical sensitivity and the potential for high resolution tensor imaging, the accuracy of susceptibility anisotropy and tensor orientation calculation using the current methods is still not as good as that of DTI (Fig. 6, Fig. 7 and Table 1). There are multiple reasons for this. As shown in Fig. 8, the phase processing plays an important role in determining the accuracy of both the susceptibility anisotropy and tensor orientation. It is typically assumed that gray matter has isotropic magnetic susceptibility, since the cell bodies, dendrites, axons, glial cells inside the gray matter orient to a variety of directions. In contrast, the white matter tissue has highly anisotropic microscopic structures, including the highly aligned myelin sheath, cytoskeletons and etc, which can give rise to the macroscopic magnetic susceptibility anisotropy. Since the frequency distribution outside the brain is not measureable and the background phase/frequency is removed, both frequency and susceptibility values are relative, with the center of k-space not well defined. Fortunately, for mouse brain, the majority of brain tissue is gray matter. The SHARP-based background phase removal procedure automatically set the frequency/susceptibility reference to the mean tissue frequency/susceptibility, which is very close to that of gray matter due to the high volume fraction of gray matter. The impact of background phase removal on fiber orientation determination is shown to be small in mouse brain (Fig. 8I). This close to optimal reference for susceptibility tensor allowed the successful tracking of the white matter fiber pathways in mouse brains.
In contrast to the mouse brain, human brain has similar gray and white matter volume fractions (26). As a result, the same susceptibility tensor quantification will likely violate the assumption that the magnetic susceptibility of gray matter is isotropic, and render the resulting susceptibility tensor deviate from true tensor orientations. This bias, in theory, can be minimized by incorporating spatial constraints to force an isotropic susceptibility in gray matter. Such a solution is expected to help improve accuracy of STI fiber tractography significantly. However, its implication will require solving all the equations in the spatial domain. This can increase the computation by a few orders of magnitude, but it is still not very difficult with the power of the current computers. In addition, it should be also noted that the isotropic magnetic susceptibility of gray matter is still an assumption. Although likely to be true, it still needs rigorous experimental examinations.
Another critical factor that determines the quality of STI is image registration. Unlike magnitude, GRE signal phase usually shows sharp and discontinuous changes at tissue interfaces. The amount of phase difference between tissue types is quantitatively related to the susceptibility difference between the two tissues, and the geometry of the tissues. While this phase difference has been successfully utilized in susceptibility weighted imaging (SWI) to enhance the visibility of venous vasculatures and other tissue with significant different susceptibility from surrounding tissues (27,28), the imperfect alignment of the strong phase changes at tissue interfaces can lead to severe artifacts through inversion during the process of susceptibility tensor quantification. This is the main reason for us to develop the k-space-based regularized approach for STI reconstruction (4,6). This current study showed that if the images are well aligned, high quality STI can be achieved without regularization. With increasing application of multi-gradient-echo sequences for MR susceptibility imaging (29), the quality of STI could be further improved with optimal nonlinear registration using the first echo, which has excellent gray-white matter contrast (30).
One of the most difficult challenges for the application of STI is the requirement of rotating the brain inside the MR scanner. Recently, Liu and Li have shown that the higher-order frequency variations based on a single image acquisition without rotating the object could provide sufficient information to probe the white matter architecture (31). This method used the Fourier spectral space, namely p-space, to successfully map the white matter fiber pathway of mouse brain ex vivo. The same p-space method can also be applied to human brain in vivo (31). With increasing availability of ultra-high field MRI systems, more accurate and in-depth understanding of GRE phase contrast and the rapid developments of numerical inversion methods, the GRE signal phase will become more and more useful for the characterization of the myeloarchitecture of the brain, using the current STI or the next generation p-space STI technology.
Conclusion
We compared STI with DTI, in terms of tensors values, principal tensors values, the anisotropy values and the tensor orientations. Comparing to DTI FA, magnetic susceptibility anisotropy shows much higher sensitivity to the chemical composition of the white matter, especially myelin. This high sensitivity can be further enhanced with ProHance perfusion. The orientation of the susceptibility tensors agrees with that of diffusion tensors in major white matter fiber bundles. The lower SNR of the susceptibility anisotropy and the deviation of the susceptibility tensor direction from the diffusion tensor direction can be largely attributed to the limitations in STI reconstruction. With more accurate reconstruction methods, STI holds the promise of providing the high resolution tensor imaging with unique chemical sensitivity.
Acknowledgement
The study was supported in part by the National Institutes of Health (NIH) through grant R01 MH096979 to C. L and NIBIB P41 EB015897 to Duke Center for In Vivo Microscopy.
References
- 1.He X, Yablonskiy DA. Biophysical mechanisms of phase contrast in gradient echo MRI. P Natl Acad Sci USA. 2009;106(32):13558–13563. doi: 10.1073/pnas.0904899106. [DOI] [PMC free article] [PubMed] [Google Scholar]
- 2.Liu C. Susceptibility tensor imaging. Magn Reson Med. 2010;63(6):1471–1477. doi: 10.1002/mrm.22482. [DOI] [PMC free article] [PubMed] [Google Scholar]
- 3.Lee J, Shmueli K, Fukunaga M, van Gelderen P, Merkle H, Silva AC, Duyn JH. Sensitivity of MRI resonance frequency to the orientation of brain tissue microstructure. P Natl Acad Sci USA. 2010;107(11):5130–5135. doi: 10.1073/pnas.0910222107. [DOI] [PMC free article] [PubMed] [Google Scholar]
- 4.Liu C, Li W, Wu B, Jiang Y, Johnson GA. 3D Fiber tractography with susceptibility tensor imaging. Neuroimage. 2012;59(2):1290–1298. doi: 10.1016/j.neuroimage.2011.07.096. [DOI] [PMC free article] [PubMed] [Google Scholar]
- 5.Li X, Vikram DS, Lim IAL, Jones CK, Farrell JAD, van Zijl PCM. Mapping magnetic susceptibility anisotropies of white matter in vivo in the human brain at 7T. NeuroImage. 2012;62(1):314–330. doi: 10.1016/j.neuroimage.2012.04.042. [DOI] [PMC free article] [PubMed] [Google Scholar]
- 6.Li W, Wu B, Avram AV, Liu C. Magnetic susceptibility anisotropy of human brain in vivo and its molecular underpinnings. Neuroimage. 2012;59(3):2088–2097. doi: 10.1016/j.neuroimage.2011.10.038. [DOI] [PMC free article] [PubMed] [Google Scholar]
- 7.Li W, Wu B, Liu C. A regularized k-space-based method for susceptibility tensor imaging. Proc Int Soc Magn Reson Med. 2012;20 [Google Scholar]
- 8.Wisnieff C, Liu T, Spincemaille P, Wang S, Zhou D, Wang Y. Magnetic susceptibility anisotropy: Cylindrical symmetry from macroscopically ordered anisotropic molecules and accuracy of MRI measurements using few orientations. NeuroImage. 2013;70(0):363–376. doi: 10.1016/j.neuroimage.2012.12.050. [DOI] [PMC free article] [PubMed] [Google Scholar]
- 9.Johnson GA, Cofer GP, Gewalt SL, Hedlund LW. Morphologic phenotyping with MR microscopy: The visible mouse. Radiology. 2002;222(3):789–793. doi: 10.1148/radiol.2223010531. [DOI] [PubMed] [Google Scholar]
- 10.Li W, Wu B, Liu C. Quantitative susceptibility mapping of human brain reflects spatial variation in tissue composition. Neuroimage. 2011;55:1645–1656. doi: 10.1016/j.neuroimage.2010.11.088. [DOI] [PMC free article] [PubMed] [Google Scholar]
- 11.Schweser F, Deistung A, Lehr BW, Reichenbach JR. Quantitative imaging of intrinsic magnetic tissue properties using MRI signal phase: An approach to in vivo brain iron metabolism? Neuroimage. 2011;54(4):2789–2807. doi: 10.1016/j.neuroimage.2010.10.070. [DOI] [PubMed] [Google Scholar]
- 12.Jiang H, van Zijl PCM, Kim J, Pearlson GD, Mori S. DtiStudio: Resource program for diffusion tensor computation and fiber bundle tracking. Computer Methods and Programs in Biomedicine. 2006;81(2):106–116. doi: 10.1016/j.cmpb.2005.08.004. [DOI] [PubMed] [Google Scholar]
- 13.Van Zijl PCM, Ruessink BH, Bulthuis J, MacLean C. NMR of partially aligned liquids: magnetic susceptibility anisotropies and dielectric properties. Accounts of Chemical Research. 1984;17(5):172–180. [Google Scholar]
- 14.Banci L, Bertini I, Huber JG, Luchinat C, Rosato A. Partial Orientation of Oxidized and Reduced Cytochrome b5 at High Magnetic Fields: Magnetic Susceptibility Anisotropy Contributions and Consequences for Protein Solution Structure Determination. Journal of the American Chemical Society. 1998;120(49):12903–12909. [Google Scholar]
- 15.Tolman JR, Flanagan JM, Kennedy MA, Prestegard JH. Nuclear magnetic dipole interactions in field-oriented proteins: information for structure determination in solution. Proceedings of the National Academy of Sciences. 1995;92(20):9279–9283. doi: 10.1073/pnas.92.20.9279. [DOI] [PMC free article] [PubMed] [Google Scholar]
- 16.Lounila J, Alakorpela M, Jokisaari J, Savolainen MJ, Kesaniemi YA. Effects of orientational order and particle-size on the NMR line positions of lipoproteins. Physical Review Letters. 1994;72(25):4049–4052. doi: 10.1103/PhysRevLett.72.4049. [DOI] [PubMed] [Google Scholar]
- 17.Liu C, Li W, Johnson GA, Wu B. High-field (9.4 T) MRI of brain dysmyelination by quantitative mapping of magnetic susceptibility. Neuroimage. 2011;56(3):930–938. doi: 10.1016/j.neuroimage.2011.02.024. [DOI] [PMC free article] [PubMed] [Google Scholar]
- 18.Mackay A, Whittall K, Adler J, Li D, Paty D, Graeb D. In vivo visualization of myelin water in brain by magnetic resonance. Magnetic Resonance in Medicine. 1994;31(6):673–677. doi: 10.1002/mrm.1910310614. [DOI] [PubMed] [Google Scholar]
- 19.Deoni SCL, Rutt BK, Arun T, Pierpaoli C, Jones DK. Gleaning multicomponent T1 and T2 information from steady-state imaging data. Magnetic Resonance in Medicine. 2008;60(6):1372–1387. doi: 10.1002/mrm.21704. [DOI] [PubMed] [Google Scholar]
- 20.Lancaster JL, Andrews T, Hardies LJ, Dodd S, Fox PT. Three-pool model of white matter. Journal of Magnetic Resonance Imaging. 2003;17(1):1–10. doi: 10.1002/jmri.10230. [DOI] [PubMed] [Google Scholar]
- 21.Schweser F, Deistung A, Güllmar D, Atterbury M, Lehr B, Sommer K, Reichenbach J. Non-linear evolution of GRE phase as a means to investigate tissue microstructure. 2011 [Google Scholar]
- 22.Li W, Han H, Guidon A, Liu C. Dependence of gradient echo phase contrast on the differential signal decay in subcellular compartments. Proc Int Soc Magn Reson Med. 2013;21 [Google Scholar]
- 23.Wharton S, Bowtell R. Fiber orientation-dependent white matter contrast in gradient echo MRI. Proceedings of the National Academy of Sciences. 2012;109(45):18559–18564. doi: 10.1073/pnas.1211075109. [DOI] [PMC free article] [PubMed] [Google Scholar]
- 24.Sukstanskii AL, Yablonskiy DA. On the role of neuronal magnetic susceptibility and structure symmetry on gradient echo MR signal formation. Magnetic Resonance in Medicine. 2013 doi: 10.1002/mrm.24629. [DOI] [PMC free article] [PubMed] [Google Scholar]
- 25.Sati P, van Gelderen P, Silva AC, Reich DS, Merkle H, de Zwart JA, Duyn JH. Micro-compartment specific T2* relaxation in the brain. NeuroImage. 2013;77(0):268–278. doi: 10.1016/j.neuroimage.2013.03.005. [DOI] [PMC free article] [PubMed] [Google Scholar]
- 26.Lebel C, Gee M, Camicioli R, Wieler M, Martin W, Beaulieu C. Diffusion tensor imaging of white matter tract evolution over the lifespan. NeuroImage. 2012;60(1):340–352. doi: 10.1016/j.neuroimage.2011.11.094. [DOI] [PubMed] [Google Scholar]
- 27.Haacke EM, Mittal S, Wu Z, Neelavalli J, Cheng YCN. Susceptibility-Weighted Imaging: Technical Aspects and Clinical Applications, Part 1. American Journal of Neuroradiology. 2009;30(1):19–30. doi: 10.3174/ajnr.A1400. [DOI] [PMC free article] [PubMed] [Google Scholar]
- 28.Haacke EM, Xu YB, Cheng YCN, Reichenbach JR. Susceptibility weighted imaging (SWI) Magnetic Resonance in Medicine. 2004;52(3):612–618. doi: 10.1002/mrm.20198. [DOI] [PubMed] [Google Scholar]
- 29.Wu B, Li W, Avram AV, Gho S-M, Liu C. Fast and tissue-optimized mapping of magnetic susceptibility and T2* with multi-echo and multi-shot spirals. Neuroimage. 2012;59(1):297–305. doi: 10.1016/j.neuroimage.2011.07.019. [DOI] [PMC free article] [PubMed] [Google Scholar]
- 30.Luo J, Jagadeesan BD, Cross AH, Yablonskiy DA. Gradient Echo Plural Contrast Imaging - Signal model and derived contrasts: T2*, T1, Phase, SWI, T1f, FST2*and T2*-SWI. NeuroImage. 2012;60(2):1073–1082. doi: 10.1016/j.neuroimage.2012.01.108. [DOI] [PMC free article] [PubMed] [Google Scholar]
- 31.Liu C, Murphy N, Li W. Probing white-matter microstructure with higher-order diffusion tensors and susceptibility tensor MRI. Frontiers in Integrative Neuroscience. 2013;7 doi: 10.3389/fnint.2013.00011. [DOI] [PMC free article] [PubMed] [Google Scholar]


