

Abstract
Background:
An increasing women-to-men ratio in later birth cohorts of patients with multiple sclerosis (MS) has been observed in several populations and has been hypothesised to be due to one or several environmental factors of importance for disease aetiology. However, in a study based on data from the Swedish MS registry (SMSreg) this ratio was recently reported to be rather stable during the 20th century.
Objective:
The purpose of this study was to reinvestigate the women-to-men ratio in Sweden based on data from all available data sources, including deceased patients.
Method:
We combined data from the SMSreg with data from national patient registers.
Results:
In total we obtained information on 19,510 MS patients born 1931–1985, 13,321 women and 6189 men. The women-to-men ratio increased from 1.70 for patients born in the 1930s to 2.67 for patients born in the 1980s. When comparing the coverage of SMSreg to the full data set, a significantly higher proportion of women born 1931–1935 compared to men born in the same period were found in SMSreg, resulting in a sampling bias hiding the increasing sex ratio in the full material.
Conclusion:
The women-to-men ratio in MS has increased in Sweden during the 20th century similarly to observations in other western countries.
Keywords: Multiple sclerosis, sex ratio, epidemiology, prevalence proportion, register study
Introduction
A recent review of prevalence and incidence studies in multiple sclerosis (MS) emphasised a pattern of increased women to men (w/m) ratio in later birth cohorts over time in the 20th century.1 Other studies analysing sex ratio by year of birth, have also reported an increased w/m ratio.2–4 However, an increase in the w/m ratio for MS is not present in all geographic areas, for example in countries from areas between latitude 12°S and 55°S, the sex ratios were stable over time.4
An increasing female preponderance of patients with MS has been taken as an indication for a change over time of exposure in the populations to certain environmental factors. In this context, it has been surprising that such an increase has not been evident in data from the Swedish national MS patient registry (SMSreg),5,6 an up to date clinical registry carrying data on over three-quarters of Swedish MS patients.7 This difference has in turn led to speculations of differential exposures over time to environmental triggers in different countries, as genetic factors are less likely to drift significantly over only a few generations.
This study aimed at, by increasing the previously investigated material in Sweden, assessing a possible change over time in the sex ratio of MS in Sweden. A national registry of discharge and specialist care diagnoses, known to have a mainly overlapping but somewhat higher degree of coverage of the population over time,7 was used to extend the material.
Materials and method
We used the Swedish Total Population Registry the Cause of Death Registry and the National Patient Register (PAR) as well as SMSreg to identify MS patients.
The Total Population Registry contains close to 15 million people with a Swedish personal identity number (PIN). The PIN is a unique identifier that was introduced in 1961 to everyone born in 1932 or later and/or residing in Sweden for a longer period of time. The Total Population Registry contains information on date of birth, sex and county and country of birth. By linking this to the Cause of Death Registry, we were able to identify deceased individuals. The PAR was started in 1968 and contains records of all inpatient visits to hospitals and, since 2001, also outpatient visits in specialist care units.
The SMSreg was introduced in 1997 and contains information on close to 14,600 MS patients, of which 13,500 are presently alive. It is widely used in neurology clinics all over the country by neurologists when counselling patients (http://www.smsreg.net2013-11-01). An individual was classified as an MS patient if they were either in SMSreg or in PAR with an International Classification of Diseases (ICD) code for MS according to ICD-10 (G35), ICD-9 (340) or ICD-8 (340). Characteristics for the full patient cohort are further described in Westerlind et al.8
MS patients identified through the registries and born in Sweden according to the Total Population Registry were selected and divided by birth-year into five-year cohorts. These were compared to figures for the total birth cohorts in Sweden and prevalence proportions and sex ratios of MS diagnosis were calculated. Confidence intervals (CIs) were estimated using the Poisson distribution.9 The slope of the line was investigated by fitting a linear regression in R10 with the sex ratio as the outcome and the mean year of birth in the cohort and the mean age at first occurrence in PAR for that cohort as covariates.
Comparisons between the number of patients from the previously published study based on SMSreg only5 and the patients identified in this study were performed using a chi square test to investigate significant differences in coverage of detection of the sexes. The Bonferroni correction was applied to correct for multiple testing using a Bonferroni factor of 11.
Analyses of the sex ratios were also performed in subparts of the datasets as a sensitivity analysis. These were divided into: MS as primary diagnosis, MS as secondary diagnosis, MS diagnosis obtained in the primary care, MS diagnosis obtained as outpatient, and MS diagnosis obtained during or after 1989, which is the year from which PAR is considered to have full coverage.7
Differences in age at death between the sexes were evaluated with a Kaplan-Meier analysis using the PROC survival statement in SAS software version 9.3. Mortality ratios for the different birth cohorts were also calculated.
Results
In total, 28,027 MS patients were identified through PAR and the SMSreg. Of these 25,566 were born in Sweden and 19,510 were born within 1931–1985. There were 13,321 women and 6189 men, making the mean sex ratio 2.15. The sex ratios increased from 1.70 for patients born in the 1930s, to 2.67 for patients born in the 1980s (Table 1). For patients born in 1971–1975 there was a slight decrease in the sex ratio compared to earlier years. A total of 18,546 (95.1%) of the patients were in PAR, and these were used to calculate the mean age at first hospitalisation, which decreased with all birth cohorts for both women and men, but did not differ between the sexes (Table 1). The subset of patients that were both in SMSreg and PAR (n=10,376) were used to calculate the mean years between estimated age at onset and first occurrence in PAR (Table 1) and no differences between the sexes were found, although the time decreased for all birth cohorts.
Table 1.
Numbers of women and men with multiple sclerosis, prevalence proportion per 100,000 person-years, the mean age at their first entry in the National Patient Register (PAR), and the difference between age at onset to entry in PAR in Sweden from birth cohorts 1931–1985; and the women-to-men ratios with 95% confidence interval (CI).
| Year ofbirth | Women |
Men |
Women-to-men ratio (95% CI) | ||||||||
|---|---|---|---|---|---|---|---|---|---|---|---|
| Birth cohort | Cases | Prevalence proportion | Mean age at first entry in PAR | Mean years from onset to entry in PAR* | Birth cohort | Cases | Prevalence proportion | Mean age at first entry in PAR | Mean years from onset to entry in PAR* | ||
| 1931–1935 | 212,062 | 857 | 404.13 | 55.28 | 17.14 | 224,809 | 533 | 237.09 | 53.71 | 14.93 | 1.70 (1.60–1.81) |
| 1936–1940 | 226,829 | 1091 | 480.98 | 52.42 | 15.70 | 239,586 | 614 | 256.28 | 52.03 | 15.20 | 1.88 (1.78–1.98) |
| 1941–1945 | 295,692 | 1678 | 567.48 | 49.90 | 11.90 | 313,752 | 848 | 270.28 | 48.24 | 10.27 | 2.10 (2.02–2.18) |
| 1946–1950 | 303,164 | 1791 | 590.77 | 47.42 | 9.46 | 321,581 | 858 | 266.81 | 46.99 | 8.93 | 2.21 (2.13–2.30) |
| 1951–1955 | 262,980 | 1581 | 601.19 | 44.47 | 7.84 | 279,925 | 743 | 265.43 | 44.80 | 7.89 | 2.26 (2.18–2.35) |
| 1956–1960 | 255,555 | 1471 | 575.61 | 41.54 | 6.75 | 272,037 | 617 | 226.81 | 41.01 | 6.96 | 2.54 (2.44–2.63) |
| 1961–1965 | 276,871 | 1459 | 526.96 | 37.73 | 5.17 | 293,287 | 582 | 198.44 | 37.70 | 5.81 | 2.66 (2.56–2.75) |
| 1966–1970 | 279,107 | 1257 | 450.36 | 34.48 | 3.85 | 296,463 | 479 | 161.57 | 34.22 | 4.23 | 2.79 (2.68–2.89) |
| 1971–1975 | 266,715 | 1030 | 386.18 | 30.39 | 2.81 | 283,211 | 453 | 159.95 | 30.86 | 2.69 | 2.41 (2.30–2.52) |
| 1976–1980 | 233,746 | 685 | 293.05 | 26.38 | 1.96 | 247,195 | 295 | 119.34 | 26.42 | 2.00 | 2.46 (2.32–2.59) |
| 1981–1985 | 228,679 | 421 | 184.10 | 23.26 | 1.30 | 242,264 | 167 | 68.93 | 21.99 | 1.56 | 2.67 (2.49–2.85) |
Calculated for the subgroup of patients that were both in PAR and SMSreg.
To assess a measure of statistical significance for the increase of the w/m ratio with time we obtained a beta estimate for the different birth cohorts. The model also included as a covariate the birth cohorts mean age at first occurrence in PAR for the 95% of the patients that had at least one occurrence in PAR, to control for this difference throughout the century. The beta for the birth cohorts indicated an increase of the ratio with 0.11 units per cohort (p-value = 0.004). The decrease for mean age at onset estimate from PAR was also significant with a p-value = 0.01. For comparison against previously published results from Sweden, Canada, and Norway, see Figure 1.
Figure 1.
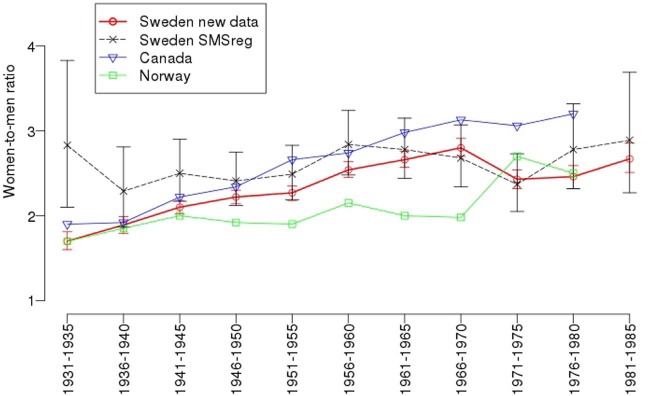
Sex ratios of multiple sclerosis in Sweden, analysed by year of birth from 1931–1985; and figures from the previously published sex ratio in Sweden.5 Sex ratios from Canada2 and Norway3 are taken from the articles and are estimated from the figures in their respective publications.
All analyses in the subgroups followed this pattern with a starting point between 1.64–2.02 and steadily increasing ratio (data not shown). For the patients that at any time had received MS as a secondary diagnosis, there was an increase in the w/m ratio for the patients born between 1971–1975 of 4.25. The number of individuals in this groups was, however, small (245 women, 61 men).
The coverage of SMSreg in the previously published paper5 differed significantly between men and women for patients born in 1931–1935, with 18.0 % of the women identified compared to 10.8 % of the men (corrected p-value = 0.024).
The mean age at death for men and women born in the 1930s did not differ, however there was a difference in mortality rate between the sexes, and 69.42% of the men had died before the time of the study, compared to 54.38% of the women (Table 2). The Kaplan-Meier analysis confirmed this difference to be significant (p-value<0.0001).
Table 2.
Numbers and percent of deceased women and men, the mean age at death and the women-to-men ratios of the percent deceased for patients with multiple sclerosis in Sweden.
| Year of birth | Women |
Men |
Proportion ratio (% w/% m) | ||||
|---|---|---|---|---|---|---|---|
| Cases | Proportion deceased (%) | Mean age | Cases | Proportion deceased (%) | Mean age | ||
| 1931–1935 | 466 | 54.38 | 64.61 | 370 | 69.42 | 64.27 | 0.78 |
| 1936–1940 | 417 | 38.22 | 60.79 | 293 | 47.72 | 60.25 | 0.80 |
| 1941–1945 | 424 | 25.33 | 56.53 | 317 | 37.38 | 55.74 | 0.68 |
| 1946–1950 | 298 | 16.64 | 52.15 | 195 | 22.73 | 51.54 | 0.73 |
| 1951–1955 | 178 | 11.26 | 48.37 | 120 | 16.15 | 47.72 | 0.70 |
| 1956–1960 | 89 | 6.05 | 44.05 | 74 | 11.99 | 44.22 | 0.50 |
| 1961–1965 | 55 | 3.77 | 40.80 | 42 | 7.22 | 39.65 | 0.52 |
| 1966–1970 | 26 | 2.07 | 38.31 | 13 | 2.71 | 36.44 | 0.76 |
| 1971–1975 | 5 | 0.49 | 30.92 | 12 | 2.65 | 32.51 | 0.18 |
| 1976–1980 | 5 | 0.73 | 22.67 | 4 | 1.36 | 29.60 | 0.54 |
| 1981–1985 | 0 | 0 | − | 3 | 1.80 | 22.81 | − |
Discussion
We extend the report of an increased female preponderance among patients with MS in recent years to Sweden, confirming a global trend.
In a previous study based on the SMSreg, no differences in sex ratios were detected. We here added information from PAR, an in- and outpatient registry covering all inpatient visits in Sweden since 1968 and outpatient visits since 2001, to calculate the sex ratios.
It appears that the MS population coverage in the SMSreg relative to that of PAR changed over time and differed between sexes. Thus, for patients born in the 1930s only 18.1% of women and 10.9% of men represented in PAR were included in SMSreg (corrected p-value = 0.025). In later birth cohorts, SMSreg coverage gradually increased and sex differences levelled out. Therefore, an existing change in sex ratio was effectively balanced out in SMSreg by a differential inclusion between men and women. This could be explained by the difference in mortality: a larger proportion of men born in the 1930s, compared to women, had died when the SMSreg came into use. The increasing sex ratios presented here are similar to the previously published results from other countries1,2,4 and the decrease in the ratio for people born in the beginning of the 1970s, was also found in the Canadian study.2 In the 1971–1975-cohort, as well as the two younger births cohorts, the confidence intervals became larger and slightly overlapping. A previous analysis of the age at onset distribution of patients with MS in Sweden8 showed that at age 39 approximately 73% of the patients had reached onset. We thus believe the number of individuals in the three youngest birth cohorts will increase and get correspondingly narrower confidence intervals. Despite the uncertainty in the w/m ratios in the youngest birth cohorts, the slope of the line was significant with a mean increase of 0.11 units per birth cohort. The mean age at first entry in PAR did not differ between the sexes, indicating no structural differences in the MS treatment for men compared to women. The age at first entry did however decrease for all birth cohorts, from over 50 years to slightly above 20. This is however confounded, both by the fact that PAR was not introduced until 1968, when the oldest patients were already around 40 years, and the youngest birth cohorts still being at high risk for developing MS8 and thereby likely to increase in numbers in the future.
The increasing sex ratio was not found in a study from Norway.3 However, the number of patients born in the 1930s in the Norwegian study was small compared to the number of patients identified in the other birth cohorts. The data collection in Norway was based mainly on the Norwegian MS registry, but also includes patients from a prevalence study conducted in 2000. Based on the analysis and results in our study, we thus think it cannot be excluded that a similar sampling bias as found in our study could be present in the Norwegian study.
Our study highlights a patient participation bias in a clinical registry. In this case a bias toward higher participation for women among older patients, caused by a higher mortality rate in men, masked the lower sex ratio and resulted in a Type II error in the previous report.
To further investigate suggested explanations for the increased sex ratio, a post-hoc analysis was performed by looking at the age at first child birth, a topic that has been researched in Denmark.11,12 We calculated the age when the first child was born for the female MS patients and compared this to the general population. An increase in age was seen between the birth cohorts, but there was no difference between MS patients and controls. The mean age for the first child was almost exactly the same for both groups, and also the percentage of women that had given birth at least once (data not shown). Thus according to this data, it seems not to be a likely explanation for the increasing sex ratio in the Swedish population. A similar result, with no significant association to parents age at first childbirth has also been found in a Danish study.12
The global change in sex ratio of MS has interesting implications. It indicates the influence of one or several yet unknown environmental factors acting on the population. Identification of this factor could cast light on triggering events in MS pathogenesis. The increased prevalence reported in almost all areas where epidemiological surveys have been repeated, is thus less likely to not be merely the effect of an improved case ascertainment. One candidate factor could be smoking, as Palacios et al. have described, the gender ratio of MS is correlated with the gender ratio of smoking.13 However, the trend in the gender ratio of smoking is driven by a decline in smoking among men, rather than by an increase in women, as observed for MS incidence. Subsequently, Palacios suggested that some factor, other than smoking, must account for the increase in MS incidence in women. However, when looking at Swedish national data from the Swedish National Institute of Public Health (Folkhälsoinstitutet),14 it is obvious that both Swedish women and men smoked gradually less in recent decades, a still ongoing trend. For both sexes born in 1920–1939 in Sweden, smoking is rather sparse, but in the later birth cohorts the increase is greater in women than for men, so in people born 1940–1959, substantially more women smoke. This pattern stays consistent, i.e. smoking is more common in women, although there is currently a general decreasing trend of smoking. We cannot rule out that this can have had an impact on the increasing w/m ratio in MS if other factors would lie behind the increasing overall prevalence. Modelling of the potential influence of smoking on different populations and to what extent this could be an explanation for the increasing ratio is thus of interest for future studies.
When assessing patients through PAR there is unfortunately no good way of ascertaining incidence rates, something that would be of great interest, as the first MS diagnosis in PAR in mean was almost 14 years later that the estimated age at onset in SMSreg8 and thus poorly reflects the time of onset of disease. The lack of incidence rate analysis is thus a weakness of this study. However, the consistency indicated by the sensitivity analyses speaks for the reliability of our results. Another weakness with PAR is that it uses ICD codes without additional registration of disease course. However MS courses as defined today were standardised as late as in 199615 and since PAR dates back to 1968, course data is not available. Thus we were unable to assess the sex ratio for relapsing–remitting MS (RRMS) and primary progressive MS (PPMS) respectively. As to date there is no updated study of the proportion of PPMS patients in Sweden. In a study of the sex-ratio in neighbouring Norway,3 a population with similar genetic background living on approximately the same latitude as Sweden, showed a median sex-ratio around 1.1 with no increase. About 17% of the patients had a PPMS course, and only between the years 1940–1959 were the patient groups big enough to assess the sex-ratio. In a Canadian study from 2010,16 also a stable sex-ratio, although slightly higher than in Norway, was found. The proportion of PPMS patients in this study was about 19%. As we have no data on disease course, we cannot confirm these studies, but we believe that the low proportion of PPMS patients is unlikely to be driving the increase of females with MS in Sweden, and that the increase is driven by the RRMS patients in Sweden as well.
Conclusion
The women-to-men ratio in MS has increased also in Sweden in persons born in later decades during the 20th century in a way similar to that reported from other western countries.
Acknowledgments
The authors wish to acknowledge the Swedish MS registry for supplying data.
Footnotes
Conflicts of interest: None declared.
Funding: Financial support was provided from the Swedish Research Council, Bibbi and Nils Jensen Foundation, Swedish Foundation for Strategic Research and Swedish Research Council through the Swedish Initiative for Research on Microdata in the Social And Medical Sciences (SIMSAM) framework. Grant number: 340-2013-5867.
Contributor Information
Helga Westerlind, Karolinska Institutet, The Multiple Sclerosis Research Group, Tomebodavägen 18A:05, Stockholm, Solna, 17177, Sweden.
Inger Boström, Linköping University, Sweden.
Leszek Stawiarz, Karolinska Institutet, Sweden.
Anne-Marie Landtblom, Linköping University, Sweden/Neurology Unit, General Hospital, Motala, Sweden.
Catarina Almqvist, Karolinska Institutet, Sweden/Lung and Allergy Unit Astrid Lindgren Children’s Hospital, Karolinska University Hospital, Solna Sweden.
Jan Hillert, Karolinska Institutet, Sweden.
References
- 1. Koch-Henriksen N, Sørensen PS. The changing demographic pattern of multiple sclerosis epidemiology. Lancet Neurol 2010; 9: 520–532. [DOI] [PubMed] [Google Scholar]
- 2. Orton S-M, Herrera BM, Yee IM, et al. Sex ratio of multiple sclerosis in Canada: A longitudinal study. Lancet Neurol 2006; 5: 932–936. [DOI] [PubMed] [Google Scholar]
- 3. Kampman MT, Aarseth JH, Grytten N, et al. Sex ratio of multiple sclerosis in persons born from 1930 to 1979 and its relation to latitude in Norway. J Neurol 2013; 260: 1481–1488. [DOI] [PubMed] [Google Scholar]
- 4. Trojano M, Lucchese G, Graziano G, et al. Geographical variations in sex ratio trends over time in multiple sclerosis. PLoS One 2012; 7: e48078. [DOI] [PMC free article] [PubMed] [Google Scholar]
- 5. Boström I, Stawiarz L, Landtblom A-M. Sex ratio of multiple sclerosis in the National Swedish MS Register (SMSreg). Mult Scler 2013; 19: 46–52. [DOI] [PubMed] [Google Scholar]
- 6. Boström I, Stawiarz L, Landtblom A-M. Age-specific sex ratio of multiple sclerosis in the National Swedish MS Register (SMSreg). Mult Scler 2013. [Epub ahead of print]: Aug 6 PMID: 23921135. [DOI] [PubMed] [Google Scholar]
- 7. Ludvigsson JF, Andersson E, Ekbom A, et al. External review and validation of the Swedish national inpatient register. BMC Public Health 2011; 11: 450. [DOI] [PMC free article] [PubMed] [Google Scholar]
- 8. Westerlind H, Ramanujam R, Uvehag D, et al. Modest familial risk for multiple sclerosis - a registry based study of the population of Sweden. Brain 2014; 137: 770–778. [DOI] [PMC free article] [PubMed] [Google Scholar]
- 9. Schoenberg B. Calculating confidence intervals for rates and ratios. Neuroepidemiology 1983; 2: 257–265. [Google Scholar]
- 10. R Core Team. R: A language and environment for statistical computing. 2013. Vienna, Austria. [Google Scholar]
- 11. Nielsen NM, Jørgensen KT, Stenager E, et al. Reproductive history and risk of multiple sclerosis. Epidemiology 2011; 22: 546–552. [DOI] [PubMed] [Google Scholar]
- 12. Magyari M, Koch-Henriksen N, Pfleger CC, et al. Reproduction and the risk of multiple sclerosis. Mult Scler 2013; 19: 1604–1609. [DOI] [PubMed] [Google Scholar]
- 13. Palacios N, Alonso A, Brønnum-Hansen H, et al. Smoking and increased risk of multiple sclerosis: Parallel trends in the sex ratio reinforce the evidence. Ann Epidemiol 2011; 21: 536–542. [DOI] [PMC free article] [PubMed] [Google Scholar]
- 14. Folkhälsoinstitutet. Tobaksvanor, tidsserier och regionala resultat, 2012. “http://www.folkhalsomyndigheten.se/” www.folkhalsomyndigheten.se (accessed 14 November 2013).
- 15. Lublin FD, Reingold SC. Defining the clinical course of multiple sclerosis: Results of an international survey. National Multiple Sclerosis Society (USA) Advisory Committee on Clinical Trials of New Agents in Multiple Sclerosis. Neurology 1996; 46: 907–911. [DOI] [PubMed] [Google Scholar]
- 16. Ramagopalan SV, Byrnes JK, Orton S-M, et al. Sex ratio of multiple sclerosis and clinical phenotype. Eur J Neurol 2010; 17: 634–637. [DOI] [PubMed] [Google Scholar]