

Abstract
Biological imaging continues to improve, capturing continually longer-term, richer, and more complex data, penetrating deeper into live tissue. How do we gain insight into the dynamic processes of disease and development from terabytes of multidimensional image data? Here I describe a collaborative approach to extracting meaning from biological imaging data. The collaboration consists of teams of biologists and engineers working together. Custom computational tools are built to best exploit application-specific knowledge in order to visualize and analyze large and complex data sets. The image data are summarized, extracting and modeling the features that capture the objects and relationships in the data. The summarization is validated, the results visualized, and errors corrected as needed. Finally, the customized analysis and visualization tools together with the image data and the summarization results are shared. This Perspective provides a brief guide to the mathematical ideas that rigorously quantify the notion of extracting meaning from biological image, and to the practical approaches that have been used to apply these ideas to a wide range of applications in cell and tissue optical imaging.
INTRODUCTION
What is meaning? From a mathematical perspective, this question has been eloquently answered by a trilogy of papers on meaningful information (Gacs et al., 2001; Vereshchagin and Vitanyi, 2004; Vitanyi, 2006). This mathematical formulation of meaning will be described briefly later. From my perspective as a computer engineer whose passion is analyzing biological images of live cell and tissue obtained by optical microscopy, the answer is more direct. Simply put, there are three steps to extracting meaningful information from imaging data. First, the data must be summarized concisely (Cohen et al., 2009). Next this summary must be validated (Winter et al., 2011; Wait et al., 2014). Finally, the data need to be shared. In theory, these steps apply to any type of data (Li and Vitanyi, 1997). In practice, they have been applied to a wide range of applications using time-lapse phase and/or fluorescence microscopy. This Perspective will describe these steps in detail.
To accomplish summarization, validation, and sharing for biological imaging data, computational tools are required. Visualizing the data together with summarization results is key. Quite often, this visualization is both the means and the end for making imaging data meaningful. Visualizing image data can be difficult, particularly as the dimensionality of the data grows. In imaging, dimensions are first spatial. A pixel, or picture element, is at location (x, y) for two-dimensional (2D) images. A voxel, or volume element, is at location (x, y, z) for three-dimensional (3D) images. In time-lapse imaging, a voxel location is specified as a spatiotemporal (four-dimensional) point, (x, y, z, t). In fluorescence microscopy, we add a spectral channel λ to represent different imaging channels, and the data are five dimensional (5D; x, y, z, t, λ). As dimensionality continues to grow, visualization becomes even more important for extracting meaning and value from our imaging data. Visualizing complex image data together with summarization results is a challenge that requires sophisticated hardware and software solutions (Peng et al., 2014; Wait et al., 2014).
Another challenge is the size of the data set. Current-generation time-lapse microscopes include integrated incubation and can typically acquire 100 movies or time-lapse image sequences in a single experiment. Each movie can consist of thousands of images. In our ongoing work analyzing stem cell image sequence data, a single data set of 200 movies requires 350 gigabytes (GB) of image data or more. This is obviously too much data to analyze by hand or by eye—we must turn to computational analysis. There are many software packages for working with smaller and less complex image data sets (Eliceiri et al., 2012), but here I focus on software solutions custom written for the specific characteristics of the image data in order to best summarize the data in the context of a particular biological question. One of the key challenges in biological image analysis is the lack of computational tools for interactively and collaboratively summarizing, visualizing, and validating image data. Figure 1 shows an overview of the summarization, validation, and sharing steps.
FIGURE 1:
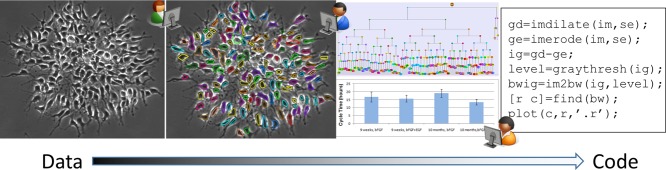
Interactive and collaborative use of the image data, together with the summarization results and the visualization and analysis code. Left to right, single image from a 2000-frame sequence, same image with segmentation and tracking results overlaid, lineage tree with time as the vertical axis (top) and statistical model (bottom) and open source code fragment. The arrow on the bottom shows the progression from image data to source code, with summarization results falling in the gray area.
The notions of “concise” and “meaningful” as used here are not qualitative measures. Algorithmic information theory (AIT) is a theoretical framework for image understanding that provides mathematical and computational techniques to quantify how concise a representation is possible and how well a model captures the meaningful information from a given digital object. The foundation of AIT is Kolmogorov complexity (Li and Vitanyi, 1997). The Kolmogorov complexity of a digital object, a movie, an experiment, or a data set gives a measure of the most concise possible description of the object. Think of it as the file size in bytes that the perfect file compression algorithm would achieve on the given data. AIT also characterizes the relationship between data and models. Randomness deficiency measures how much meaningful information a model has extracted from the data (Cohen et al., 2009). AIT gives the capability to quantify how well our summary represents the image data.
A CONCISE AND MEANINGFUL SUMMARY OF THE IMAGE DATA
The first step is to summarize the data, to find a more concise representation compared with the hundreds of gigabytes of images. The tasks associated with summarization include denoising, segmentation, tracking, lineaging, and modeling. The best approaches to summarizing image data will exploit information in both directions among these tasks. Not every application will require all of these tasks. For example, image compression algorithms have been used to quantify the developmental potential of stem cells from single image frames (Zhang et al., 2012).
Denoising algorithms need to be matched to the specific characteristics of the images. One of the simplest and most effective denoising approaches is the median filter. This robust estimator is particularly good at removing the ubiquitous “salt and pepper” noise. More complicated approaches model the imaging noise and the background structure separately and use a combination of filters (Michel et al., 2007). As the first task in the summarization step, denoising is highly specific to the imaging conditions. In a recent paper on visualization and analysis of 5D images (Wait et al., 2014), different denoising algorithms were used for different image channels, each with carefully chosen parameters to match the imaging and noise characteristics. After denoising, the images are segmented to identify the individual objects.
Segmentation, or delineation of individual objects, is a two-step task. First, a threshold divides the image into foreground and background regions. The foreground contains the important objects. Thresholding picks an intensity value to separate the two regions. Picking this value automatically, called adaptive thresholding, is one of the very few easy tasks in image analysis (Otsu, 1979). If the objects in your image are not touching each other, then congratulations! You are done with segmentation; your results should be near perfect. It is more likely that your objects will be in contact, at least occasionally, and more sophisticated segmentation is needed.
After thresholding, separating touching objects is the second segmentation step. Separating touching objects is far and away the hardest task you face. If you are using 2D imaging to look at 3D objects, they can overlap partially or completely. This overlap is called occlusion. Occlusion can make it impossible for even a human domain expert (that's you) to manually segment the objects. If you have time sequence data, incorporating temporal context to improve the low-level image processing tasks has been widely used with good success (Cohen et al., 2010; Winter et al., 2011). As a rule of thumb, if you can see the correct segmentation by eye, an algorithm will often, although not always, be able to extract the correct answer. Similarly, if you are unable to determine the correct segmentation by eye, the algorithm will rarely, although not never, extract the correct answer. After segmentation, if you have time sequence data, tracking is next.
Tracking establishes temporal correspondences between segmentation results. Simpler tracking algorithms establish these correspondences between pairs of image frames (Clark et al., 2011). More sophisticated algorithms solve the correspondence over multiple image frames simultaneously, often achieving significantly better accuracy. For biological applications, our multitemporal association tracking is a multiframe tracking solution that has proven widely effective for tracking organelles and stem cells (Winter et al. 2011, 2012; Chenouard et al., 2014; Mankowski, 2014). If you capture images frequently enough, so that, for example, objects overlap by 50% or more between frames, and the segmentation is reliable, tracking should be straightforward. For image sequences with proliferating cells, one additional task is to establish the parent–daughter relationship or lineage (Al-Kofahi et al., 2006; Winter et al., 2011; An-An et al., 2012). The results of the segmentation, tracking, and lineaging algorithms, taken together, are referred to as the dynamic phenotype (Cohen et al., 2009). The dynamic phenotype is a far more concise representation compared with the image data, but it is not the ultimate goal. For the example described earlier, starting with 350 GB of image data, the dynamic phenotype still contains a considerable 2 GB of data. To extract meaning from the image data, we must fit a model to these data.
The final step of summarization is to model the dynamic phenotype. A model, in both the mathematical (AIT) and biological senses, is a concise representation of our data. The simplest models are statistical. In unsupervised approaches to AIT, models are based on clustering, or partitioning the data based on, for example, meaningful differences in behavior. More complex models span the fields of physics, pattern recognition, machine learning, and so on and can typically include domain- or application-specific knowledge. For example, generative models learn simulation parameters from the image data and are scored by how well they recreate object behaviors (Peng and Murphy, 2011). The current state of the art in AIT gives a theoretical basis for analyzing distinct classes of models, including finite sets, recursive functions, and probability distributions (Vitanyi, 2006), and a practical set of tools for unsupervised (Cohen et al., 2009) or semisupervised (Cohen et al., 2010) analyses based on AIT principles. Of importance, these practical applications of AIT for summarization and modeling have consistently found that the algorithmically meaningful characteristics of the image data were also biologically meaningful. Integrating new types of models into the AIT framework will be another very active research area moving forward. Although AIT provides rigorous tools to characterize the relationships between data and models, ultimately the judgment of the biologists and engineers most familiar with the application must be brought to bear.
VALIDATING THE SUMMARY
Validation is the next step after summarization. There is no completely computational approach to extracting meaningful information from image data. Summarization algorithms for complex data will always require human assistance, at the very least to provide domain knowledge on the imaging and application characteristics. There is also often the need to correct any errors in some parts of the automatically generated summarization. This is the validation step.
AIT is robust to segmentation and denoising errors, but for some applications, any tracking errors can render the summary invalid (Cohen et al., 2009). Tools like LEVER (Winter et al., 2011) have been developed to allow users to correct any errors in the automated segmentation, tracking, and lineaging. The guiding principle behind such approaches is to minimize the amount of human effort required to correct any errors. In LEVER, this is accomplished by learning from user-provided corrections to automatically correct related mistakes. The validation incorporates the ability to correct errors, automatically using the information provided by the human observer to update the summary. One significant challenge is how to handle the visual ambiguity inherent in biological images. There are two ways to handle the situation in which human observers are unable to determine, or to agree on, a ground truth. Either the data must be discarded, or it must be marked as ambiguous in the summarization so that subsequent analysis can determine how best to handle the ambiguity. The question of how to best integrate human expertise into the data summarization process and to manage ambiguity in the summarization results is another very active research area.
SHARING THE RESULTS
Like everything else in science, the real value of our images and summarization methods and results comes when others can use them. Many software tools, including most of the ones mentioned in this Perspective, are provided open source. Generally “open source” means that you are allowed to download, use, and modify the code as you like. Redistribution is generally allowed, but with varying restrictions. One limitation is that if image data are not available, there is no practical way to visualize the results. Without the ability to visualize summarization results together with the image data, it becomes impossible to reuse the results with any confidence. It is also difficult to evaluate the quality of the code. Data and code need to go together.
New hardware and software infrastructure designed for viewing and interacting with complex data over the Internet continues to improve. Recently HTML5 and WebGL standards have been developed. These standards provide a widely available framework for high-performance interactive and distributed applications, exactly what we need to make our imaging data and summarization results ubiquitously available. Even for large imaging experiments, an “open data” approach is feasible. For the stem cell image data example described earlier, the 350 GB of image data can be lossy compressed (e.g., JPEG) down to <10 GB. This is a reasonable amount of data to download. Although lossy compression should never be used in segmentation or denoising, it is perfectly acceptable for visualizing and validating the summary. There is no technical hurdle to providing open source code together with all of the image data and the summarization results.
CONCLUSION
The best way to show the importance of the biology, the beauty of the imaging, and the truth of the summarization is to show all of the data together with the summarization results. The size and complexity of our imaging data will continue to grow, incorporating new imaging modalities and additional data types. Collaboration between teams of biologists and engineers will be needed to design experiments and guide the analyses of these rich data. To realize the full potential of our imaging data to provide insight into fundamental questions in biology and medicine, we must enable all of the data to be visualized together with the validated summarization. Extracting meaningful information from biological imaging data will require leveraging the best capabilities of interdisciplinary teams of human domain experts working together with sophisticated computational hardware and software. The success of our methods will be measured by how easy it is to reuse our techniques and build on our results. The future of biological imaging has never looked brighter!
Acknowledgments
Image data from Figure 1 are courtesy of Sally Temple, Susan Goderie, Mo Liu, and Maria Apostolopoulou from the Neural Stem Cell Institute, Rensselaer, NY. Thanks go to Walt Mankowski, Mark Winter, Eric Wait, and Sally Temple for feedback and suggestions on the manuscript. Portions of the research described were supported by Drexel University, the National Institute of Neurological Disorders and Stroke (R01NS076709), the National Institute of Aging (R01AG040080), and a Human Frontier Science Program grant (RGP0060/2012).
Abbreviations used:
- AIT
algorithmic information theory
- GB
gigabytes
- HTML5
Hypertext Markup Language version 5
- JPEG
Joint Photographic Experts Group compression standard
- LEVER
lineage editing and validation software.
Footnotes
REFERENCES
- Al-Kofahi O, Radke RJ, Goderie SK, Shen Q, Temple S, Roysam B. Automated cell lineage tracing: a high-throughput method to analyze cell proliferative behavior developed using mouse neural stem cells. Cell Cycle. 2006;5:327–335. doi: 10.4161/cc.5.3.2426. [DOI] [PubMed] [Google Scholar]
- An-An L, Kang L, Kanade T. A semi-Markov model for mitosis segmentation in time-lapse phase contrast microscopy image sequences of stem cell populations. IEEE Trans Med Imaging. 2012;31:359–369. doi: 10.1109/TMI.2011.2169495. [DOI] [PubMed] [Google Scholar]
- Chenouard N, Smal I, Chaumont F de, Maska M, Sbalzarini IF, Gong Y, Cardinale J, Carthel C, Coraluppi S, Winter M, et al. Objective comparison of particle tracking methods. Nat Methods. 2014;11:281–289. doi: 10.1038/nmeth.2808. [DOI] [PMC free article] [PubMed] [Google Scholar]
- Clark B, Winter M, Cohen AR, Link B. Generation of Rab-based transgenic lines for in vivo studies of endosome biology in zebrafish. Dev Dynam. 2011;240:2452–2465. doi: 10.1002/dvdy.22758. [DOI] [PMC free article] [PubMed] [Google Scholar]
- Cohen AR, Bjornsson C, Temple S, Banker G, Roysam B. Automatic summarization of changes in biological image sequences using algorithmic information theory. IEEE Trans Pattern Anal Mach Intell. 2009;31:1386–1403. doi: 10.1109/TPAMI.2008.162. [DOI] [PubMed] [Google Scholar]
- Cohen AR, Gomes F, Roysam B, Cayouette M. Computational prediction of neural progenitor cell fates. Nat Methods. 2010;7:213–218. doi: 10.1038/nmeth.1424. [DOI] [PubMed] [Google Scholar]
- Eliceiri KW, Berthold MR, Goldberg IG, Ibanez L, Manjunath BS, Martone ME, Murphy RF, Peng H, Plant AL, Roysam B, et al. Biological imaging software tools. Nat Methods. 2012;9:697–710. doi: 10.1038/nmeth.2084. [DOI] [PMC free article] [PubMed] [Google Scholar]
- Gacs P, Tromp J, Vitanyi P. Algorithmic statistics. IEEE Trans Inf Theory. 2001;47:2443–2463. [Google Scholar]
- Li M, Vitanyi PMB. An Introduction to Kolmogorov Complexity and Its Applications. New York: Springer-Verlag; 1997. [Google Scholar]
- Mankowski W, Winter M, Wait E, Naik S, Lodder M, Shumacher T, Cohen AR. Segmentation of occluded hematopoietic stem cells from tracking. Presented at 36th Annual International Conference of the IEEE Engineering in Medicine and Biology Society, Chicago, IL. 2014 doi: 10.1109/EMBC.2014.6944874. [DOI] [PMC free article] [PubMed] [Google Scholar]
- Michel R, Steinmeyer R, Falk M, Harms GS. A new detection algorithm for image analysis of single, fluorescence-labeled proteins in living cells. Microsc Res Tech. 2007;70:763–770. doi: 10.1002/jemt.20485. [DOI] [PubMed] [Google Scholar]
- Otsu N. A threshold selection method from gray-level histograms. IEEE Trans Systems Man Cybernet. 1979;9:62–66. [Google Scholar]
- Peng H, Bria A, Zhou Z, Iannello G, Long F. Extensible visualization and analysis for multidimensional images using Vaa3D. Nat Protocols. 2014;9:193–208. doi: 10.1038/nprot.2014.011. [DOI] [PubMed] [Google Scholar]
- Peng T, Murphy RF. Image-derived, three-dimensional generative models of cellular organization. Cytometry A. 2011;79:383–391. doi: 10.1002/cyto.a.21066. [DOI] [PMC free article] [PubMed] [Google Scholar]
- Vereshchagin NK, Vitanyi PMB. Kolmogorov's structure functions and model selection. IEEE Trans Inf Theory. 2004;50:3265–3290. [Google Scholar]
- Vitanyi P. Meaningful information. IEEE Trans Inf Theory. 2006;52:4617–4626. [Google Scholar]
- Wait E, Winter M, Bjornsson C, Goderie S, Wang J, Kokovay E, Temple S, Cohen AR. Visualization and correction of automated segmentation, tracking and lineaging from 5-D stem cell image sequences. BMC Bioinformatics. 2014;15:328. doi: 10.1186/1471-2105-15-328. [DOI] [PMC free article] [PubMed] [Google Scholar]
- Winter M, Wait E, Roysam B, Goderie S, Kokovay E, Temple S, Cohen AR. vertebrate neural stem cell segmentation, tracking and lineaging with validation and editing. Nat Protocols. 2011;6:1942–1952. doi: 10.1038/nprot.2011.422. [DOI] [PMC free article] [PubMed] [Google Scholar]
- Winter MR, Fang C, Banker G, Roysam B, Cohen AR. Axonal transport analysis using multitemporal association tracking. Int J Comput Biol Drug Des. 2012;5:35–48. doi: 10.1504/IJCBDD.2012.045950. [DOI] [PMC free article] [PubMed] [Google Scholar]
- Zhang X, Wang H, Collins T, Luo Z, Li M. Classifying stem cell differentiation images by information distance. In: Flach P, De Bie T, Cristianini N, editors. Machine Learning and Knowledge Discovery in Databases. Berlin: Springer; 2012. pp. 269–282. [Google Scholar]