

Abstract
The microscopic world of a cell can be as alien to our human-centered intuition as the confinement of quarks within protons or the event horizon of a black hole. We are prone to thinking by analogy—Golgi cisternae stack like pancakes, red blood cells look like donuts—but very little in our human experience is truly comparable to the immensely crowded, membrane-subdivided interior of a eukaryotic cell or the intricately layered structures of a mammalian tissue. So in our daily efforts to understand how cells work, we are faced with a challenge: how do we develop intuition that works at the microscopic scale?
I have deeply regretted that I did not proceed far enough at least to understand something of the great leading principles of mathematics, for men thus endowed seem to have an extra sense.
—Charles Darwin, Autobiography
In aiming to build better intuition for the alien world of cells, it is useful to first imagine how we would introduce our modern human society to curious aliens. If and when we meet an alien, we plan to come prepared with copies of the most recent census—chock full of numbers, charts, and summary statistics. Numbers will tell our alien friend when we will likely marry, how many children we will have, and what will most likely cause our deaths. They will also report how many hours we spend commuting to work and watching TV and what we eat when we do those things. Just as quantitative data clearly describe the behavior of human populations, numbers offer a clear path to understanding the alien world of cells. Yet there is still so much to be learned—our current cellular census is woefully incomplete. We biologists should improve the cellular census and document the budgets of cells so that we can leverage the incredible capacity of numbers to describe biological systems and generate testable predictions about them.
Applying this quantitative approach to biology is inherently difficult because life is dynamic and diverse. For example, when we ask our fellow biologists how many copies of their favorite protein are found in a particular cell line, they often answer that “it depends.” And indeed it does depend—on the carbon source, the presence of different signaling molecules, and the temperature in the lab that day. Sometimes, after a long day in lab, it may seem like “it depends” also on the whims of mercurial and vengeful gods. But we want to make the case that it is nonetheless important to supply a number. To see why, let's examine how intuitively we process dynamic ranges of values in a more familiar scenario.
How much does a car cost? You would certainly be right to say that the price depends on the make, the model, and the dealer. But that answer conveys no information. You might also tell us that the Honda Civic you want costs $12,895 at the dealership downtown. But that is only that one Honda—the answer is too precise to be informative about other cars. Finally, you might tell us that a car costs about $10,000. This number is not so accurate—a cheap car might be $8000 and a more expensive one $40,000—but it is a very useful estimate. We would probably have a similar discussion about the cost of a TV, only scaled down by an order of magnitude. Like a car, the cost of a TV also depends. If all we knew was that “it depends,” without a rough estimate of the price, it would be difficult for us to choose a free car over a free TV as a game show contestant. But everyone knows you should choose the car because a car costs ≈$10,000 and a TV costs ≈$1000. Luckily, we carry with us such intuition-building order-of-magnitude estimates as we forage through the modern jungle.
Moving to the world of cell biology, we can test our intuition by asking, Which is heavier, a protein or the mRNA that codes for it? Even after years of studying and manipulating DNA, RNA, and protein in our labs, we may not be prepared for this question. Equipped with a few numbers, however, we can answer the question easily and begin to renovate our intuition. Natural amino acids vary somewhat in their molecular mass, but their average mass is ≈100 Da or about threefold less than a nucleotide (weighing ≈300 Da; for full reference to the primary literature Google “BNID 104886,” the BioNumbers ID for this particular quantity). Because the genetic code uses three nucleotides to encode each amino acid, we quickly conclude that an mRNA has a mass about ninefold greater than the protein it encodes (without even accounting for the mass of untranslated regions of mRNA). In contrast to the usual cartoon representations of the central dogma, which can obscure the relative sizes of molecular components, Figure 1 is drawn to scale. If more of our models and textbook figures respected quantitative properties like size and concentration, we might have developed a better intuitive grasp of these properties (for an example of a situation in which paying attention to the relative sizes of proteins was vital see Davis and van der Merwe, 2006; James and Vale, 2012).
FIGURE 1:
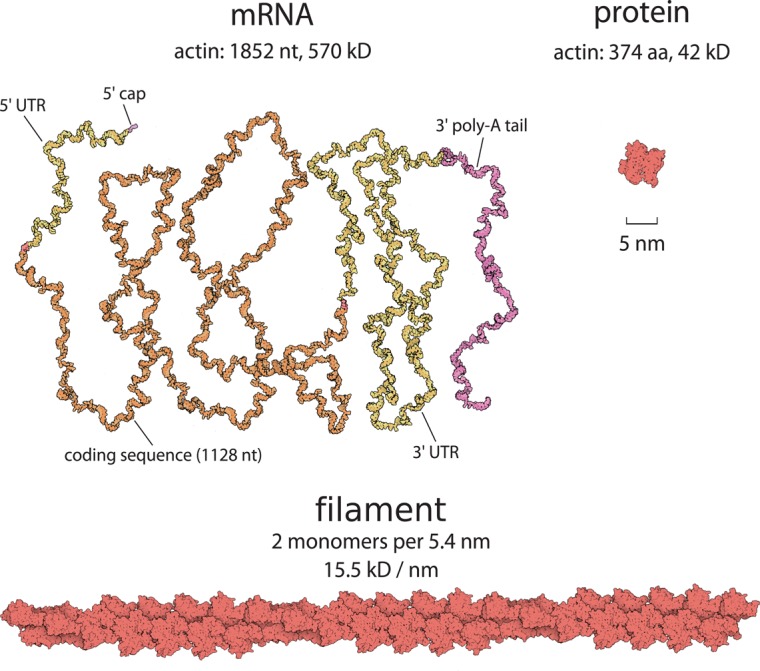
Which is larger, mRNA or the protein for which it codes? When we ask, most peoples' instinct is to say that proteins are larger. As seen in this figure, the opposite is overwhelmingly the case. The mRNA for actin is more massive and has a larger geometric size than the actin monomers for which it codes because the mass of a codon of mRNA is an order of magnitude greater than that of the average amino acid.
To explore the power of biological numeracy further, let's continue on the theme of transportation and consider the example of cellular motility. For humans, motility is energetically expensive. The U.S. Food and Drug Administration recommends that we eat about 2000 kcal/d, equivalent to a power supply of ≈100 W, but Tour de France cyclists consume 5000–6000 kcal/d and average >400 W while riding (BNID 110873). During Usain Bolt's world-record 100-m dash, he accelerated from 0 to 10 m/s in ≈3 s, requiring well over 1000 W just to generate his kinetic energy (to check us, remember E = ½mv2). So when we watch videos of Escherichia coli zipping through media propelled by flagella spinning at 100 Hz or a keratocyte dragging itself around at a speed of 0.2 μm/s on its lamellipodium, it is natural to be amazed and to also assume that these processes require a large fraction of the energy available to these cells. But is that really the case? Let's try to answer this question using some measured values and a little bit of arithmetic.
For many eukaryotic cells, motility is driven primarily by dynamic actin polymerization at a steady-state cost of ≈1 ATP hydrolysis per polymerizing actin monomer (Pollard and Borisy, 2003; Dominguez and Holmes, 2011). Labeling actin famously showed that actin filaments in moving goldfish epithelial keratocytes polymerize at the same rate that the cell moves, ≈0.2 μm/s at room temperature (Theriot and Mitchison, 1991; Ream et al., 2003). There are two actin monomers for each ≈5 nm of filament (Pollard and Borisy, 2003; Figure 1), so as the multiplications depicted in Figure 2 tell us, each filament must grow by ≈100 monomers/s to support motility, which costs ∼100 ATP per polymerizing filament per second.
However, how many actin filaments are required to move a cell? As shown in Figure 2, the leading edge of a goldfish keratocyte lamellipodium is ≈20 μm long and contains ∼200 actin filaments/μm of length, or ≈4000 filaments in total (Abraham et al., 1999). If actin polymerizes primarily at the leading edge of the lamellipodium (Pantaloni, 2001), then our keratocyte must burn ≈4000 × 100 = 4 × 10⁵ ATP/s to power its movement (Figure 2).
FIGURE 2:
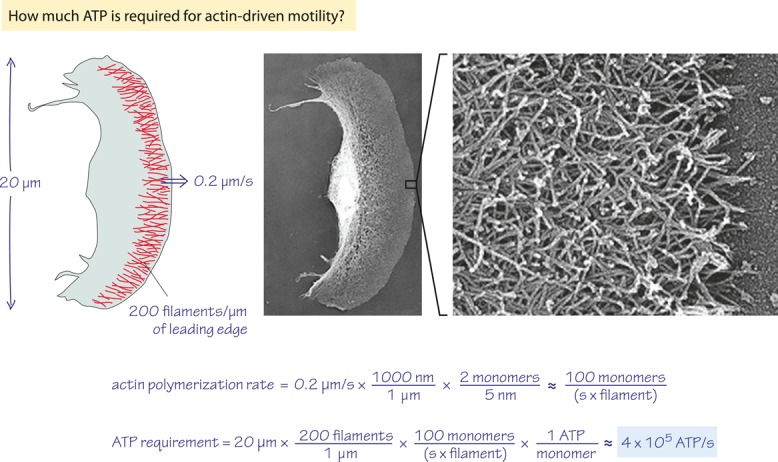
Back-of-the-envelope calculation of the ATP demand for motility of a cell. Actin filaments criss-cross the leading edge of a motile keratocyte, and their dynamic polymerization results in a net forward motion with a speed of 0.2 μm/s. (Electron micrographs adapted from Svitkina et al., 1997.)
Although 105–106 ATP/s sounds like a lot, it is hard to tell off the bat. We can get a feel for how much energy this really is by comparing it to another process in which cells heavily invest their energy resources: protein synthesis from amino acids. There are (2–4) × 106 proteins in 1 μm3 of a cell (Milo, 2013), and the average protein is 300–400 amino acids (aa) long, yielding ≈109 aa/μm3. It requires ≈4 ATP equivalents to add an amino acid to a nascent polypeptide chain (BNID 101442). A typical goldfish keratocyte cell volume is ≈500 μm3 (BNID 110905) and thus requires 500 μm3 × 109 aa/μm3 × 4 ATP/aa ≈ 2 × 10¹² ATP just to synthesize its proteins from amino acids. Taking the average half-life of a protein to be about 1 day (Cambridge et al., 2011), we find that the cell must duplicate its proteome once every 24 h ≈ 105 s, thereby consuming ≈2 × 10⁷ ATP/s—almost 100-fold more than we estimated is required for motility.
The foregoing calculation is highly simplified, but you can do it on a bar napkin in 20 min. The simplifications might bias our result by a factor of 2 or 5, but we do not mind: we're trying to get an order-of-magnitude estimate here, and only a factor of 10–100 mistake would make us doubt our conclusion. To bolster our confidence in these sorts of calculations, it is good to use several different calculation strategies and check that we get consistent results. So we ask the concrete question, How much ATP do motile metazoan cells typically generate? Certainly it depends, but we will describe two ways of reaching a ballpark estimate: a physiological approach considering energy production of a whole human body, and a cellular approach using microscopic measurements of cellular metabolism. A human at rest breathes in ≈6 liters of air per minute, containing ≈20% oxygen. The gas that we exhale contains ≈15% oxygen. Thus we consume ≈0.3 liter of oxygen/min (Burton, 2000). Our cells make ≈30 ATPs for every 6 O2 consumed during respiratory metabolism of glucose (or ≈5 ATPs per O2; BNID 101778). Because there are ∼1013 cells in the human body (excluding the abundant red blood cells, which ferment sugars; BNID 109716), we can calculate the average ATP consumption per cell from the density of oxygen as follows:
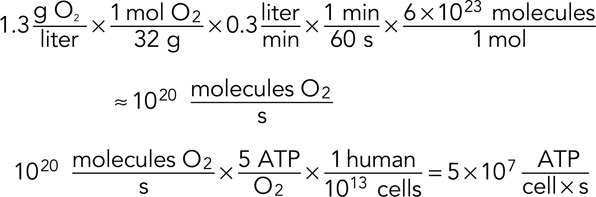 |
So the average cell in the human body produces ∼107–108 ATP/s, roughly consistent with the estimate of the energetic cost of protein turnover and several orders of magnitude more energy than we estimated that keratocyte motility requires.
Fortunately, recent measurements of metabolic fluxes in active human fibroblasts allow us to check ourselves a second time. These consistency checks are a critical part of quantitative biologists' toolkit as they test whether different estimates are compatible. Human fibroblasts were measured to consume ≈1 nmol glucose per μg protein per hour (Lemons et al., 2010). Protein is ≈10% of the wet weight of a human cell (BNID 109576, 110723), and so, using a characteristic cell mass of 3 ng (BNID 103720, 108979), we estimate that a single fibroblast contains ≈0.3 ng = 3 × 10⁻⁴ μg of protein. From the flux measurements, it appears that fibroblasts metabolize about one-half of their glucose uptake aerobically (producing ≈30 ATP/glucose) and the other one-half fermentatively (producing lactate and 2 ATP/glucose; BNID 103351), giving a net ATP yield of ≈16 ATP/glucose. As such, we can calculate a cellular ATP production rate of
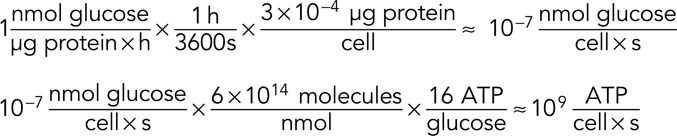 |
which is three to four orders of magnitude more ATP than we estimated was required for actin dynamics to drive keratocyte motility.
These brief calculations suggest that our human-scale intuition that motility is energetically costly fails at the molecular scale, much in the same way that our human-scale intuition that swimmers have momentum fails in low–Reynolds number environments like those experienced by cells in liquid media (Purcell, 1977). Having made the effort to calculate the energetic cost of eukaryotic motility, we have refined our understanding of the energy budget of cells. We are also left with a number of motivating unanswered questions. Why do our physiological and cellular estimates of ATP production differ by more than an order of magnitude? Perhaps human foreskin fibroblasts are much more metabolically active than other motile cells (Katsu-Kimura et al., 2009)? Can actin polymerization far from the leading edge be neglected (Miyoshi and Watanabe, 2013)? Is it really the case that the energetic cost of motility is primarily due to actin polymerization to begin with? Perhaps motor proteins are involved and consume much more energy.
We note that these questions arise because of the calculation we performed and are sharper and more lucid because they are phrased quantitatively. We can consider each question in light of the calculation and ask, Could they change our results by a factor of 10–100 and make us reconsider our conclusion? Perhaps you think there is a much denser actin network in the lamellipodium. Or perhaps you think there are massive actin dynamics throughout the keratocyte lamellipodium. Either possibility suggests further calculations and experiments and offers the opportunity to learn something new and deep about eukaryotic cell motility. Similarly, you might wonder whether actin dynamics require a larger fraction of cellular energy in other types of cells, which may use actin for intracellular transport or cell division rather than motility (Bray, 2014). Again, we urge you to run the numbers: it is an immensely clarifying exercise. Indeed, many of the beautiful and thoughtful cartoons in textbooks and research papers can be mathematicized in this way. By doing so, we improve our understanding of the models implied by these figures and upgrade our hypotheses by formalizing their assumptions and checking each one against the best measurements available. Each time we stumble upon a number for which we cannot find a reference or that we cannot reasonably estimate, we have reached the limits of scientific understanding and found an opportunity to push that boundary.
Throughout our research, we have found that simply performing these calculations has often “endowed us with an extra sense” in our quest to understand the alien world of cells—pointing out a flawed assumption or suggesting a particularly informative and fun experiment. In the process, we have combed the literature and made many biological numbers available through BioNumbers and other resources (Phillips and Milo, 2009; Milo et al., 2010; Moran et al., 2010; Bar-Even et al., 2011; Flamholz et al., 2011). What we mean to say is this: the cellular census is already underway, and lots of numbers are already available. Biological numeracy requires only a pen, a piece of paper, and an hour away from your bench and email. Give it a try from the comfort of your home or during a boring lecture. It may just yield surprising new insights about your favorite cells and organisms. A collection of our favorite back-of-the-envelope calculations is available as Cell Biology by the Numbers (book.bionumbers.org)—we would love to add yours.
Acknowledgments
We thank Niv Antonovsky, Caleb Cassidy-Amstutz, Dan Davidi, Arren Bar-Even, David Drubin, Eric Estrin, Daniel Fletcher, Shmuel Gleizer, Bruce Goode, Rachel Hood, Jennifer Lippincott-Schwartz, Elad Noor, Ben Oakes, Ross Pedersen, Jeremy Roop, Alex Rubinsteyn, Alvaro Sanchez, and Julie Theriot for discussions and comments that were vital in helping us communicate the value of biological numeracy. We also thank David Goodsell for help in preparing Figure 1 and Nigel Orme for Figure 2.
Footnotes
REFERENCES
- Abraham VC, Krishnamurthi V, Taylor DL, Lanni F. The actin-based nanomachine at the leading edge of migrating cells. Biophys J. 1999;77:1721–1732. doi: 10.1016/S0006-3495(99)77018-9. [DOI] [PMC free article] [PubMed] [Google Scholar]
- Bar-Even A, Noor E, Savir Y, Liebermeister W, Davidi D, Tawfik DS, Milo R. The moderately efficient enzyme: evolutionary and physicochemical trends shaping enzyme parameters. Biochemistry. 2011;50:4402–4410. doi: 10.1021/bi2002289. [DOI] [PubMed] [Google Scholar]
- Bray D. Intrinsic activity in cells and the brain. Mol Biol Cell. 2014;25:737–738. doi: 10.1091/mbc.E13-12-0754. [DOI] [PMC free article] [PubMed] [Google Scholar]
- Burton RF. Physiology by Numbers: An Encouragement to Quantitative Thinking. Cambridge, UK: Cambridge University Press; 2000. [Google Scholar]
- Cambridge SB, Gnad F, Nguyen C, Bermejo JL, Kruger M, Mann M. Systems-wide proteomic analysis in mammalian cells reveals conserved, functional protein turnover. J Proteome Res. 2011;10:5275–5284. doi: 10.1021/pr101183k. [DOI] [PubMed] [Google Scholar]
- Davis SJ, van der Merwe PA. The kinetic-segregation model: TCR triggering and beyond. Nat Immunol. 2006;7:803–809. doi: 10.1038/ni1369. [DOI] [PubMed] [Google Scholar]
- Dominguez R, Holmes KC. Actin structure and function. Annu Rev Biophys. 2011;40:169–186. doi: 10.1146/annurev-biophys-042910-155359. [DOI] [PMC free article] [PubMed] [Google Scholar]
- Flamholz A, Noor E, Bar-Even A, Milo R. eQuilibrator—the biochemical thermodynamics calculator. Nucleic Acids Res. 2011;40:1–6. doi: 10.1093/nar/gkr874. [DOI] [PMC free article] [PubMed] [Google Scholar]
- James JR, Vale RD. Biophysical mechanism of T-cell receptor triggering in a reconstituted system. Nature. 2012;487:64–69. doi: 10.1038/nature11220. [DOI] [PMC free article] [PubMed] [Google Scholar]
- Katsu-Kimura Y, Nakaya F, Baba SA, Mogami Y. Substantial energy expenditure for locomotion in ciliates verified by means of simultaneous measurement of oxygen consumption rate and swimming speed. J Exp Biol. 2009;212:1819–1824. doi: 10.1242/jeb.028894. [DOI] [PubMed] [Google Scholar]
- Lemons JMS, Feng X-J, Bennett BD, Legesse-Miller A, Johnson EL, Raitman I, Pollina EA, Rabitz HA, Rabinowitz JD, Coller HA. Quiescent fibroblasts exhibit high metabolic activity. PLoS Biol. 2010;8:e1000514. doi: 10.1371/journal.pbio.1000514. [DOI] [PMC free article] [PubMed] [Google Scholar]
- Milo R. What is the total number of protein molecules per cell volume? A call to rethink some published values. Bioessays. 2013;35:1050–1055. doi: 10.1002/bies.201300066. [DOI] [PMC free article] [PubMed] [Google Scholar]
- Milo R, Jorgensen P, Moran U, Weber G, Springer M. BioNumbers—the database of key numbers in molecular and cell biology. Nucleic Acids Res. 2010;38:D750–D753. doi: 10.1093/nar/gkp889. [DOI] [PMC free article] [PubMed] [Google Scholar]
- Miyoshi T, Watanabe N. Can filament treadmilling alone account for the F-actin turnover in lamellipodia. Cytoskeleton. 2013;70:179–190. doi: 10.1002/cm.21098. [DOI] [PubMed] [Google Scholar]
- Moran U, Phillips R, Milo R. SnapShot: key numbers in biology. Cell. 2010;141:1262–1262.e1. doi: 10.1016/j.cell.2010.06.019. [DOI] [PubMed] [Google Scholar]
- Pantaloni D. Mechanism of actin-based motility. Science. 2001;292:1502–1506. doi: 10.1126/science.1059975. [DOI] [PubMed] [Google Scholar]
- Phillips R, Milo R. A feeling for the numbers in biology. Proc Natl Acad Sci USA. 2009;106:21465–21471. doi: 10.1073/pnas.0907732106. [DOI] [PMC free article] [PubMed] [Google Scholar]
- Pollard TD, Borisy GG. Cellular motility driven by assembly and disassembly of actin filaments. Cell. 2003;112:453–465. doi: 10.1016/s0092-8674(03)00120-x. [DOI] [PubMed] [Google Scholar]
- Purcell EM. Life at low Reynolds number. Am J Phys. 1977;45:3–11. [Google Scholar]
- Ream RA, Theriot JA, Somero GN. Influences of thermal acclimation and acute temperature change on the motility of epithelial wound-healing cells. (keratocytes) of tropical, temperate and Antarctic fish. J Exp Biol. 2003;206:4539–4551. doi: 10.1242/jeb.00706. [DOI] [PubMed] [Google Scholar]
- Svitkina TM, Verkhovsky AB, McQuade KM, Borisy GG. Analysis of the actin-myosin II system in fish epidermal keratocytes: mechanism of cell body translocation. J Cell Biol. 1997;139:397–415. doi: 10.1083/jcb.139.2.397. [DOI] [PMC free article] [PubMed] [Google Scholar]
- Theriot JJA, Mitchison TJT. Actin microfilament dynamics in locomoting cells. Nature. 1991;352:126–131. doi: 10.1038/352126a0. [DOI] [PubMed] [Google Scholar]