

It is shown that, in addition to capping actin filaments, Aip1p and the capping protein subunit Acp2p are also involved in actin patch polarization in interphase, but not in mitosis. In contrast, Acp1p is not involved in cell polarization.
Abstract
Aip1p cooperates with actin-depolymerizing factor (ADF)/cofilin to disassemble actin filaments in vitro and in vivo, and is proposed to cap actin filament barbed ends. We address the synergies between Aip1p and the capping protein heterodimer Acp1p/Acp2p during clathrin-mediated endocytosis in fission yeast. Using quantitative microscopy and new methods we have developed for data alignment and analysis, we show that heterodimeric capping protein can replace Aip1p, but Aip1p cannot replace capping protein in endocytic patches. Our quantitative analysis reveals that the actin meshwork is organized radially and is compacted by the cross-linker fimbrin before the endocytic vesicle is released from the plasma membrane. Capping protein and Aip1p help maintain the high density of actin filaments in meshwork by keeping actin filaments close enough for cross-linking. Our experiments also reveal new cellular functions for Acp1p and Acp2p independent of their capping activity. We identified two independent pathways that control polarization of endocytic sites, one depending on acp2+ and aip1+ during interphase and the other independent of acp1+, acp2+, and aip1+ during mitosis.
INTRODUCTION
Fission yeast uses clathrin-mediated endocytosis to internalize nutrients and recycle the plasma membrane. A dynamic actin cytoskeleton is absolutely required for successful endocytic events. Indeed, a dense network of branched, cross-linked actin filaments assembles and disassembles at sites of endocytosis in ∼20 s. Although many actin-binding proteins regulate the process, neither the precise molecular mechanism of actin turnover nor the roles of actin in clathrin-coated pit elongation, vesicle scission, and vesicle movement are well understood. Experiments both in vitro (Rodal et al., 1999; Okada et al., 2002; Brieher et al., 2006) and in vivo (Okada et al., 2006; Lin et al., 2010; Okreglak and Drubin, 2010) showed that Aip1p synergizes with actin-depolymerizing factor (ADF)/cofilin to sever actin filaments and possibly to cap their barbed ends, while capping protein from many organisms, including fission yeast (Kovar et al., 2005), binds directly to barbed ends (Isenberg et al., 1980; Cooper and Sept, 2008).
Quantitative fluorescence microscopy in live fission yeast is an invaluable tool for studying molecular mechanisms of cellular processes (Wu and Pollard, 2005; Berro et al., 2010; Sirotkin et al., 2010). Thanks to specific genetic tools, genes of interest in yeast cells can be tagged with a fluorescent protein at their native loci. When cells are imaged with a calibrated spinning-disk confocal microscope, the fluorescence intensity in each pixel can be converted into absolute numbers of tagged molecules. We have developed new tools that extend the capabilities of quantitative microscopy to achieve temporal superresolution and to count the number of endocytic sites, globally and locally (Berro and Pollard, 2014). This method also allows us to estimate more accurately the net assembly rate of endocytic proteins and the displacement of endocytic patches.
In this paper, we use these tools to study the synergies between Aip1p and heterodimeric capping protein for capping barbed ends of actin filaments during clathrin-mediated endocytosis. Analysis of correlations between patch movements and the amount of actin showed that the actin meshwork is heavily cross-linked during patch assembly and only passively involved in vesicle motility. Serendipitously, we also found new functions for both capping protein subunits in cell polarity and identified two different cell cycle–dependent polarization pathways.
RESULTS
We used quantitative fluorescence microscopy (Wu and Pollard, 2005) to follow the assembly and disassembly of proteins in actin patches of wild-type and mutant fission yeast cells. Fimbrin (Fim1p), the subunits of heterodimeric capping protein (Acp1p and Acp2p), and actin-interacting protein Aip1p were tagged in their native genomic loci on either the N-termini or C-termini with monomeric enhanced green fluorescent protein (mEGFP). Because Schizosaccharomyces pombe cannot survive with mEGFP-actin as its sole source of actin (Wu and Pollard, 2005; Wu et al., 2006), mEGFP-actin was expressed from the 41xnmt promoter in the leu1 locus along with wild-type actin expressed from the native locus. mEGFP-actin represented 5% of total actin, assuming actin reached the same peak numbers in patches as in Sirotkin et al. (2010).
We used the temporal superresolution method (Berro and Pollard, 2014) to align the temporal evolution of the numbers of molecules in samples of individual patches from each strain (Figure 1A). This method improved the time resolution of the averaged data and reduced the artificial variability created by discrete alignment of data collected at time intervals of 1 s. We realigned the averaged data sets using two-color data with Fim1p-mCherry as the reference (Supplemental Figures S1 and S2 and Supplemental Tables S4 and S5). Using this objective internal standard was essential, because mEGFP-Aip1p arrives after patches start moving (the temporal benchmark used previously). It also allowed for meaningful calculations of molar ratios (Figure 1B) and displacements (Figure 1C).
FIGURE 1:
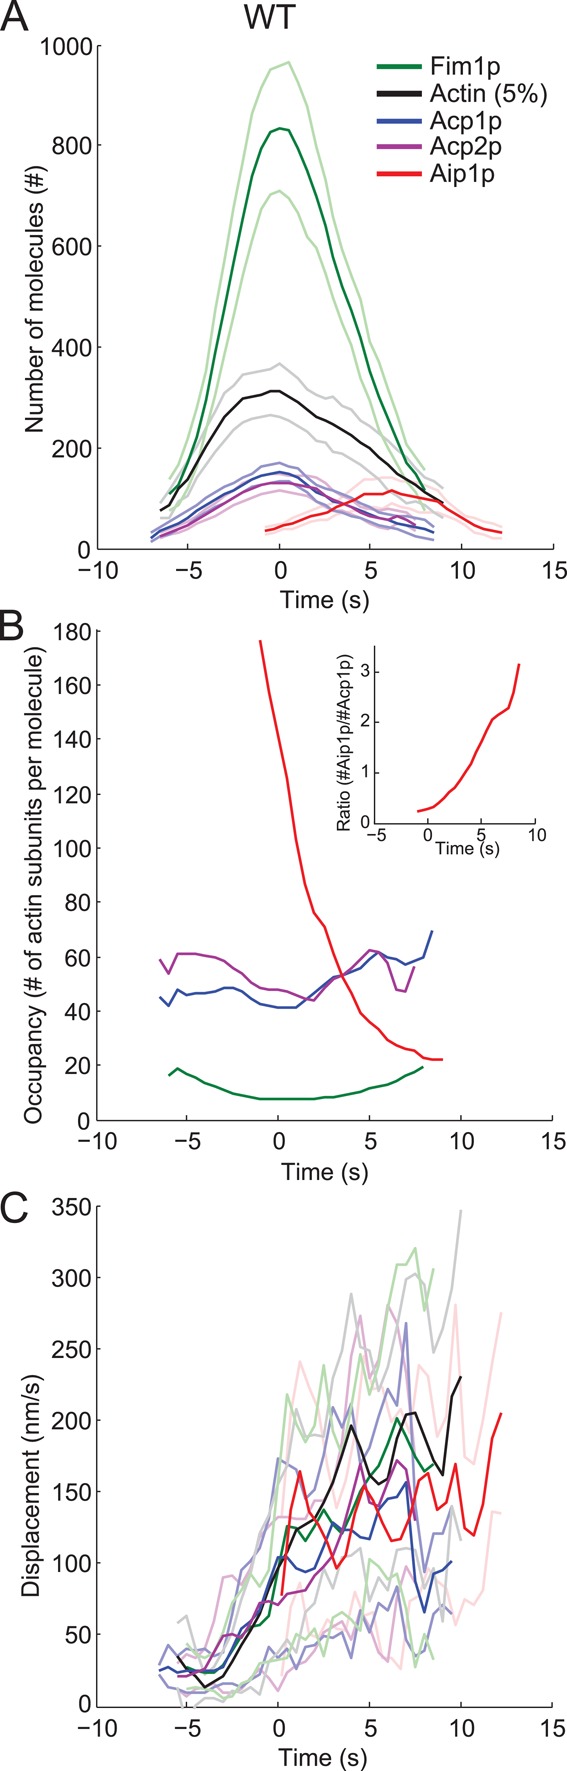
Time course of protein appearance, disappearance, and movements in actin patches. Time zero corresponds to the peak of actin and the onset of movements. Dark lines are the average values over time; light lines are ± 1 SD of the means. Color code: green, Fim1p-mEGFP; black, mEGFP-actin; blue, capping protein subunit Acp1p-mEGFP; purple, capping protein subunit Acp2p-mEGFP; and red, mEGFP-Aip1p. Data sets were aligned according to the two-color data in Figures S1 and S2. (A) Numbers of molecules over time. Fim1p, Acp1p, Acp2p, and Aip1p were tagged in the genome, so the numbers are the total numbers of each protein in patches. mEGFP-actin was expressed from the leu1 locus under the control of the 41xnmt promoter and represents 5% of the total actin. (B) Occupancy of endocytic proteins on actin filaments. The occupancy was calculated as the ratio between the numbers of actin subunits (number of mEGFP-Act1p/5%) and Fim1p-mEGFP, Acp1p-mEGFP, Acp2p-mEGFP, or mEGFP-Aip1p measured in A. (B) Inset, ratio between the numbers of mEGFP-Aip1p and Acp1p-mEGFP. (C) Average displacements over 1-s intervals of patches marked by each tagged protein.
Actin, fimbrin, capping protein, and Aip1p have unique time courses in actin patches
Two-color movies of wild-type cells (Figures S1, A–K, and S2) established that actin patches accumulated peak numbers of actin, fimbrin, and capping protein at the same time point (defined as time zero), which also corresponds to the onset of their movement. Throughout the lifetimes of endocytic patches, the ratio of actin to capping protein molecules remained constant between 40 and 60 (Figure 1B). The density of fimbrin on actin filaments increased threefold during the assembly phase and became maximal when actin peaked (from 20 to 7 actin subunits per fimbrin), before diminishing during the disassembly phase.
In contrast to capping protein and fimbrin, Aip1p accumulated in patches as they disassembled and moved (Figure 1A). The timing was consistent with observations in budding yeast (Lin et al., 2010; Okreglak and Drubin, 2010), but actin patches accumulated more Aip1p in fission yeast (114 ± 13 [mean ±95% confidence interval] molecules at peak) than budding yeast (45 ± 7 [mean ±95% confidence interval] molecules at peak) (Lin et al., 2010). By time +4 s the density of Aip1p on actin patch filaments exceeded capping protein and later approached 1 per 22 actin subunits.
Patches started moving at time zero and their displacements over 1-s intervals increased to ∼0.12 μm/s as each marker protein dissociated (Figure 1C). Superimposition of the average displacements and SDs for all proteins showed that patch-to-patch variability was small for all proteins and that our temporal superresolution alignment methods for one- and two-color data sets are robust.
Aip1 deletion shifts the peak of capping protein to the disassembly phase
If Aip1p caps the barbed ends of actin filaments as proposed by Okada et al. (2002), capping protein Acp1p/Acp2p might compensate for the loss of Aip1p. Indeed, in the aip1∆ deletion strain, endocytic patches accumulated ∼50% more capping protein (from 152 ± 17 SD to 223 ± 36 SD Acp1p-mEGFP molecules) and 35% more actin (from 6271 ± 1049 SD to 8438 ± 1261 SD molecules) (Figure 2A and Table 1). Strikingly, the peaks of both Acp1p and Acp2p shifted ∼4 s to the actin disassembly phase (Figures 2, A and B, S1, and S2), whereas both capping protein subunits peaked at the same time as actin in wild-type cells (Figures 1A, 2B, S1, and S2). The number of molecules of capping protein in aip1Δ cells mirrored the sum of the number of molecules of capping and Aip1p in wild type but on a slightly different timescale (Figure 2A, teal dashed line). These data are consistent with the hypothesis that capping protein replaces Aip1p during disassembly of actin in aip1Δ mutants. This hypothesis is further supported by equal net rates of actin assembly and disassembly in patches of wild-type and aip1Δ cells (Figure 2D), because these rates suggest that the number of free barbed ends is the same in both strains.
FIGURE 2:
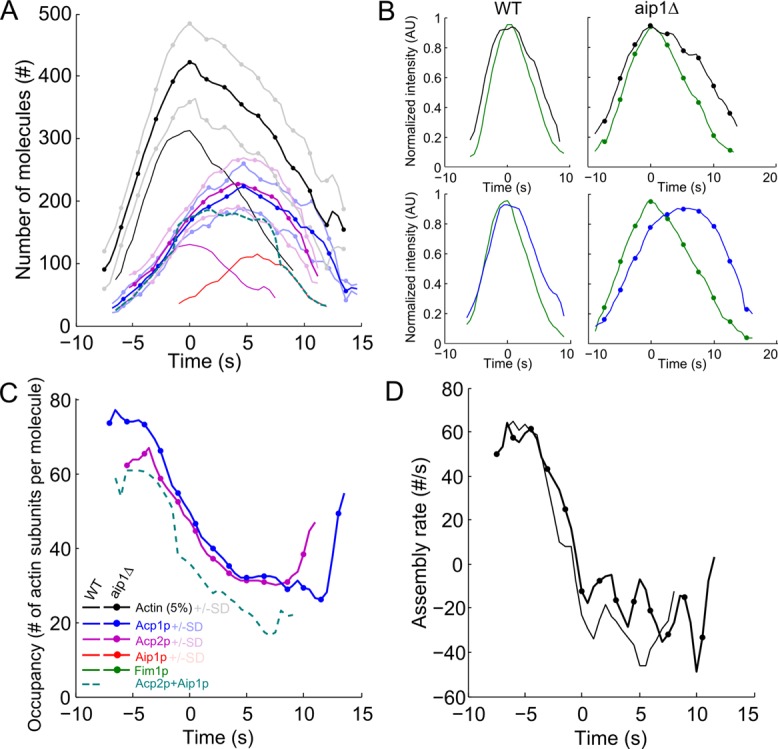
Synergy between capping protein and Aip1p in actin patches revealed by deletions of each protein. Symbols and lines: dark lines are average values; light lines are ± 1 SD of the mean values; plain lines, wild-type cells (same as Figure 1A); (●) aip1∆ cells. Color code: black, mEGFP-actin; blue, capping protein subunit Acp1p-mEGFP; purple, capping protein subunit Acp2p-mEGFP; red, mEGFP-Aip1p; green, fimbrin Fim1p-mEGFP; and teal, sum of Acp2p and Aip1p. Time zero is the peak of actin. Data sets were aligned in time using Fim1p-mCherry according to the two-color data in Figures S1 and S2. (A) Numbers of tagged molecules over time in endocytic patches of wild-type and aip1∆ strains. (B) Normalized intensities over time of actin (first row) and capping protein subunit Acp1p (second row) relative to fimbrin in (first column) wild-type cells and (second column) aip1Δ deletion mutant (see Figures S2 and S5 for delay measurements and statistical analysis). (C) Fimbrin occupancy of filaments in wild-type cells over time (ratio of mEGFP-Act1p/5% to Acp1p-mEGFP or Acp2p-mEGFP molecules measured in A). The teal dashed line is the ratio between the number of actin subunits and the sum of Acp2p and Aip1p molecules in wild-type cells. (D) Net actin assembly rates in patches of (plain line) wild-type and (●) aip1∆ strains.
TABLE 1:
Peak number of molecules of Act1p, Fim1p, Acp1p, Acp2p, and Aip1p in endocytic patches in wild-type, acp1Δ, acp2Δ, aip1pΔ, acp1Δ/acp2Δ, or acp1Δ/aip1Δ.
| Peak numbers of molecules per actin patch | ||||||
|---|---|---|---|---|---|---|
| Protein | Strain | Mean | SD | Relative SD (%) | Number of patches analyzed | Confidence interval at 95% |
| Actin | WTa | 6271 | 1049 | 17 | 36 | 355 |
| acp1Δ | 14,786 | 2057 | 14 | 21 | 934 | |
| acp2Δ | 14,035 | 3116 | 22 | 16 | 1652 | |
| aip1Δ | 8438 | 1261 | 15 | 21 | 572 | |
| acp1Δ/acp2Δ | 9042 | 1317 | 15 | 13 | 789 | |
| acp1Δ/aip1Δ | 9333 | 1736 | 19 | 21 | 788 | |
| Fim1p | WT | 833 | 125 | 15 | 24 | 53 |
| acp1Δ | 885 | 62 | 7 | 12 | 39 | |
| acp2Δ | 631 | 97 | 15 | 17 | 50 | |
| aip1Δ | 765 | 108 | 14 | 27 | 43 | |
| acp1Δ/acp2Δ | 641 | 44 | 7 | 28 | 17 | |
| acp1Δ/aip1Δ | 691 | 150 | 22 | 18 | 74 | |
| Acp1p | WT | 152 | 17 | 11 | 24 | 7 |
| aip1Δ | 223 | 36 | 16 | 19 | 17 | |
| Acp2p | WT | 130 | 17 | 13 | 21 | 7 |
| aip1Δ | 228 | 42 | 18 | 19 | 20 | |
| Aip1p | WT | 114 | 25 | 22 | 17 | 13 |
| acp1Δ | 115 | 20 | 18 | 18 | 10 | |
| acp2Δ | 100 | 17 | 17 | 16 | 9 | |
| acp1Δ/acp2Δ | 88 | 12 | 14 | 18 | 6 | |
The relative SD is the ratio between the SD and the mean. See Tables S1A and S2 for number of data sets and statistical analysis.
aWT, wild type.
Although the ratio between actin and capping protein was roughly constant throughout the lifetime of wild-type patches (Figure 1B), the ratio decreased steadily over time in aip1Δ cells from around 70 to 30 before increasing slightly at the very end (Figure 2C). However, the density of capping protein per actin in aip1Δ cells was similar to the density of the sum of Aip1p and capping protein in wild-type cells (Figure 2B, teal dashed line), again consistent with heterodimeric capping protein replacing Aip1p in aip1Δ mutants.
Deletion of capping protein subunits impacts actin dynamics more than Aip1p dynamics in endocytic patches
Deletion of the genes for either capping protein subunit eliminated the accumulation of the other capping protein subunit in patches (Figure 3A), so the barbed ends of actin filaments were not capped independently by either subunit of heterodimeric capping protein. These results are consistent with the idea that both Acp1p and Acp2p are necessary to form an active heterodimeric protein (Yamashita et al., 2003) that caps barbed ends of actin filaments in vitro (Isenberg et al., 1980; Wear et al., 2003; Yamashita et al., 2003; Kim et al., 2010) and in vivo (Hug et al., 1995; Kovar et al., 2005).
FIGURE 3:

Effects of deletions of acp1+ and/or acp2+ on the accumulation, disappearance, and movements of actin, fimbrin, and Aip1p in endocytic patches. (A) Localization of capping protein subunits in the absence of the other subunit. Negative-contrast fluorescence micrographs of representative cells expressing Acp1p-mEGFP in wild-type and acp2Δ cells (left column) or Acp2p-mEGFP in wild-type and acp1Δ cells (right column). Scale bar: 5 μm. (B–E) Time zero corresponds to the peak of actin. Color code: black, mEGFP-actin; red, mEGFP-Aip1p. Symbols and lines: dark lines are average values; light lines are ± 1 SD of the mean values; plain lines, wild-type cells (same as Figure 1A); +, acp1∆ cells; x, acp2∆ cells; and ◻, double mutant acp1∆/acp2∆ cells. Data sets were aligned according to the two-color data in Figures S1 and S2. (B) Actin net assembly rates in patches of wild-type, acp1∆, acp2∆, and acp1∆/acp2∆ cells. (C–E) Comparisons of the numbers of molecules over time in endocytic patches of wild-type cells with (C) acp1∆ cells, (D) acp2∆ cells, and (E) double mutant acp1∆/acp2∆ cells.
Deletion of acp1+ or acp2+ dramatically increased (∼2.3-fold) the peak amount of mEGFP-actin in endocytic patches (Figure 3, C and D, and Table 1) in spite of similar cytoplasmic concentrations of mEGFP-actin (Figure S3B). Actin assembled and disassembled at similar rates in patches of wild-type cells and both strains lacking a single capping protein subunit (Figure 3B): maximum assembly rates were ∼60 subunits of mEGFP-actin/s per patch (corresponding to ∼1200 total actin subunits/s) and minimum rates were ∼−40 subunits of mEGFP-actin/s (∼800 total actin subunits/s). However, mEGFP-actin accumulated for twice as long without capping protein accounting for the high peak numbers of actin (Figures 3, C and D, and S4). The loss of actin-mEGFP from patches took 1.5-fold longer without capping protein. This surprising result indicated that capping protein has a stronger influence on the timing than the rate of actin filament assembly.
In contrast, deletion of either acp1+ or acp2+ had only a minor effect on the amount of Aip1p assembled in patches, which was reduced by <10% relative to wild-type cells (Figure 3, C–E). Thus Aip1p did not simply replace capping protein Acp1p/Acp2p when it is missing in cells.
Deletion of acp1+, acp2+, or both has quantitatively different effects on patch dynamics
Although the only documented function of Acp1p and Acp2p is to form a heterodimer to cap filaments, deletion of both genes increased the numbers of actins in patches less than deletion of either acp1+ or acp2+ (Figure 3, C–E, and Table 1). Assembly of actin in endocytic patches was prolonged in all three mutants, but the initial assembly rate was lower in the acp1Δ/acp2Δ strain than the single mutants and wild-type cells (Figure 3B). Furthermore, the peak of Fim1p was 25% smaller in acp2Δ and acp1Δ/acp2Δ mutants than in wild-type and acp1Δ cells (Figure 4D and Table 1). Slightly less Aip1p accumulated in acp1Δ/acp2Δ cells than wild-type and single-deletion strains (Table 1), and Aip1p accumulation took longer in acp1Δ and acp1Δ/acp2Δ (Figure 3, C and E) than in wild-type and acp2Δ cells (Figures 3D and S4). These differences reveal that acp1+ and acp2+ may have undocumented independent functions beyond forming heterodimeric capping protein.
FIGURE 4:
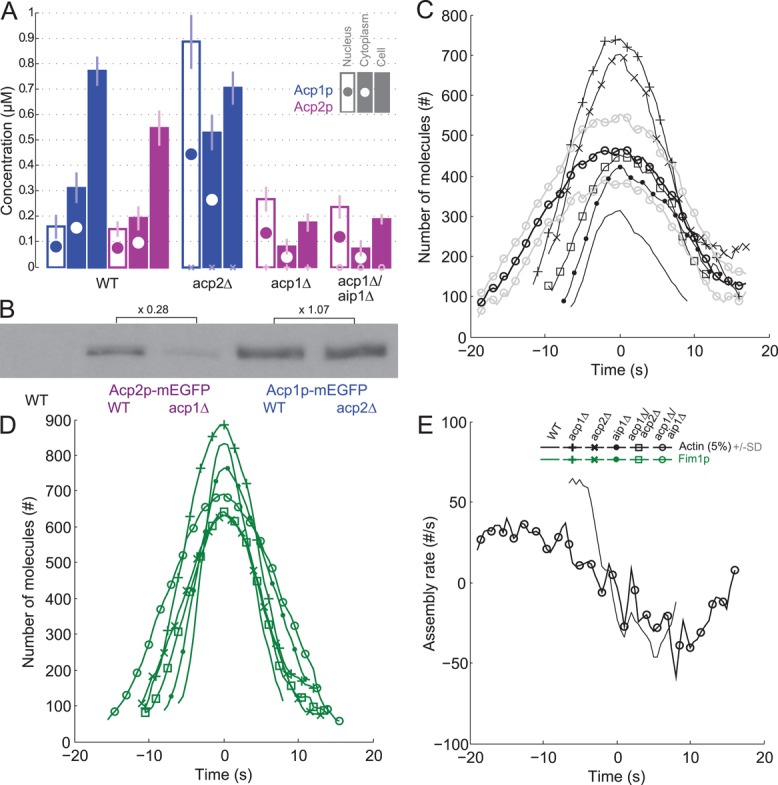
Evidence for functional differences between capping protein subunits. (A) Nuclear, cytoplasmic, and total cell concentrations of Acp1p-mEGFP and Acp2p-mEGFP in wild-type cells and single mutants acp1Δ and acp2Δ, and double mutants acp1Δ/aip1Δ. Color code: blue, Acp1p-mEGFP; purple, Acp2p-mEGFP. Empty bars with a filled circle, nuclear concentration; filled bar with an empty circle, cytoplasmic concentration; filled bar, total cell concentration. (B) Western blots with antibodies against GFP for Acp2p-mEGFP in wild-type and acp1Δ cells, and Acp1p-mEGFP in wild-type and acp2Δ cells. Intensities of the bands are proportional to total cell concentrations for comparison with the filled bars in B. Numbers represent the relative intensities of bands in corresponding mutants. (C–E) Time courses with time 0 s at the peak of actin assembly. Symbols and lines: dark lines are average values; light lines are ± 1 SD of the mean values; plain lines, wild-type cells (same as Figure 1A); +, acp1∆ cells; x, acp2∆ cells; ●, aip1∆ cells; ◻, double mutant acp1∆/acp2∆ cells; ○, double mutant acp1∆/aip1∆ cells. Color code: black, mEGFP-actin; and green, fimbrin Fim1p-mEGFP. Time zero is the peak of actin. (C) Numbers of mEGFP-actin molecules in all mutants over time. (D) Number of molecules of Fim1p-mEGFP in all mutants over time. (E) Net actin assembly rates in wild-type and acp1Δ/aip1Δ strains over time.
Furthermore, deleting each subunit had different effects on the concentrations of the other subunit in the whole cell, cytoplasm and nucleus (Figures 3A and 4, A and B). Deletion of acp2+ did not change the overall cellular concentration of Acp1p, contrary to a previous report by Kovar et al. (2005). Because the solitary Acp1p did not concentrate in endocytic patches, its concentration was 1.7 times higher in the cytoplasm and 5.6 times higher in the nucleus than in wild-type cells. Deletion of acp1+ with or without deletion of aip1+ reduced the total cellular concentration of Acp2p from 0.55 μM to 0.2 μM, and a large fraction of the remaining Acp2p concentrated in the nucleus at about twice the level found in wild-type cells.
Deletion of aip1+ is synthetically lethal with deletion of acp2+ but not acp1+
To study possible synergy of Aip1p with heterodimeric capping protein, we planned to delete aip1+ along with acp1+ and acp2+. A viable acp1∆/aip1∆ strain grew slower than single deletions of aip1+, acp1+, or acp2+. Peak numbers of mEGFP-actin (467 ± 87 SD molecules) and Fim1p-mEGFP (691 ± 150 SD molecules) in endocytic patches of acp1∆/aip1∆ cells were close to those in the aip1∆ single-deletion mutant and acp1Δ/acp2Δ double-deletion mutant (Figure 4, C and D). The maximum actin assembly rate in acp1∆/aip1∆ cells was only half that found in aip1∆ or wild-type cells but was compensated by being prolonged about twofold (Figure 4E).
On the other hand, we were unable to construct a double deletion of acp2+ and aip1+ or a triple mutant without acp1+, acp2+, and aip1+ (Table 2). We tried crossing acp2∆ and aip1∆ strains and homologous recombination to delete aip1+ in the acp2∆ strain or to delete acp2+ in the aip1∆ mutant. We also sporulated a diploid strain with deletions of both alleles of acp2+ and one allele of aip1+. Sporulation produced ascii with four normal appearing spores, two of which failed to form colonies. These inviable spores appeared to lyse before the first division. Thus deletions of acp2+ and aip1+ are synthetically lethal, whereas acp1∆/aip1∆ cells are viable. This result points out another difference between the acp1+ and acp2+ genes.
TABLE 2:
Comparison of wild-type and deletion mutant strains.
| Peak number of molecules | Localization defects of endocytic patches during | ||||||||
|---|---|---|---|---|---|---|---|---|---|
| Actin | Fim1p | Acp1p/Acp2p | Aip1p | Duration of actin peak | Timing of capping protein or Aip1p peak | Number of endocytic patches during cell cycle | Interphase | Cytokinesis | |
| acp1Δ | ++ | = | 0 | = | + | Normal | = | = | = |
| acp2Δ | ++ | − | 0 | = | + | Normal | = | + | = |
| aip1Δ | + | = | ++ | NR | + | Late | = | + | = |
| acp1Δ/acp2Δ | + | − | NR | = | + | Normal | = | + | = |
| acp1Δ/aip1Δ | + | − | 0 | NR | ++ | NR | = | ++ | = |
| acp2Δ/aip1Δ | Lethal | ||||||||
Symbols describe peak number of molecules in mutant strains relative to wild-type cells: −, slightly less than wild-type cells; =, same as wild-type cells; +, slightly more than wild-type cells; ++, substantially more than wild-type cells; 0, absence of localization to patches; and NR, not relevant. Symbols describing patch lifetimes in mutant strains relative to wild-type: +, slightly longer lifetime; ++, substantially longer lifetime. Duration of actin peak compared with wild-type cells: +, slightly longer; ++, significantly longer. Timing of the peaks of capping protein (in aip1Δ) or Aip1p (in acp1Δ, acp2Δ, or acp1Δ/acp2Δ) relative to wild-type cells after correction for longer patch lifetime: normal, late, or not relevant (NR). The number of endocytic patches during cell cycle was the same (= ) as wild-type cells for all strains. Symbols for the localization of endocytic patches in interphase and cytokinesis: =, no defect; +, mild defects; or ++, severe defects.
Insights into the structure of actin patches from quantitative analysis of movements in capping protein mutants
In all mutant and wild-type cells, endocytic patches were stationary at the membrane until the peak of actin accumulation at time zero and then moved in the cytoplasm with continuous changes in direction and displacement (Figure 5, A and B). Our alignment method made it possible to extract average displacements of patches over time (Figure 5B). In all mutants, the average displacement increased with time, but displacement increased more slowly and reached lower maximum rates than in wild-type cells. These defects were slightly more severe in double mutants acp1Δ/acp2Δ and acp1Δ/aip1Δ.
FIGURE 5:

Insights regarding the structure of endocytic patches by analysis of their motions in wild-type and mutant cells. (A) Samples of tracks of patches marked with Fim1p-mEGFP in wild-type, single-deletion mutant strains acp1∆, acp2∆, and aip1∆, and double-deletion mutant strains acp1∆/acp2∆ and acp1∆/aip1∆. The points are positions at 1-s intervals connected by lines, both color-coded in time from blue (appearance of Fim1p-mEGFP) to red (disappearance of Fim1p-mEGFP). The number of points varies with the lifetime of the patch. The gray dotted line is drawn parallel to the plasma membrane to mark the initial positions of patches. Scale bar: 200 nm. (B–E) Evolution of patch parameters over time. Symbols and lines for cell types: black plain lines, wild-type; mustard +, acp1∆; olive x, acp2∆; teal ●, aip1∆; purple ◻, double mutant acp1∆/acp2∆; brown ○, acp1∆/aip1∆. (B) Average displacements over 1 s of patches estimated from mEGFP-Act1p movies. Inset, normalized efficiency plots of the numbers of actin molecules per patch (normalized to the peak value) vs. displacement of the patch. (C) Estimated Stokes' radii of moving endocytic patches extracted from the data in B. Inset, detailed view at late time points. (D) Occupancy of fimbrin on actin filaments. The occupancy was calculated as the ratio between the numbers of actin (mEGFP-Act1p/5%, Figure 4C) and Fim1p-mEGFP (Figure 4D). The schematics show the density of cross-linking in wild-type cells at −8 s and 0 s based on data from this panel and Figures 1B and 2C. (E) Average volumetric densities of actin in moving patches calculated as the ratio between the number of actin molecules (mEGFP-Act1p/5%, Figure 4C) and the volume of a sphere of the Stokes' radius (C) minus the volume of the spherical vesicle with radius of 25 nm. Inset, average radial densities of five endocytic proteins in patches of wild-type cells. Color code: black, Act1p; green, Fim1p; blue, Acp1p; purple, Acp2p; and red, Aip1p. The radial density is calculated as the ratio between the number of molecules and the Stokes' radius at each time t. The schematics are density profiles of actin in wild-type patches at three points in time based on the data in this panel and inset with the assumption that the filaments grow radially around vesicles. The blue lines illustrate how peripheral disassembly of a radially grown meshwork decreases the average distance between molecules in the meshwork, subsequently increasing its volumetric density without changing its radial density.
The diffusive nature of patch movements allowed us to calculate the apparent Stokes' radii of patches from their mean displacement over 1 s at each time point (Berro and Pollard, 2014; Figure 5C). At the onset of movement, the apparent radii of patches were much larger in all mutant strains than in wild-type cells (Figure 5C). The apparent Stokes' radii of patches declined over time, converging toward the radius of a naked vesicle (Figure 5C, inset), but this process took much longer in strains lacking one or both subunits of capping protein than in wild-type cells. Note that the radii calculated at the end of the disassembly phase were noisy, owing to poor signal to noise due to the small number of molecules.
Calculation of the density of the actin meshwork from the actin content and Stokes' radius of the patch provided insights about the evolution of the structure (Figure 5E). When movement started, the volumetric actin density around a vesicle in wild-type cells was higher by approximately two orders of magnitude than in single-deletion mutants (acp1Δ, acp2Δ, aip1Δ) and by three orders of magnitude than in double-deletion mutants (acp1Δ/acp2Δ, acp1Δ/aip1Δ) (Figure 5E). The density of actin increased as it disassembled in all strains tested. However, the average radial density (the average number of molecules in nanometer-thin shells across the patch) of actin, capping protein, Aip1p, and fimbrin in patches did not change over time in wild-type (Figure 5E, inset) or mutant (Figure S6) cells. One explanation is that the actin meshwork grows radially around the clathrin-coated pit with the actin filament barbed ends oriented toward the membrane and the oldest filaments at the periphery, where they disassemble (schematic in Figure 5E). This arrangement of filaments creates a volumetric gradient of actin density while keeping the radial density constant. The average volumetric density of such actin meshwork decreases during disassembly (schematic in Figure 5E).
The ratio of actin to fimbrin molecules informed us about the potential for cross-linking the actin filaments (Figure 5D). In patches of wild-type and mutant cells, the ratio of fimbrin to actin increased during the assembly of actin, peaked with the numbers of actin and fimbrin roughly as patches started moving, and decreased as patches disassembled. In wild-type cells, the ratio of fimbrin to actin increased about threefold to one fimbrin per seven actin subunits on average at time 0 s (Figure 5D). The ratio of fimbrin to actin was lower throughout patch lifetimes in capping protein and Aip1p mutants (Figure 5D), as was to be expected due to filaments growing longer and being too widely separated to be cross-linked.
Cells lacking Acp2p or Aip1p mislocalize actin patches during interphase but not in cytokinesis
In wild-type cells, the intracellular distribution of endocytic patches varies predictably across the cell cycle (Figure 6A; Marks and Hyams, 1985; Berro and Pollard, 2014). Just after cell division, patches concentrate at the new tip, but later concentrate at both tips. During cytokinesis, patches concentrate around the middle of the cell flanking the contractile ring.
FIGURE 6:

Endocytic patch polarization and dispersion in wild-type and mutant cells. (A) Negative-contrast fluorescence micrographs of representative cells expressing Fim1p-mEGFP in seven strains indicated at the top of each set. First row, short interphase cells; middle row, medium-sized interphase cells; third row, cells in cytokinesis. (B) Graphs of the total number of patches per cell marked with Fim1p-mEGFP vs. the cell length for the strain indicated above each panel. Each symbol corresponds to an individual cell in interphase (●) or cytokinesis (+). Lines are the best linear correlations for the data (blue, y-intercept equals 0; black, free y-intercept). The equations for these lines are given at the bottom right of each graph. (C) Distributions of endocytic patches in three equal zones along the long axis: red, tip with the larger number of patches; green, middle of the cell; blue, tip with the smaller number of patches. Darkly colored dots are the average proportion of patches in a given part of interphase cells. Lightly colored bars are ± 1 SD of these mean proportions. Lightly colored plus symbols (+) represent the distribution of patches in individual cells in cytokinesis. (D) Dispersion index OP50 (as defined in Berro and Pollard, 2014). Black dots are average values of the OP50 index in interphase cells. Gray bars are ± 1 SD of the means. Plus symbols are OP50 indices for individual cells in cytokinesis.
Throughout the cell cycle, the distribution of patches in acp1∆ cells was indistinguishable from that seen in wild-type cells (Figure 6, A, C, and D; Berro and Pollard, 2014), but deletion of acp2+ or aip1+ alone or in combination with acp1∆ altered the localization of patches in interphase cells. Patches spread over the entire cell (Figure 6A, first two rows), with only a small preference for the tips in aip1∆ and acp1∆/acp2∆ cells and only a small bias for the tips in acp2∆ and acp1∆/aip1∆ cells (Figure 6C, dots). In all these mutants, even in those cells with a bias of patches toward the tips, many patches were dispersed along the cell, as assessed by the dispersion index OP50 (Figure 6D, dots).
Strikingly, and in contrast to interphase cells, patches concentrated normally in the middle of dividing cells in all mutant strains (Figure 6, A, third row, and C, crosses). In addition, very few patches were dispersed in these cells during cytokinesis (Figure 6D, crosses). Thus mutant cells correctly relocalized their mislocalized interphase endocytic patches during mitosis. These surprising results suggest that independent mechanisms regulate patch locations during interphase and mitosis. Patch localization during interphase depends on Acp2p and Aip1p, while localization during mitosis does not depend on Acp1p, Acp2p, or Aip1p. These data are reminiscent of defects seen in mutants lacking the cable-forming formin For3p (Figure 6, A, C, and D), in which interphase but not mitotic patches were incorrectly polarized and dispersed to the same extent as mutants lacking both acp1+ and acp2+ (Figure 6, C and D). These results suggest that For3p, Acp2p, and Aip1p participate in the same polarization pathway for proper localization of endocytosis during interphase.
The number of patches is proportional to cell size in wild-type and mutant cells
In wild-type cells, the number of patches ranged from ∼80 in short cells to ∼150 for longer cells (Figure 6B), depending linearly on cell length and not influenced by the stage of the cell cycle (Berro and Pollard, 2014). Patch numbers and their dependence on the cell length were roughly the same in all the mutants in this study, with the exception of a few outliers with more patches in aip1∆, acp1∆/acp2∆, and acp1∆/aip1∆ mutants and short acp2∆ mutant cells that contained slightly fewer patches. The differences in the slopes of the plots of patch number versus cell length were minimal and came mostly from different ranges of cell lengths in the various mutants. The independence of patch number with respect to absolute cell length is quite surprising, because acp2∆, aip1∆, and acp1∆/aip1∆ mutant cells were shorter than wild-type, acp1∆, and acp1∆/acp2∆ cells.
Thus cells control the number of endocytic patches as a function of their relative size but not their absolute size, independent of the intracellular location of the patches, the lifetimes of the patches and the numbers of molecules accumulated in patches.
DISCUSSION
Synergies between Acp1p/Acp2p and Aip1p for barbed-end capping
Our quantitative analysis and previous studies (Rodal et al., 1999; Okada et al., 2006; Lin et al., 2010; Okreglak and Drubin, 2010) support the hypothesis that Aip1p synergizes with ADF/cofilin to cap the barbed ends of newly severed actin filaments in yeast endocytic patches. In wild-type cells, rather than tracking the accumulation of actin like capping protein, Aip1p accumulated in patches only as they disassembled (Figure 1A), mirroring ADF/cofilin and coronin (Lin et al., 2010; Chen and Pollard, 2013). In the absence of Aip1p, extra capping protein associated with patches during their disassembly. In fact, the temporal evolution of the number of capping proteins in patches of aip1Δ cells was very similar to the temporal evolution of the sum of capping protein and Aip1p in wild-type cells (Figure 2A).
The minor effects of capping protein deletion mutants on Aip1p dynamics may raise questions about their synergy, but they can be explained by the fact that Aip1p is not a conventional capping protein and caps only a subset of barbed ends, such as new ends created by ADF/cofilin severing of filaments. Another explanation might be the presence of a third pathway to cap filaments, as suggested recently in Saccharomyces cerevisiae for the complex Abp1p/Aim3p (Michelot et al., 2013). However, S. pombe lacks a known homologue of Aim3p and abp1+ has no genetic interaction with acp1+, acp2+, or aip1+ (Figure S5), so a hypothetical third capping protein remains to be discovered.
Elam et al. (2013) suggested that, in addition to capping, Aip1p may promote severing by ADF/cofilin by binding to the side of filaments. However, in fission yeast endocytic patches, the number of Aip1p per filament in wild-type cells, estimated conservatively as the ratio of Aip1p per capping protein (Figure 1B, inset), remained below one until time 4 s and never exceeded three. Thus the density of Aip1p on the sides of the filaments may be too low to modulate the severing activity of ADF/cofilin. In addition, this putative mechanism would simply not explain the late peak of capping protein in aip1Δ mutants.
Wild-type and capping protein mutant strains assemble and disassemble actin patches at similar rates (Figure 3B) and with similar peak numbers of Aip1p (Figure 3, C–E) from the same cytoplasmic concentrations of actin (Figure S3B), so something must adjust the disassembly rate to compensate for less capping. One mechanism to promote disassembly is that persistent elongation produces more binding sites for ADF/cofilin, resulting in severing and release of longer segments of filaments, as shown in reconstitution studies (Michelot et al., 2007; Roland et al., 2008), in which the polymerization rate and hydrolysis of bound ATP self-regulated severing and release of pieces of filaments by ADF/cofilin.
New cellular functions for Acp1p and Acp2p
Multiple unexpected observations showed an overlooked difference between the two subunits of capping protein. Deletion of acp1+ reduced the cellular concentration of its partner Acp2p, whereas deletion of acp2+ has no effect on total cellular copies of Acp1p, so its cytoplasmic concentration was twofold higher and its nuclear concentration was eightfold higher than in wild-type cells. Functionally, deletion of acp2+ but not acp1+ disrupts patch polarization during interphase (Figure 6), and Acp2p probably participates in the same polarization pathway as For3p and Aip1p. In addition, deletion of acp2+ but not acp1+ in combination with deletion of aip1+ is lethal. The interphase polarization pathway is unlikely to depend on the capping activities of Acp2p and Aip1p, because acp1Δ mutants have no defects in polarization, even though their patches assemble more actin and the level of Acp2p is lower than in wild-type cells.
These results suggest that each capping protein subunit has functions, unrelated to heterodimer formation and capping the barbed ends of actin filaments. The existence of novel functions for both capping protein subunits is consistent with different mRNA levels for both subunits in most plant tissues and with connections to the heat shock response (Wang et al., 2012). Older studies also showed differential expression of capping protein subunits in rat and human sperm (von Bülow et al., 1997; Hurst et al., 1998).
Actin participates actively in vesicle formation and passively in vesicle movements
The strong correlation between the peak of actin and the onset of patch movements in wild-type cells and in acp1Δ, acp2Δ, aip1Δ, acp1Δ/acp2Δ, and acp1Δ/aip1Δ mutants supports the hypothesis that scission of the vesicle from the tubular invagination of the plasma membrane somehow turns off actin polymerization. One possibility is that changes in membrane geometry associated with vesicle scission release F-BAR proteins such as Bzz1p and Cdc15p along with associated nucleation-promoting factors that activate Arp2/3 complex (Doherty and McMahon, 2008; Arasada and Pollard, 2011; Mooren et al., 2012; Suetsugu and Gautreau, 2012).
Endocytic patches moved much more slowly from the plasma membrane in strains lacking capping protein or Aip1. This behavior confirmed that patches move diffusively and that patch motion increases as the actin network surrounding the vesicle disassembles. Estimates of the Stokes' radii of motile patches calculated from their displacements decreased as actin disassembled in all of the mutant strains and converged toward the radius of a naked endocytic vesicle (Figure 5C).
Actin meshwork geometry, cross-linking, and force generation
Scale drawings of endocytic patches in wild-type and the mutant cells (Figure 7) summarize our current and previous (Berro et al., 2010; Sirotkin et al., 2010) quantitative microscopy measurements and electron microscopy observations (Idrissi et al., 2008, 2012; Kukulski et al., 2012). These drawings of 15-nm slices include ∼5% of the total volume of patches and are the first quantitatively correct model of endocytic patches in fission yeast.
FIGURE 7:
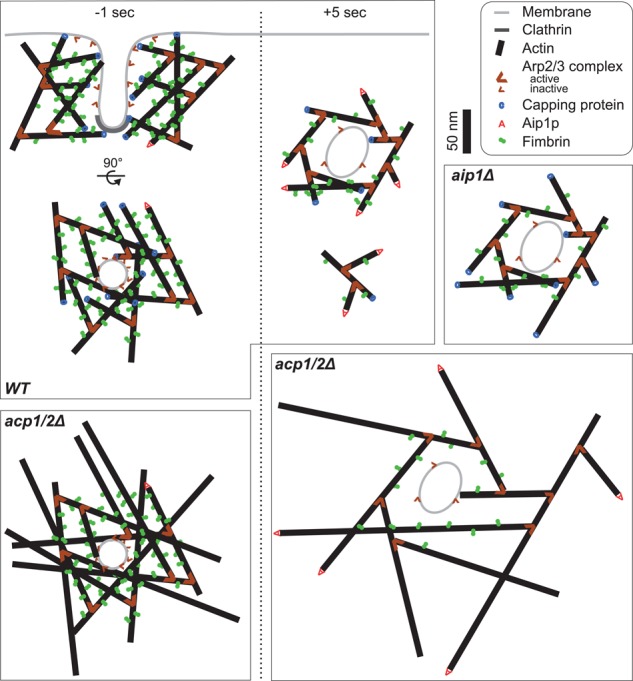
Scale drawings of 10-nm-thick sections of actin filament networks in endocytic patches of wild-type, acp1Δ, and aip1Δ strains at two time points, (left) just before scission of the clathrin-coated pit (t = −1 s) and (right) during disassembly (t = +5 s). The small actin network below the pinched-off wild-type vesicle at t = +5 s represents a part of the network released after severing by ADF/cofilin. Owing to the two-dimensional representation of the three-dimensional meshwork, some filaments cross-linked by fimbrin are not represented in this drawing. Widely spaced filaments in acp1/2Δ cells cannot be cross-linked. Color code: black line, actin filaments; light gray line, plasma membrane; dark gray, clathrin; thick brown wedges, Arp2/3 complex bound to an actin filament; thin brown wedges, inactive Arp2/3 complex; blue “C,” capping protein; red “A,” Aip1p; green connected disks, fimbrin. Actin, fimbrin, and membrane lengths and thicknesses are drawn to scale. The numbers of molecules of active and inactive Arp2/3 complex, capping protein, Aip1p, and fimbrin, and the overall length of actin filaments come from this study, Sirotkin et al. (2010), and Berro et al. (2010). The geometry of the clathrin-coated pit and the pinched-off vesicle are based on Kukulski et al. (2012).
Quantitative microscopy data also provide insights about the mechanisms of actin patch assembly and disassembly in wild-type and mutant strains. For example, assuming that both capping protein and Aip1p cap actin filament barbed ends and that the number of capped barbed ends is a conservative estimate of the number of actin filaments (Berro et al., 2010), we estimate the average length of the filaments in wild-type cells at each point in time (Figure 2C, teal dashed line) from the ratio of the numbers of actin subunits and the sum of capping protein and Aip1p. This average length decreased steadily with time from 180 nm (60 actin subunits) to 60 nm (20 subunits).
The threefold increase in the fimbrin-to-actin ratio during patch assembly may compress the actin filament meshwork. Because fimbrin spans only ∼7 nm between filaments and exchanges faster when bound to one filament than two filaments (Galkin et al., 2008; Al Tanoury et al., 2010; Skau et al., 2011), we suggest that progressive cross-linking moves the filaments closer together and compresses the meshwork over time. Around the time clathrin-coated vesicles pinch off (∼0 s), the meshwork in wild-type cells contains ∼180 filaments that are 90-nm long on average and heavily cross-linked with one fimbrin for every seven actin subunits. The density of this meshwork explains why actin patches exclude ribosomes from sites of endocytosis (Kanbe et al., 1989; Takagi et al., 2003; Kukulski et al., 2012). Actin patches in aip1Δ mutants have slightly longer filaments (Figure 2C) and a lower density of fimbrin.
Our calculations of the density of actin around the pinched-off vesicles (Figure 5, C and E) suggests that in both wild-type and mutant strains actin assembles near the membrane and disassembles radially. This geometry is consistent with nucleation of filament branches by Arp2/3 complex when activated by nucleation-promoting factors on the membrane. Elongation of barbed ends oriented toward the membrane would produce force. Our data are also consistent with uncapped filaments growing radially with their barbed ends pointing away from the membrane in acp1Δ, acp2Δ, or acp1Δ/acp2Δ mutants. These filaments would be unable to generate forces to elongate the plasma membrane, which may explain the longer assembly of the actin meshwork (Figure 4C) and slowed-down coat protein internalization (Kaksonen et al., 2005).
Radial polymerization of filaments explains why patches accumulate more actin than fimbrin, which can span only ∼7 nm between filaments (Figure 4, C and D). Thus cross-linking depends on the density of filaments, which drops off rapidly with the distance from the membrane, especially in capping protein mutants that grow excess filaments filling a large volume. A radially assembled meshwork also creates a radial gradient of mature ADP-actin filaments that bind ADF/cofilin, thus promoting severing around the periphery (Figure 5E, schematic).
MATERIALS AND METHODS
Strain construction
Acp1p, Acp2p, and Fim1p were tagged on their C-termini with mEGFP at the native loci in the genome (Bahler et al., 1998). We tagged Aip1p with a mEGFP at its N-terminus, because Aip1p does not localize to patches when tagged on its C-terminus. S. pombe cannot survive with mEGFP-Act1p as its sole source of actin (Wu and Pollard, 2005; Wu et al., 2006). Therefore we integrated into the leu1+ locus the coding sequence for mEGFP-Act1p under the control of the 41xnmt promoter (Basi et al., 1993). The amount of mEGP-Act1p in these strains represents ∼5% of the total actin of the cell. The strains used in this study are listed in the Supplemental Material.
Microscopy and data analysis
All cells were inoculated in liquid EMM5S medium and grown for at least 36 h at exponential phase (OD between 0.1 and 0.6) at 25°C. Cells were imaged in EMM5S with 100 μM antioxidant n-propyl-gallate (P-3130; Sigma-Aldrich, St. Louis, MO) to limit photobleaching and phototoxicity, on pads containing 25% gelatin in the same media. Cells were imaged with a confocal spinning-disk unit (Yokogawa CSU-X1) mounted on an Olympus IX-71 inverted microscope using an electron-multiplying charge-coupled device camera (Andor iXON 897). We used an Olympus 100×/1.4 NA Plan-Apo objective coupled with a 1.6× magnifier. Andor iQ2 software controlled the microscopy system. All our strains were imaged on five consecutive 360-nm-spaced optical sections at the bottom or in the middle of the cell every second. Depending on the strain, the exposure time for each image varied from 50 to 100 ms. Two-color movies were taken with the same protocol as single-color movies but required 1.6 s to acquire data from both channels.
Movies were then processed and analyzed using the PatchTrackingTools macro tool set (Berro and Pollard, 2014) for ImageJ (Schneider et al., 2012). Image processing allowed us to extract for each image the position and the number of molecules for individual patches (Wu and Pollard, 2005; Wu et al., 2008) or the patch density in cells (Berro and Pollard, 2014). Individual patch data were aligned with the temporal superresolution method from Berro and Pollard (2014), averaged and postprocessed with Matlab 2012a (Mathworks). Two-color data sets were aligned on the Fim1p-mCherry channel using the “temporal superresolution” method (Berro and Pollard, 2014). The number of patches analyzed and statistical analysis are shown in Tables S1A and S2 for single-color strains and in Tables S3–S5 for two-color strains. Patch densities, polarity, and dispersion indices were computed according to the methods in Berro and Pollard (2014).
Stokes' radius calculation
The Stokes' radius  was estimated from average displacement data for each mutant as
  , where
  is the Boltzmann constant,
  is the temperature in Kelvin, and
  is the viscosity of the cytoplasm. We used
  (398K) and
  (Berro and Pollard, 2014).
Supplementary Material
Abbreviations used:
- ADF
actin-depolymerizing factor
- CI
confidence interval
- EMM5S
Edinburgh minimal media 5 supplements
- mEGFP
monomeric enhanced green fluorescent protein.
Footnotes
This article was published online ahead of print in MBoC in Press (http://www.molbiolcell.org/cgi/doi/10.1091/mbc.E13-01-0005) on August 20, 2014.
REFERENCES
- Al Tanoury Z, Schaffner-Reckinger E, Halavatyi A, Hoffmann C, Moes M, Hadzic E, Catillon M, Yatskou M, Friederich E. Quantitative kinetic study of the actin-bundling protein l-plastin and of its impact on actin turn-over. PLoS One. 2010;5:e9210. doi: 10.1371/journal.pone.0009210. [DOI] [PMC free article] [PubMed] [Google Scholar]
- Arasada R, Pollard TD. Distinct roles for F-BAR proteins Cdc15p and Bzz1p in actin polymerization at sites of endocytosis in fission yeast. Curr Biol. 2011;21:1450–1459. doi: 10.1016/j.cub.2011.07.046. [DOI] [PMC free article] [PubMed] [Google Scholar]
- Bahler J, Wu JQ, Longtine MS, Shah NG, McKenzie A, III, Steever AB, Wach A, Philippsen P, Pringle JR. Heterologous modules for efficient and versatile PCR-based gene targeting in Schizosaccharomyces pombe. Yeast. 1998;14:943–951. doi: 10.1002/(SICI)1097-0061(199807)14:10<943::AID-YEA292>3.0.CO;2-Y. [DOI] [PubMed] [Google Scholar]
- Basi G, Schmid E, Maundrell K. TATA box mutations in the Schizosaccharomyces pombe nmt1 promoter affect transcription efficiency but not the transcription start point or thiamine repressibility. Gene. 1993;123:131–136. doi: 10.1016/0378-1119(93)90552-e. [DOI] [PubMed] [Google Scholar]
- Berro J, Pollard TD. Local and global analysis of endocytic patch dynamics in fission yeast using a new “temporal superresolution” realignment method. Mol Biol Cell. 2014;25:3501–3514. doi: 10.1091/mbc.E13-01-0004. [DOI] [PMC free article] [PubMed] [Google Scholar]
- Berro J, Sirotkin V, Pollard TD. Mathematical modeling of endocytic actin patch kinetics in fission yeast: disassembly requires release of actin filament fragments. Mol Biol Cell. 2010;21:2905–2915. doi: 10.1091/mbc.E10-06-0494. [DOI] [PMC free article] [PubMed] [Google Scholar]
- Brieher WM, Kueh HY, Ballif BA, Mitchison TJ. Rapid actin monomer-insensitive depolymerization of Listeria actin comet tails by cofilin, coronin, and Aip1. J Cell Biol. 2006;175:315–324. doi: 10.1083/jcb.200603149. [DOI] [PMC free article] [PubMed] [Google Scholar]
- Chen Q, Pollard TD. Actin filament severing by cofilin dismantles actin patches and produces mother filaments for new patches. Curr Biol. 2013;23:1154–1162. doi: 10.1016/j.cub.2013.05.005. [DOI] [PMC free article] [PubMed] [Google Scholar]
- Cooper JA, Sept D. New insights into mechanism and regulation of actin capping protein. Int Rev Cell Mol Biol. 2008;267:183–206. doi: 10.1016/S1937-6448(08)00604-7. [DOI] [PMC free article] [PubMed] [Google Scholar]
- Doherty GJ, McMahon HT. Mediation, modulation, and consequences of membrane-cytoskeleton interactions. Annu Rev Biophys. 2008;37:65–95. doi: 10.1146/annurev.biophys.37.032807.125912. [DOI] [PubMed] [Google Scholar]
- Elam WA, Kang H, De La Cruz EM. Competitive displacement of cofilin can promote actin filament severing. Biochem Biophys Res Commun. 2013;438:728–731. doi: 10.1016/j.bbrc.2013.07.109. [DOI] [PMC free article] [PubMed] [Google Scholar]
- Galkin VE, Orlova A, Cherepanova O, Lebart MC, Egelman EH. High-resolution cryo-EM structure of the F-actin-fimbrin/plastin ABD2 complex. Proc Natl Acad Sci USA. 2008;105:1494–1498. doi: 10.1073/pnas.0708667105. [DOI] [PMC free article] [PubMed] [Google Scholar]
- Hug C, Jay PY, Reddy I, McNally JG, Bridgman PC, Elson EL, Cooper JA. Capping protein levels influence actin assembly and cell motility in dictyostelium. Cell. 1995;81:591–600. doi: 10.1016/0092-8674(95)90080-2. [DOI] [PubMed] [Google Scholar]
- Hurst S, Howes EA, Coadwell J, Jones R. Expression of a testis-specific putative actin-capping protein associated with the developing acrosome during rat spermiogenesis. Mol Reprod Dev. 1998;49:81–91. doi: 10.1002/(SICI)1098-2795(199801)49:1<81::AID-MRD9>3.0.CO;2-K. [DOI] [PubMed] [Google Scholar]
- Idrissi FZ, Blasco A, Espinal A, Geli MI. Ultrastructural dynamics of proteins involved in endocytic budding. Proc Natl Acad Sci USA. 2012;109:E2587–E2594. doi: 10.1073/pnas.1202789109. [DOI] [PMC free article] [PubMed] [Google Scholar]
- Idrissi FZ, Grotsch H, Fernandez-Golbano IM, Presciatto-Baschong C, Riezman H, Geli MI. Distinct acto/myosin-I structures associate with endocytic profiles at the plasma membrane. J Cell Biol. 2008;180:1219–1232. doi: 10.1083/jcb.200708060. [DOI] [PMC free article] [PubMed] [Google Scholar]
- Isenberg G, Aebi U, Pollard TD. An actin-binding protein from Acanthamoeba regulates actin filament polymerization and interactions. Nature. 1980;288:455–459. doi: 10.1038/288455a0. [DOI] [PubMed] [Google Scholar]
- Kaksonen M, Toret CP, Drubin DG. A modular design for the clathrin- and actin-mediated endocytosis machinery. Cell. 2005;123:305–320. doi: 10.1016/j.cell.2005.09.024. [DOI] [PubMed] [Google Scholar]
- Kanbe T, Kobayashi I, Tanaka K. Dynamics of cytoplasmic organelles in the cell cycle of the fission yeast Schizosaccharomyces pombe: three-dimensional reconstruction from serial sections. J Cell Sci. 1989;94:647–656. doi: 10.1242/jcs.94.4.647. [DOI] [PubMed] [Google Scholar]
- Kim T, Cooper JA, Sept D. The interaction of capping protein with the barbed end of the actin filament. J Mol Biol. 2010;404:794–802. doi: 10.1016/j.jmb.2010.10.017. [DOI] [PMC free article] [PubMed] [Google Scholar]
- Kovar DR, Wu JQ, Pollard TD. Profilin-mediated competition between capping protein and formin Cdc12p during cytokinesis in fission yeast. Mol Biol Cell. 2005;16:2313–2324. doi: 10.1091/mbc.E04-09-0781. [DOI] [PMC free article] [PubMed] [Google Scholar]
- Kukulski W, Schorb M, Kaksonen M, Briggs JAG. Plasma membrane reshaping during endocytosis is revealed by time-resolved electron tomography. Cell. 2012;150:508–520. doi: 10.1016/j.cell.2012.05.046. [DOI] [PubMed] [Google Scholar]
- Lin MC, Galletta BJ, Sept D, Cooper JA. Overlapping and distinct functions for cofilin, coronin and Aip1 in actin dynamics in vivo. J Cell Sci. 2010;123:1329–1342. doi: 10.1242/jcs.065698. [DOI] [PMC free article] [PubMed] [Google Scholar]
- Marks J, Hyams JS. Localization of F-actin through the cell division cycle of Schizosaccharomyces pombe. Eur J Cell Biol. 1985;39:27–32. [Google Scholar]
- Michelot A, Berro J, Guérin C, Boujemaa-Paterski R, Staiger CJ, Martiel J-L, Blanchoin L. Actin-filament stochastic dynamics mediated by ADF/cofilin. Curr Biol. 2007;17:825–833. doi: 10.1016/j.cub.2007.04.037. [DOI] [PubMed] [Google Scholar]
- Michelot A, Grassart A, Okreglak V, Costanzo M, Boone C, Drubin DG. Actin filament elongation in Arp2/3-derived networks is controlled by three distinct mechanisms. Dev Cell. 2013;24:182–195. doi: 10.1016/j.devcel.2012.12.008. [DOI] [PMC free article] [PubMed] [Google Scholar]
- Mooren OL, Galletta BJ, Cooper JA. Roles for actin assembly in endocytosis. Annu Rev Biochem. 2012;81:661–686. doi: 10.1146/annurev-biochem-060910-094416. [DOI] [PubMed] [Google Scholar]
- Okada K, Blanchoin L, Abe H, Chen H, Pollard TD, Bamburg JR. Xenopus actin-interacting protein 1 (XAip1) enhances cofilin fragmentation of filaments by capping filament ends. J Biol Chem. 2002;277:43011–43016. doi: 10.1074/jbc.M203111200. [DOI] [PubMed] [Google Scholar]
- Okada K, Ravi H, Smith EM, Goode BL. Aip1 and cofilin promote rapid turnover of yeast actin patches and cables: a coordinated mechanism for severing and capping filaments. Mol Biol Cell. 2006;17:2855–2868. doi: 10.1091/mbc.E06-02-0135. [DOI] [PMC free article] [PubMed] [Google Scholar]
- Okreglak V, Drubin DG. Loss of Aip1 reveals a role in maintaining the actin monomer pool and an in vivo oligomer assembly pathway. J Cell Biol. 2010;188:769–777. doi: 10.1083/jcb.200909176. [DOI] [PMC free article] [PubMed] [Google Scholar]
- Rodal AA, Tetreault JW, Lappalainen P, Drubin DG, Amberg DC. Aip1p interacts with cofilin to disassemble actin filaments. J Cell Biol. 1999;145:1251–1264. doi: 10.1083/jcb.145.6.1251. [DOI] [PMC free article] [PubMed] [Google Scholar]
- Roland J, Berro J, Michelot A, Blanchoin L, Martiel J-L. Stochastic severing of actin filaments by actin depolymerizing factor/cofilin controls the emergence of a steady dynamical regime. Biophys J. 2008;94:2082–2094. doi: 10.1529/biophysj.107.121988. [DOI] [PMC free article] [PubMed] [Google Scholar]
- Schneider CA, Rasband WS, Eliceiri KW. NIH Image to ImageJ: 25 years of image analysis. Nat Methods. 2012;9:671–675. doi: 10.1038/nmeth.2089. [DOI] [PMC free article] [PubMed] [Google Scholar]
- Sirotkin V, Berro J, Macmillan K, Zhao L, Pollard TD. Quantitative analysis of the mechanism of endocytic actin patch assembly and disassembly in fission yeast. Mol Biol Cell. 2010;21:2894–2904. doi: 10.1091/mbc.E10-02-0157. [DOI] [PMC free article] [PubMed] [Google Scholar]
- Skau CT, Courson DS, Bestul AJ, Winkelman JD, Rock RS, Sirotkin V, Kovar DR. Actin filament bundling by fimbrin is important for endocytosis, cytokinesis, and polarization in fission yeast. J Biol Chem. 2011;286:26964–26977. doi: 10.1074/jbc.M111.239004. [DOI] [PMC free article] [PubMed] [Google Scholar]
- Suetsugu S, Gautreau A. Synergistic BAR-NPF interactions in actin-driven membrane remodeling. Trends Cell Biol. 2012;22:141–150. doi: 10.1016/j.tcb.2012.01.001. [DOI] [PubMed] [Google Scholar]
- Takagi T, Ishijima SA, Ochi H, Osumi M. Ultrastructure and behavior of actin cytoskeleton during cell wall formation in the fission yeast Schizosaccharomyces pombe. J Electron Microsc (Tokyo) 2003;52:161–174. doi: 10.1093/jmicro/52.2.161. [DOI] [PubMed] [Google Scholar]
- von Bülow M, Rackwitz HR, Zimbelmann R, Franke WW. CP β3, a novel isoform of an actin-binding protein, is a component of the cytoskeletal calyx of the mammalian sperm head. Exp Cell Res. 1997;233:216–224. doi: 10.1006/excr.1997.3564. [DOI] [PubMed] [Google Scholar]
- Wang J, Qian D, Fan T, Jia H, An L, Xiang Y. Arabidopsis actin capping protein (AtCP) subunits have different expression patterns, and downregulation of AtCPB confers increased thermotolerance of Arabidopsis after heat shock stress. Plant Sci. 2012;193–194:110–119. doi: 10.1016/j.plantsci.2012.06.002. [DOI] [PubMed] [Google Scholar]
- Wear MA, Yamashita A, Kim K, Maéda Y, Cooper JA. How capping protein binds the barbed end of the actin filament. Curr Biol. 2003;13:1531–1537. doi: 10.1016/s0960-9822(03)00559-1. [DOI] [PubMed] [Google Scholar]
- Wu JQ, McCormick CD, Pollard TD. Chapter 9: counting proteins in living cells by quantitative fluorescence microscopy with internal standards. Methods Cell Biol. 2008;89:253–273. doi: 10.1016/S0091-679X(08)00609-2. [DOI] [PubMed] [Google Scholar]
- Wu JQ, Pollard TD. Counting cytokinesis proteins globally and locally in fission yeast. Science. 2005;310:310–314. doi: 10.1126/science.1113230. [DOI] [PubMed] [Google Scholar]
- Wu JQ, Sirotkin V, Kovar DR, Lord M, Beltzner CC, Kuhn JR, Pollard TD. Assembly of the cytokinetic contractile ring from a broad band of nodes in fission yeast. J Cell Biol. 2006;174:391–402. doi: 10.1083/jcb.200602032. [DOI] [PMC free article] [PubMed] [Google Scholar]
- Yamashita A, Maeda K, Maéda Y. Crystal structure of CapZ: structural basis for actin filament barbed end capping. EMBO J. 2003;22:1529–1538. doi: 10.1093/emboj/cdg167. [DOI] [PMC free article] [PubMed] [Google Scholar]
Associated Data
This section collects any data citations, data availability statements, or supplementary materials included in this article.