

Dynamin2 dimers are the preferred assembly units recruited to coated pits. About 26 dynamins (one helical turn of a dynamin collar) are enough for release of most coated vesicles. A circumferential twist–propagating model is proposed that requires that one complete turn of the helix reach a state in which one or more pairs of GTPase domains interact.
Abstract
Dynamin, the GTPase required for clathrin-mediated endocytosis, is recruited to clathrin-coated pits in two sequential phases. The first is associated with coated pit maturation; the second, with fission of the membrane neck of a coated pit. Using gene-edited cells that express dynamin2-EGFP instead of dynamin2 and live-cell TIRF imaging with single-molecule EGFP sensitivity and high temporal resolution, we detected the arrival of dynamin at coated pits and defined dynamin dimers as the preferred assembly unit. We also used live-cell spinning-disk confocal microscopy calibrated by single-molecule EGFP detection to determine the number of dynamins recruited to the coated pits. A large fraction of budding coated pits recruit between 26 and 40 dynamins (between 1 and 1.5 helical turns of a dynamin collar) during the recruitment phase associated with neck fission; 26 are enough for coated vesicle release in cells partially depleted of dynamin by RNA interference. We discuss how these results restrict models for the mechanism of dynamin-mediated membrane scission.
INTRODUCTION
During clathrin-mediated endocytosis, regulated recruitment of clathrin and its associated proteins leads to assembly of a scaffold that molds a small patch of plasma membrane into an invaginated, clathrin-coated pit (Brett and Traub, 2006; McMahon and Boucrot, 2011; Jackson et al., 2012b; Kirchhausen et al., 2014). These structures capture membrane-bound cargo and pinch off to form clathrin-coated vesicles. Prompt uncoating yields vesicular carriers, which can deliver cargo to endosomes or other membrane-bound organelles.
Coated-vesicle budding requires members of the dynamin family of large GTPases (Koenig et al., 1989; Damke et al., 1994; Ferguson et al., 2007), of which human cells have three very similar isoforms, dynamins1–3 (Cook et al., 1996; Urrutia et al., 1997; Brett and Traub, 2006; McMahon and Boucrot, 2011; Jackson et al., 2012a; Kirchhausen et al., 2014). Dynamin2 is expressed in all cell types; dynamin1 is restricted to neurons; and dynamin3 is found in neurons, lungs, and testes. Assembling coated pits recruit these proteins in two phases (Koenig et al., 1989; Damke et al., 1994; Merrifield et al., 2002; Ehrlich et al., 2004; Macia et al., 2006; Ferguson et al., 2007; Taylor et al., 2012; Aguet et al., 2013). The first phase, which accompanies the early stages of coated pit formation, appears to regulate coated pit maturation by as-yet-undefined mechanisms (Macia et al., 2006; Aguet et al., 2013). The second phase, which generally appears as a “burst” immediately before membrane scission, is necessary for fission of the membrane neck connecting the nascent vesicle with the parent membrane (Merrifield et al., 2002; Macia et al., 2006; Taylor et al., 2011, 2012; Aguet et al., 2013).
Dynamins have an N-terminal GTPase “head,” similar in structure to Ras-like small GTPases, connected to a long, primarily α-helical stalk (Chappie et al., 2009; Chappie and Dyda, 2013; Faelber et al., 2011; Ford et al., 2011). The stalk, which has a membrane-interacting PH domain at its tip, doubles back, so that the C-terminus of the polypeptide chain contacts the head. In solution, dynamin dimerizes readily; the dimers associate into tetramers at higher concentrations. Crystal structures and cryo–electron microscopic (cryo-EM) reconstructions suggest that two sets of dimer contacts are critical for polymer assembly (Chappie et al., 2011). An oblique contact between stalks of two protomers produces an X-shaped dimer, with the GTPase domains projecting away from the midplane of the X. The PH domains are flexibly tethered at the other end of each stalk (Figure 1). GTPase–GTPase contacts generate a second twofold relationship between two of the stalk dimers just described. The two contacts produce a repeating, helical polymer (Figure 1), with the midplane of the X normal to the helix axis. GTP, which binds near the GTPase dimer interface, stabilizes the dimer contact, and formation of the interface greatly increases the rate of nucleotide hydrolysis.
FIGURE 1:
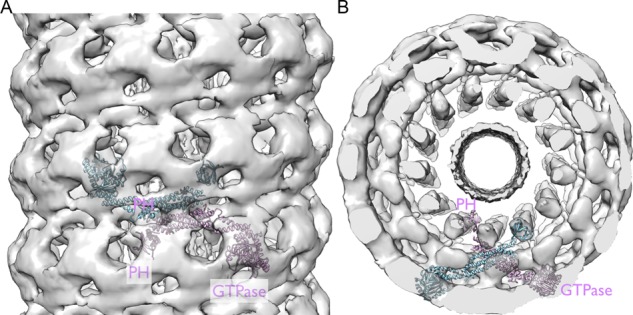
Rigid-body fit of the x-ray crystallographic atomic model of dynamin to the density from the cryo-EM image reconstruction. (A) Side view from outside the right-handed, single-start helix. Gray, contours of the cryo-EM map (EMD-1949; Chappie et al., 2011). The ribbon diagram shows an X-shaped dynamin dimer, with the GTPase domains projecting away from the midplane of the X and with the PRD at the carboxy-terminus removed (PDB 3ZVR; Ford et al., 2011). The PH domains are flexibly tethered at the other end of each dynamin stalk. The dynamin atomic model was inserted into the dynamin helix cryo-EM density map using Chimera (Goddard et al., 2007), with Figure 5 in Chappie et al. (2011) as a guide. (B) End view of the same to show the relation between the inner membrane bilayer and dynamin.
The GTPase-proximal segment of the stalk, a helical bundle sometimes called the “bundle signaling element” (BSE; Chappie et al., 2009, 2010), responds through the “switch 1” element of the GTPase to the occupancy of the nucleotide-binding site. Structures that include both the GTPase and the BSE show that the latter has one conformation (relative to the Ras-like domain) in the GTP-bound state (as represented by the nonhydrolyzable analogue, GMPPCP) and a quite different one in the transition state (as represented by GDP-AlF4−). The latter is essentially the same as in the GDP-bound and unliganded states. Assuming these properties to carry over to the intact molecule assembled around a membrane neck or tube, one can infer that GTP loading primes the molecule for a powerstroke that occurs at the transition state of the hydrolysis mechanism.
Dynamins assemble in vitro around membrane tubules, forming helical structures in which stem–stem dimer contacts, closely related to those in the crystals, contribute to the principal helical path. GTPase–GTPase dimer contacts bridge adjacent helical turns (Figure 1; Sweitzer and Hinshaw, 1998; Zhang and Hinshaw, 2001; Chappie et al., 2011). These in vitro assemblies probably correspond to a dynamin “collar” at the neck of a budding coated pit or at the constriction of an in vitro membrane tubule created by assembly of a dynamin sheath (Morlot and Roux, 2013). The link to the constricted membrane bilayer is through the dynamin PH domain at the tip of each stalk. The coupling of GTP hydrolysis with conformational changes in the BSE alters the orientation of the stalk and can in principle change the diameter and helical pitch of the collar.
Early models for membrane scission driven by GTP hydrolysis postulated a concerted change in diameter of the helical sheath or collar, with attendant distortion of the membrane (Warnock et al., 1996; Smirnova et al., 1999; Stowell et al., 1999; Praefcke and McMahon, 2004; Bashkirov et al., 2008). The inner diameter of the membrane tubule around which dynamin in the GMPPCP state assembles, with ∼26 dynamins per turn of a single-start helix, is ∼7 nm (Chen et al., 2004; Figure 1). Models of membrane fission suggest that the inner diameter of a constriction must contract to ∼3 nm for a spontaneous hemifission intermediate to form (Kozlovsky and Kozlov, 2003; Bashkirov et al., 2008; Morlot et al., 2012; Shnyrova et al., 2013). It thus remains puzzling how the proposed powerstroke that attends passage to the transition state of the GTPase might couple to a local contraction of the enclosed membrane.
An estimate of the minimum number of dynamin molecules required for scission constrains models for how the dynamin powerstroke might couple to change in membrane curvature. We report here measurements that yield such a count. We applied an experimental design essentially similar to the one we developed to define molecular events associated with the initiation of coated pits (Cocucci et al., 2012). The basic principles are use of gene-edited cells, so that the relevant molecule (dynamin in the present case) with an encoded fluorescent tag (enhanced green fluorescent protein [EGFP]) is present in physiological quantities, undiluted by untagged copies, and use of total internal reflection fluorescence (TIRF) illumination to minimize background and allow single-EGFP sensitivity (Cocucci et al., 2012) or intensity-calibrated spinning-disk confocal fluorescence microscopy for molecule counting (Kural et al., 2012).
We find that a dynamin dimer is the basic assembly unit, as recruitment proceeds in steps of 2 dynamins (never 1). Accumulation of ∼26 dynamins (one turn of the dynamin-GMPPCP helix) is sufficient under some conditions to produce membrane scission; rarely do we see more than twice that amount. That is, one turn of the basic helix is enough, and two complete turns are not essential. A publication that appeared while this work was in review reported a broadly similar result, also using gene-edited cells: the authors of that study detected a minimum of 26 dynamins at the time of scission, although they often found twice that amount (Grassart et al., 2014). Because nucleotide-mediated dimer contacts between GTPase head domains bridge successive helical turns, the measurements have strong implications for models to explain how GTP hydrolysis drives membrane fission. In particular, our results are not consistent with models invoking isotropic contraction of a continuous dynamin collar, as that category of mechanism requires a full turn of GTPase contacts and therefore two full turns of the basic helix. They appear instead to favor models that invoke a GTPase-driven twist, in which contraction of the diameter of a collar comes from a reduction in the number of dynamin dimers per turn.
RESULTS
Gene-edited cells expressing dynamin2-EGFP
To study the molecular events associated with dynamin-mediated membrane fission at the neck of clathrin-coated pits, we established a gene-edited cell line in which we replaced the ubiquitous dynamin2 with a dynamin2-EGFP chimera. We selected the human cell line SUM159 (Forozan et al., 1999), breast cancer–derived, mostly diploid cells, and used transcription activator-like effector nuclease (TALEN)–mediated editing to create the chimera-encoding gene (Sanjana et al., 2012). We chose to connect EGFP with a linker of six amino acids to the C-terminus of dynamin2 (Figure 2A). We isolated clone SUM-Dyn2, bearing the insertion at both alleles. Analysis of the genomic DNA by PCR showed that both alleles were indeed substituted and that there was no DNA encoding wild-type dynamin2 (Figure 2B). Consistent with this result, Western blot analysis using a monoclonal antibody specific for dynamin2 showed ∼98% substitution of dynamin2 by the expressed dynamin2-EGFP (Figure 2C). A different linker, used previously to express dynamin2-EGFP in the gene-edited SK-MEL-2 cell line hCLTAEN/DNM2EN (Figure 3A), does appear to be susceptible to proteolysis, as the apparent level of substitution is only ∼50% (Figure 3B; Doyon et al., 2011), and these cells also have free EGFP (Doyon et al., 2011; unpublished data). Western blot analysis with a monoclonal antibody specific for dynamin1 showed a very low level of dynamin1 in the SUM-Dyn2 cells (∼5% of dynamin2-EGFP) and undetectable levels in the hCLTAEN/DNM2EN cells.
FIGURE 2:
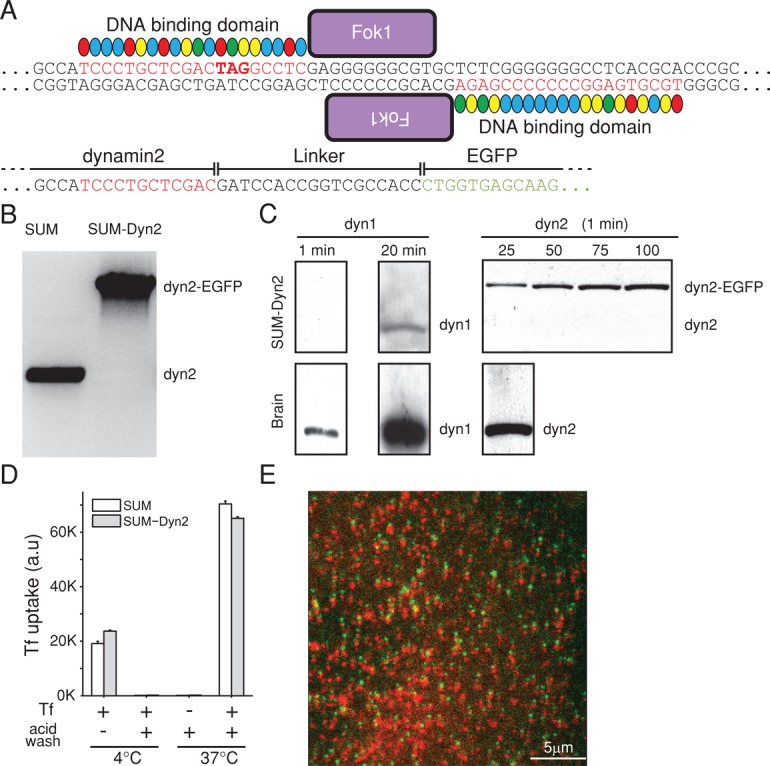
Gene editing of SUM cells to express dynamin2-EGFP. (A) Schematic representation of the gene-editing strategy used with SUM159 cells to incorporate EGFP to the C-terminus of dynamin2 based on the TALEN approach (Sanjana et al., 2012). The portions of the genomic DNA highlighted in red correspond to the sequences recognized by the DNA-binding domains constructed and then fused to two different copies of the Fok1 endonuclease; the stop codon TAG indicates the site of EGFP incorporation. The resulting sequence joined by a short linker between the C-terminus of dynamin2 and N-terminus of EGFP is indicated. (B) PCR analysis showing the biallelic integration of EGFP into the dynamin2 locus in the clonal cell line SUM-Dyn2; SUM denotes the parental cells. (C) Western blot analysis of cell lysates from brain or from SUM-Dyn2 cells expressing dynamin2-EGFP probed with antibodies specific for dynamin1 or dynamin2. Quantification of band intensities indicates that in SUM-Dyn2, ∼2% of expressed dynamin2 lacks EGFP (98% substitution) and ∼5% of dynamin1 in the total pool of dynamin1, dynamin2, and dynamin2-EGFP. Similar results were obtained with a different Western blot from a second cell lysate (unpublished data). (D) Expression of dynamin2-EGFP does not affect the receptor-mediated endocytosis of transferrin. The endocytosis of fluorescently tagged Alexa 647 transferrin was determined using a flow cytometry–based assay. Cells were first incubated with Alexa 647–transferrin for 10 min at 4°C or 10 min at 37°C and then subjected to an acid wash in ice-cold medium to remove the transferrin bound to the cell surface. The histogram shows the same amount of transferrin internalized by the parental SUM and gene-edited SUM-Dyn2 cells. The bars represent the average ± SD from duplicate determinations carried out using ∼10,000 cells/measurement. (E) Frame from a time series of coated pits from the attached surface of SUM-Dyn2 cell expressing dynamin2-EGFP (green) and clathrin mCherry-LCa (red). Consecutive images for each fluorescence channel were obtained with 30-ms exposure using spinning-disk fluorescence confocal microscopy. Channels were shifted vertically by 4 pixels to help identify pits containing both fluorescently tagged proteins. Scale bar, 5 μm.
FIGURE 3:
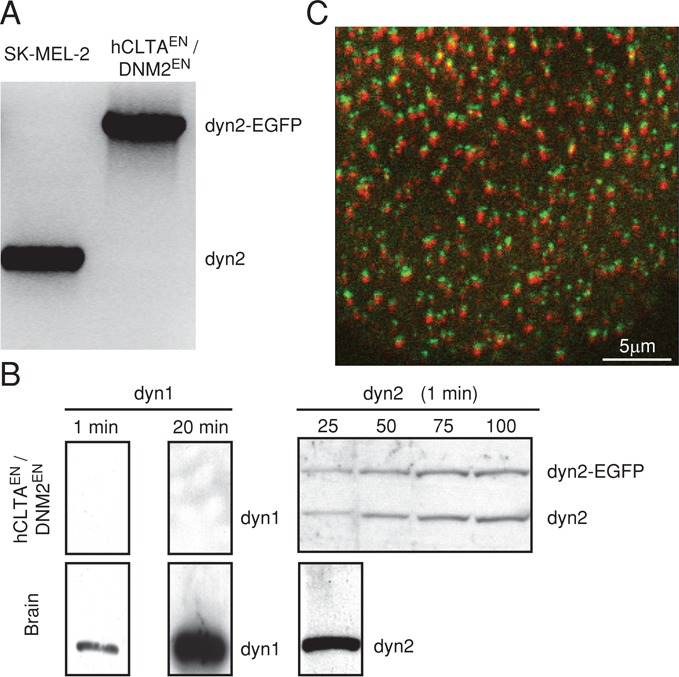
Characterization of hCLTAEN/DNM2EN cells expressing dynamin2-EGFP. (A) PCR analysis confirms published results (Doyon et al., 2011) showing the biallelic integration of EGFP to the dynamin2 in the clonal cell line named hCLTAEN/DNM2EN gene-edited to express dynamin2-EGFP and LCa-RFP; SK-MEL-2 denotes the parental cell line. (B) Western blot analysis of cell lysates from brain or from hCLTAEN/DNM2EN cells expressing dynamin2-EGFP probed with antibodies specific for dynamin1 or dynamin2. Quantification of band intensities indicates that ∼50% of expressed dynamin2 lacks EGFP and that dynamin1 is undetectable in the total pool of dynamin of hCLTAEN/DNM2EN cells. Similar results were obtained using another cell lysate obtained from the hCLTAEN/DNM2EN cells (unpublished data). (C) Frame from a time series showing fluorescent spots corresponding to coated pits labeled with dynamin2-EGFP (green) and clathrin LCa-RFP. The image was acquired using spinning-disk confocal microscopy from the attached surface of hCLTAEN/DNM2EN cells. Consecutive images for each fluorescence channel were obtained with 30-ms exposure. Channels shifted vertically by four pixels. Scale bar, 5 μm.
We verified that the endocytic efficiency of the clathrin machinery was normal in the SUM-Dyn2 cells. We found no difference between control and gene-edited cells in receptor-mediated uptake of fluorescently tagged transferrin-A647, using flow cytometry to measure endocytic uptake (Figure 2D). This result is consistent with earlier observations in conditional null mouse fibroblast cells, showing that ectopic expression of dyn2-EGFP (with a different linker) did not interfere with the uptake of transferrin (Liu et al., 2008). These observations show that addition of EGFP to the C-terminus of dynamin2 does not interfere with its ability to promote coated-vesicle budding.
Times series acquired by live-cell, spinning-disk, confocal microscopy from the bottom surface of SUM-Dyn2 cells expressing rat clathrin light chain a (LCa) fused to mCherry (mCherry-LCa; Figure 2E) or of hCLTAEN/DNM2EN cells gene edited to express dynamin2-EGFP and human clathrin LCa–red fluorescent protein (RFP; Figure 3C) confirmed the expected presence of structures containing both fluorescent clathrin and dynamin. Most of these were dynamic spots corresponding to canonical coated pits; a minority were long-lived coated plaques. The remaining fluorescent spots contained only clathrin; these were the very mobile structures associated with endosomal membranes (Ehrlich et al., 2004; Kural et al., 2012; Aguet et al., 2013). We restricted most of the analysis of dynamin presented here to its recruitment at canonical coated pits.
Estimate of the number of dynamin molecules accumulated at the time of membrane fission
Observations in several laboratories have led to the conclusion that fission at the membrane neck of a coated pit and release of a coated vesicle from the plasma membrane coincide with a peak in dynamin recruitment (Ehrlich et al., 2004; Merrifield et al., 2005; Taylor et al., 2011, 2012; Aguet et al., 2013), but direct information concerning the number of dynamin molecules that contribute to this peak has been lacking. From in vitro studies, it has been proposed that a two-rung helical collar is the minimal membrane fission unit, with two to three rungs mediating ∼80% of the fission events (Shnyrova et al., 2013). This model implies that ∼50 dynamin molecules will have accumulated at the time of fission, since one rung in the constricted, GTP-bound conformation contains ∼13.3 dynamin dimers. Other models might require fewer dynamins (Ford et al., 2011).
We carried out a primary selection of objects containing fluorescent dynamin and clathrin using the cmeAnalysis software with clathrin as the “master” and dynamin as the “slave” (Aguet et al., 2013); we then picked manually from the automated primary selections those objects whose clathrin fluorescent signal followed the expected continuous growth associated with canonical coated pits (see Materials and Methods and representative traces in Figure 4). This selection was important because the clathrin signal was not strong enough for reliable automated selection, and the software often incorrectly classified tracks of coated pits as abortive rather than canonical or incorrectly combined into a single event two or more pits that formed sequentially at a single location (a “hot spot”).
FIGURE 4:
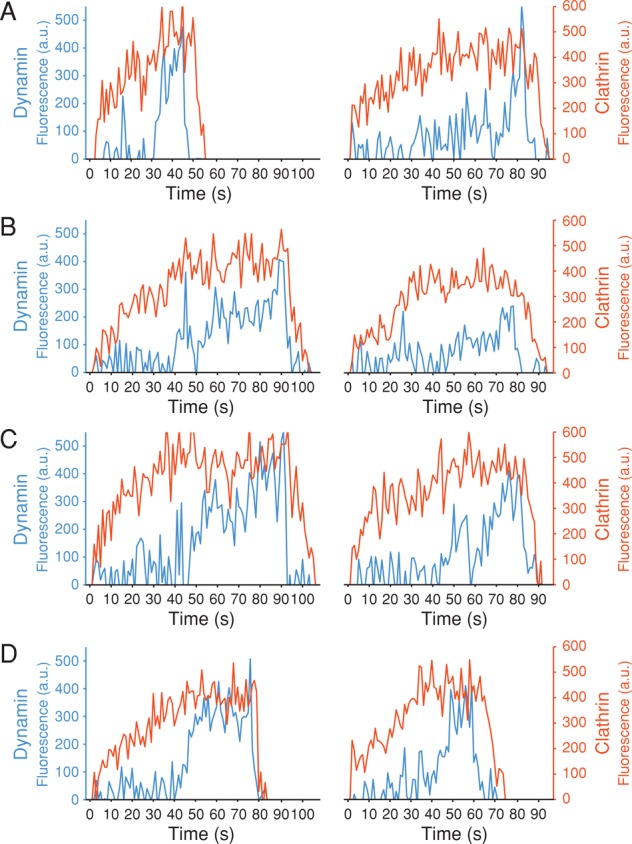
Representative traces of clathrin-coated pits forming in SUM-Dyn2 cells. Plot of the fluorescence intensity traces of dynamin2-EGFP (blue) and mCherry-LCa (red) from SUM-Dyn2 cells recruited during formation of clathrin-coated pits in Sum-Dyn2 cells. The data are from 5-min time series obtained using spinning-disk confocal microscopy every 1 s with an exposure of 30 ms/frame. The traces highlight examples of the variability in the recruitment patterns during the first and second phases of association with clathrin-coated pits. (A) Relatively small amount of dynamin recruited during the first phase, followed by a brief but pronounced sharp recruitment during the second phase. (B) A significant amount of dynamin recruited during the first phase, followed by a distinctive recruitment burst during the second phase. (C) A significant amount of dynamin recruited during the first phase that is poorly resolved from the recruitment preceding membrane scission. (D) Dynamin is recruited as a relatively broad burst toward the end of the budding process.
We followed in SUM-Dyn2 cells the recruitment of dynamin2-EGFP during the full lifetime of the selected coated pits and determined the number of molecules recruited, using spinning-disk confocal microscopy, calibrated for fluorescence intensity, as described in our previous work (Kural et al., 2012). We used this strategy instead of TIRF because spinning-disk confocal imaging is less sensitive to position along the z-axis, thereby ensuring full capture of the signal within the diffraction-limited geometry. We used SUM-Dyn2 cells stably expressing mCherry-LCa, and used alternate wavelength excitation and detection of both fluorophores with 30-ms exposures to follow recruitment of clathrin and dynamin at the same position. We collected data from the bottom surfaces of the cells using time series lasting 5 min acquired every second and analyzed the dynamics of dynamin2-EGFP recruitment from 426 clathrin-coated structures in five different cells.
In agreement with earlier results (Figure 2D; Merrifield et al., 2002; Ehrlich et al., 2004; Macia et al., 2006; Doyon et al., 2011; Taylor et al., 2011, 2012), most (>90%) of the dynamin2-EGFP spots at the membrane colocalized with mCherry-LCa. Dynamin was generally recruited in two phases, also as previously described, although the distinction was not always as marked as in hCLTAEN/DNM2EN cells. In the first phase, which occurs during early stages of clathrin coat assembly, dynamin accumulated gradually to a plateau of variable magnitude. The second phase was the characteristic burst at the end of assembly, immediately before the loss of the clathrin signal associated with uncoating. Similar results were reported recently using the gene-edited hCLTAEN/DNM2EN and DNM2EN cells (Grassart et al., 2014). In view of the complete substitution in our cells and the very small proportion of dynamin 1, we used the maximum intensity of the total dynamin accumulation to determine the number of molecules recruited at the time of membrane scission. The distribution peaked at ∼40 dynamins and averaged at 50 ± 19 molecules (Figure 5A). Nearly 25% of the events contained between 26 and 40 dynamins, and ∼27% of the events, between 40 and 52 dynamins (Figure 5B).
FIGURE 5:
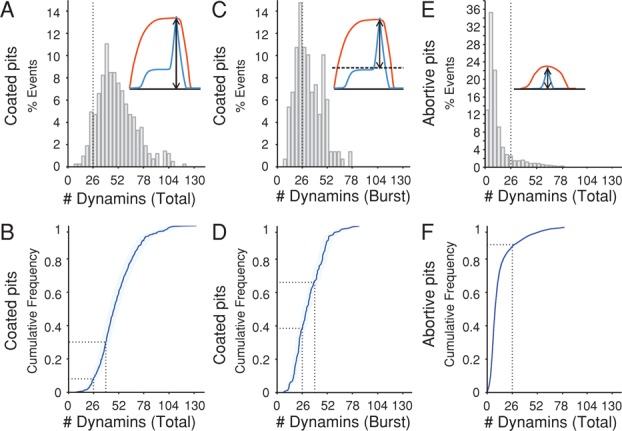
Number of dynamin molecules recruited to coated pits at the time of membrane fission in SUM-Dyn2 cells. The number of dynamin molecules recruited to clathrin-coated structures was obtained from the net fluorescence intensities of recruited dynamin2-EGFP (fluorescence intensity for a given spot minus the fluorescence intensity of the background calibrated by the fluorescence of a single molecule), corrected for the calculated substitution (98%) of endogenous dynamin2 by dynamin2-EGFP. Data from five cells, obtained using spinning-disk confocal microscopy; the time series acquired every 1 s with an exposure of 30 ms/frame. (A) Histogram of the total number of dynamin molecules recruited to coated pits at the time of membrane fission (426 pits). Dotted line marks 26 dynamins. (B) Cumulative distribution associated with the values shown in A demonstrating that ∼25% of the coated pits recruited between 26 and 40 dynamin molecules and 28% recruit between 40 and 52. Dotted lines mark 26 and 40 dynamins. The light blue area overlapping the tracings indicates 95% confidence interval for the estimated number of recruited dynamins. (C) Histogram of the number of dynamins recruited during the final burst (150 pits) shows that it peaks at ∼26 dynamins. The number of recruited molecules was calculated as the difference between the maximal peak value and the value averaged from frames imaged 9, 10, and 11 s before the peak. (D) Cumulative distribution of the data in C; ∼30% of the pits recruited between 26 and 40 dynamins and 23% between 40 and 52. Dotted lines mark 26 and 40 dynamins. (E) Histogram of the maximum number of dynamin molecules recruited to abortive pits (n = 8514). Dotted line marks 26 dynamins. (F) Cumulative distribution of the data in E; ∼90% of the pits recruited <26 dynamin molecules. Dotted line marks 26 dynamins.
We do not know whether the gradually accumulated dynamin contributes to scission. To estimate the number of dynamins specifically recruited during the burst phase, we subtracted the maximum fluorescence from the plateau 10 s before the peak of the burst. The values plotted, as a histogram and as a cumulative distribution in Figure 5, C and D, showed a peak at 26–28 dynamins with an average of 33 ± 14 dynamins. In the low-intensity, abortive pits (events lasting <25 s), we saw no dynamin burst and detected only small and variable amounts of phase one dynamin recruitment (Figure 5, E and F). We obtained similar results from hCLTAEN/DNM2EN cells (Figure 6). Because substitution of dynamin2 by dynamin2-EGFP was only 50% in those cells, the agreement supports the assumption of random incorporation of tagged and untagged dynamin molecules in a ratio depending only on their relative concentrations in the cytosol.
FIGURE 6:
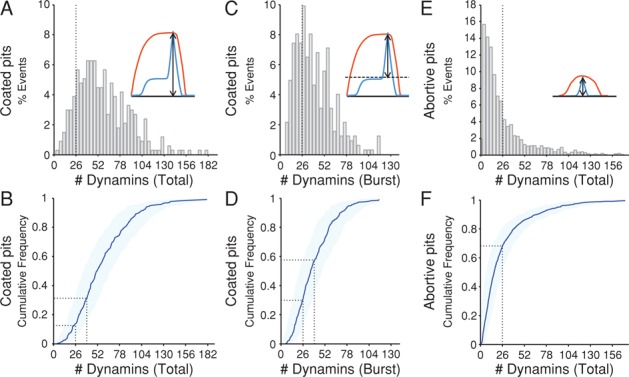
Number of dynamin molecules recruited to coated pits at the time of membrane fission in hCLTAEN/DNM2EN cells. The number of dynamin molecules recruited to clathrin-coated structures was obtained as described in Figure 5 from three cells. The substitution of endogenous dynamin2 by dynamin2-EGFP in hCLTAEN/DNM2EN cells was ∼50%. (A) Histogram of the total number of dynamin molecules recruited to coated pits at the time of membrane fission (337 pits). (B) Cumulative distribution of the data in A; ∼19% of the coated pits recruited between 26 and 40 dynamin molecules, and ∼23% recruited between 40 and 52 dynamins. (C) Histogram of the number of dynamins recruited during the final burst (337 pits) shows a peak at ∼26 dynamins. Dotted line marks 26 dynamins. (D) Cumulative distribution of the data in C; ∼27% of the pits recruited between 26 and 40 dynamins, and ∼24% recruited between 26 and 40. Dotted lines mark 26 and 40 dynamins. (E) Histogram of the maximum number of dynamin molecules recruited to abortive pits (n = 1523). Dotted line marks 26 dynamins. (F) Cumulative distribution of the shown in E; ∼70% of the pits recruited <26 dynamin molecules. Dotted line marks 26 dynamins.
Effects of higher and lower membrane tension
Scission of dynamin-coated membrane tubules in vitro requires that the tubule be under longitudinal tension (Roux et al., 2006; Morlot and Roux, 2013; Morlot et al., 2012; Bashkirov et al., 2008; Shnyrova et al., 2013). We examined the effect of membrane tension on the number of dynamin molecules that have accumulated at the time of coated vesicle release in SUM-Dyn2 cells expressing mCherry-LCa. Lowering plasma membrane tension by acute exposure to hyperosmotic medium inhibits coated vesicle formation (and the associated endocytosis of cargo; Heuser and Anderson, 1989; Morlot et al., 2012). Introduction of hyperosmolar medium (lowering membrane tension) caused the total number of dynamins to increase (Figure 7, A and B), suggesting that a flaccid membrane needs more dynamin to rupture than does a tense one. Nonetheless, cells incubated in hypo-osmotic medium (Boulant et al., 2011) and thereby subjected to a higher plasma membrane tension accumulated approximately the same number as did control cells (Figure 7, B–F). Thus there appears to be a threshold requirement for membrane scission, even when tension is unphysiologically high.
FIGURE 7:
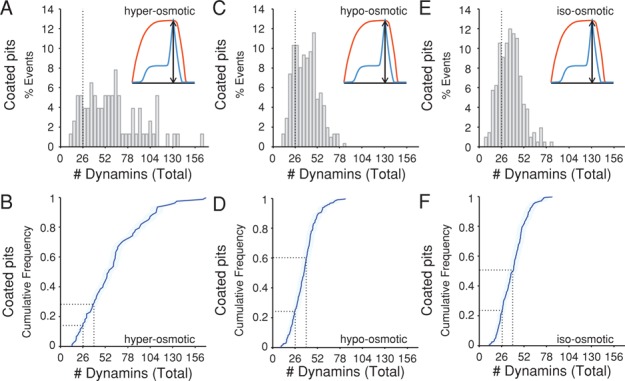
Effect of membrane tension on the number of dynamin molecules recruited to coated pits at the time of membrane fission. The total number of dynamin molecules recruited to clathrin-coated pits was determined as in Figure 5 using Sum-Dyn2 briefly exposed for 10 min to media of different osmolarities. Five cells were used per condition. (A) Histogram of the total number of dynamin molecules recruited to coated pits of cells incubated in hyper-osmotic medium at the time of membrane fission (78 pits). (B) Cumulative distribution of the data in A; ∼16% of the pits recruit between 26 and 40 dynamins, and 13% recruited between 40 and 52 dynamins. (C) Histogram of the total number of dynamin molecules recruited to coated pits of cells incubated in hypo-osmotic medium at the time of membrane fission (210 pits). (D) Cumulative distribution of the data in C; ∼38% of the pits recruit between 26 and 40 dynamins, and ∼27% recruited between 40 and 52 dynamins. (E) Histogram of the total number of dynamin molecules recruited to coated pits of cells incubated in iso-osmotic medium at the time of membrane fission (312 pits). (F) Cumulative distribution of the data in E; ∼30% of the pits recruited between 26 and 40 dynamins, and ∼30% recruited between 40 and 52 dynamins.
The results also showed greater number of persistent clathrin-coated structures in cells treated with hyperosmotic medium (n = 1746, from five cells) than in cells treated with hypo-osmotic medium (n = 312, from five cells) or kept in iso-osmotic conditions (n = 260, from five cells), consistent with the known inhibition of clathrin-mediated endocytosis (Heuser and Anderson, 1989; Morlot et al., 2012) associated with accumulation of clathrin-coated micro cages at the plasma membrane (Heuser and Anderson, 1989) induced by transient hyperosmotic treatment. We detected a variable number of dynamins; the amount often fluctuates, without associated pinching (unpublished data).
Effect of dynamin depletion
Complete elimination of dynamin2 by disruption of all dynamin2 alleles showed that its presence is essential for budding of endocytic clathrin-coated vesicles (Liu et al., 2008). Accordingly, we found that dynamin depletion in SUM-Dyn2 cells by RNA interference (RNAi) treatment for 5 d hindered clathrin-dependent uptake of transferrin (Figure 8A). We inferred that depletion was incomplete because the fluorescence intensity of dynamin2-EGFP remaining in the cytosol was 25 ± 10% (average ± SD, 10 cells) and because a small fraction of dynamic pits remained that contained both clathrin and dynamin2-EGFP. Under these conditions of partial depletion, we asked what would be the number of dynamins required for coated-vesicle budding. We analyzed 97 events in 10 cells and found that ∼50% of the budding coated pits had no detectable recruitment during the first phase and on average recruited 28 ± 10 dynamins (Figure 8, B and C); the distribution of the total number of dynamins at the time of pinching (Figure 8, D and E) averaged at 32 ± 13 molecules. The results suggest that a very small number of dynamins in the first phase of recruitment is enough to allow the pit to mature and that 26–28 dynamins (one rung) are sufficient for membrane scission.
FIGURE 8:
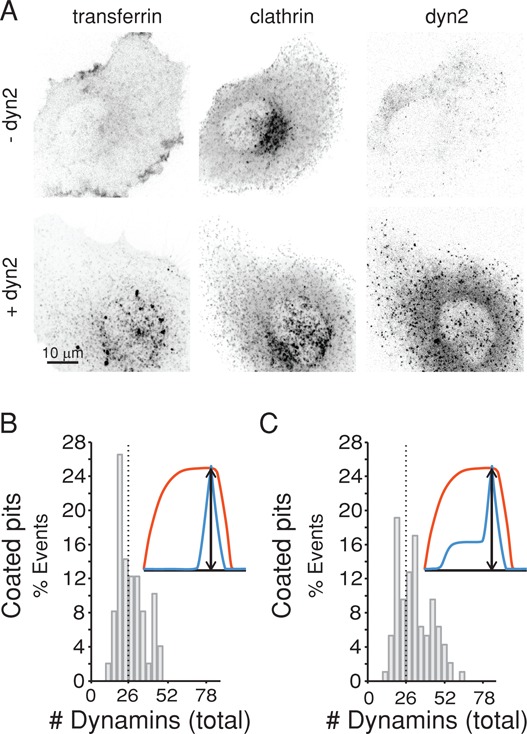
Effect of dynamin depletion on the amount of dynamin recruited to coated pits at the time of membrane fission. SUM-Dyn2 expressing mCherry-LCa was depleted of dynamin2 by RNAi treatment for 5 d and then analyzed for the effects on transferrin uptake and on the number of dynamin molecules recruited to the few coated pits that still formed. (A) Representative z-stack projections of planes spaced at 350 nm acquired by live-cell three-dimensional spinning-disk confocal fluorescence microscopy of fluorescently tagged transferrin-A647, mCherry-LCa (clathrin), and dynamin2-EGFP, comparing cells depleted of dynamin2 (−dyn2) with controls (+dyn2); just before imaging, the cells were exposed to 50 μg/ml transferrin-A647 for 7 min at 37°C. The images of the dynamin-depleted cells illustrate absence of the intracellular punctuate pattern characteristic of endocytosed transferrin-A647 and decrease in the overall fluorescence signal of dynamin2-EGFP. (B) Total number of dynamin molecules recruited at the time of membrane fission determined as in Figure 5 from 10 Sum-Dyn2 cells depleted of dynamin2 and unable to internalize transferrin-A647. Histogram is for data from 50 clathrin-coated pits that lacked the first recruitment phase. Dotted line marks 26 dynamins. (C) Histogram is for all the coated pits identified in the 10 cells with and without the first recruitment phase (97 pits). Dotted line marks 26 dynamins.
Preferential recruitment of dynamin dimers to coated pits
Using a TIRF configuration calibrated from single-molecule counting as previously described (Cocucci et al., 2012), we followed the accumulation of dynamin2-EGFP into coated pits at the bottom surface of SUM-Dyn2 cells. We acquired a rapid time series lasting ∼20 s, with 60-ms exposure/frame at an interval of 110 ms. This protocol minimized photobleaching to not more than 20% toward the end of the time series. We analyzed 23 traces from five cells selected to have relatively low amplitude and therefore show phase 1 of dynamin recruitment. We found consecutive stepwise intensity increments of variable magnitude and a dwell time of 1.06 ± 0.57 s (Figure 9A). The number of dynamin2-EGFP molecules recruited during each of the steps was obtained by fitting the intensity distributions with different models that took into account the dynamin2 substitution by dynamin2-EGFP (98%) and alternative contributions of monomer, dimer, tetramer, and so on of dynamin2-EGFP during the steps of recruitment (see Materials and Methods).
FIGURE 9:
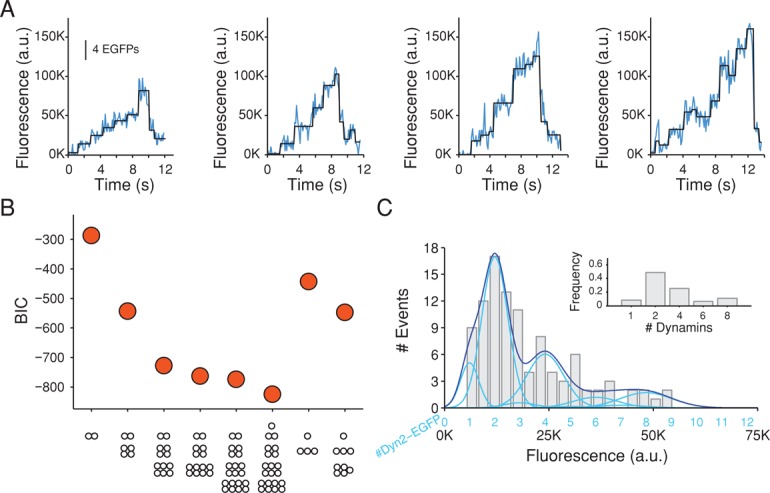
Stepwise recruitment of dynamin during the formation of coated pits detected with single-molecule sensitivity. (A) Representative plots of fluorescence intensity traces of dynamin2-EGFP recruited to four assembling coated pits in SUM-dyn2 cells imaged with TIRF microscopy every 110 ms with an exposure of 60 ms/frame; fit (black) obtained by applying a step-fitting function to estimate the average fluorescence intensity and dwell time of the steps. (B) Value of the BIC used to determine the best fit between the experimental data from 104 recruitment steps from 23 coated pits in five cells and the stepwise recruitment models of dynamin indicated at the bottom. The quality of the fit increases with more-negative BIC values. The dynamin2 substitution by dynamin2-EGFP was kept as a fixed parameter corresponding to the value estimated by Western blot analysis (98%). The best fit corresponds to a recruitment model of 8% monomers, 49% dimers, 26% tetramers, 6% hexamers, and 11% octamers. (C) Histogram of the background-corrected fluorescence intensity of the steps (gray) used to calculate the data in B; the continuous trace (dark blue) is the sum of the relative contributions calculated by the presence of one, two, three, four, and so on dynamin2-EGFP molecules (light blue; centered at 6050 ± 2200, 12,100 ± 4400, 18,150 ± 6600, 24,200 ± 8800, etc.) according to the best model presented in B. Inset, preferential recruitment of dynamin2 dimers (49%) and the less frequent recruitment of dynamin2 monomers (8%), tetramers (26%), hexamers (6%), and octamers (11%).
The model that gave the best fit, based on a Bayesian information criterion (BIC; Jaqaman and Danuser, 2006; see Materials and Methods; Figure 9B) had a dimer as the principal recruitment species, with events corresponding to addition of one (8%), two (49%), four (26%), six (6%), and eight (11%) dynamin molecules. The fit was performed using the ratio of dynamin2-EGFP to untagged dynamin of 49:1, corresponding to the experimental value from Western blot analysis of a large pool of cells (Figure 2C). We found very poor fits with calculations that assumed significantly different recruitment models (Figure 9B). We conclude that a dimer is the principal species that incorporates into a coated pit; we detected some steps of four, six, and eight within the 110-ms time resolution of our measurements, but we interpret these as two, three, or four dimers associating in rapid succession. Because photobleaching set a limit of ∼20 s for our time series, we could not follow early and late stages of a single coated pit. Dynamin accumulation was very rapid for events with high fluorescence intensities, which presumably corresponded to the burst phase, and we could not determine a step size with the available time resolution. We further conclude that monomers barely contribute and that there is no preference for a tetramer in the initial step.
DISCUSSION
Our analysis of dynamin recruitment during assembly of endocytic clathrin-coated pits yields two principal conclusions. First, dynamin dimers are the preferred assembly units. Second, accumulation of ∼26 dynamin molecules (∼13 dimers) at the neck of a budding vesicle is enough to drive scission. A single turn of the helical sheath formed in the presence of nonhydrolyzable GTP analogues thus appears to be both necessary and sufficient for membrane fission.
We resolved recruitment into an early, gradual phase, which parallels growth of the clathrin coat, and a late, burst phase, which accompanies scission of the coated vesicle neck. The burst invariably leads to uncoating of the budded vesicle. Recruitment is a succession of consecutive steps—usually arrival together of 2 dynamins (one dimer), less frequently of 4, and rarely of >4. Infrequently, we detect arrival of monomers. The distribution of total accumulated dynamin molecules peaks at ∼40 (20 dimers), with a peak of ∼26 if we count just the burst. In essentially no cases do we detect more than a total of ∼80 (with a maximum for the bursts of ∼52). There was no relationship between the number of accumulated dynamins and the lifetime of the pits. Our analysis, based on data representing >426 pits in five SUM159 (SUM-Dyn2) and 337 pits in three SK-MEL-2 (hCLTAEN/DNM2EN) cells edited in both alleles of dynamin2 to express dynamin2-EGFP, showed a continuous distribution in the amount of dynamin recruited at the time of budding. Data obtained from a significantly smaller set (40 pits in three DNM2EN cells gene-edited in both alleles of dynamin2 to express dynamin2-EGFP) suggested that the recruitment of dynamin was quantized at the time of budding, with an average of 24 dynamins in 50% of the pits, an average of 44 dynamins in 39% of the pits, and 77 dynamins in the remaining 9% (Grassart et al., 2014). We believe that the apparently quantized recruitment is a result of the very small size of the data set, as we found a continuous distribution from a significantly larger data set obtained with the same parental cells (Figure 6).
In cells depleted of dynamin by RNAi, the distribution peaks at 26–28, with the burst accounting for nearly all of the recruited dynamin. These results, when combined with published biochemical data, are at odds with models in which the forces driving membrane fission come from concerted conformational changes in a dynamin collar based on the single-start helix generated by in vitro assembly (Warnock et al., 1996; Smirnova et al., 1999; Stowell et al., 1999; Praefcke and McMahon, 2004; Bashkirov et al., 2008); they favor instead a role for GTP hydrolysis and conformational change at or near the leading edge of a helical dynamin assembly (Morlot et al., 2012; Shnyrova et al., 2013). It is possible that the long-term depletion of dynamin2 by the small interfering RNA (siRNA) treatment might increase the expression of other proteins with compensatory activity for membrane scission, thereby reducing the dependence on dynamin. A compensatory fission activity was observed in vitro using tubular lipid templates exposed to dynamin and nonphysiological amounts (micromolar) of BAR domain–containing proteins, which presumably drove membrane tubulation (Neumann and Schmid, 2013). In vivo, where neck formation is driven primarily by the assembly of the clathrin coat, most of the budding coated pits detected in the dynamin2-depleted cells recruited 26–28 dynamin2 molecules, the same as the threshold value observed for pits in cells expressing normal amounts of dynamin2. Thus we believe that a compensatory mechanism is unlikely to have affected the number of dynamin2 molecules recruited under conditions of siRNA treatment.
A dynamin dimer is the preferred assembly unit
In vitro measurements using chemical cross-linking or sedimentation equilibrium show that soluble dynamin is an equilibrium mixture of monomers, dimers, and tetramers (Binns et al., 1999), with a preponderance of dimers at 60 nM (Tuma and Collins, 1995) and of tetramers at 1 μM (Hinshaw and Schmid, 1995; Muhlberg et al., 1997; Ramachandran et al., 2009). We do not have a measurement of the absolute abundance of dynamin in a cell, but assuming 0.05% of total protein, we estimate that its concentration falls between these numbers. Consider as an example 400 pg of protein in a HeLa cell; if 90 kDa is the mean molecular weight, then there is 10−14 mole/cell or 10−17 mole of dynamin at 0.05%; if the HeLa cell has a radius of 15 μm, then V ≈ 104 μm3 or 10–5 μl, and concentration is ∼0.5 μM.
As shown in Figure 9C, recruitment steps having amplitudes of two and four dynamins, respectively, were in a ratio of roughly 2:1; steps with larger amplitudes made up <20% of the total. We probably failed to resolve some successive dimers (or tetramers) because of the sampling interval, limited by the 110-ms time resolution of our configuration.
The data do not, of course, specify the molecular contacts present in the dimeric species that predominates. We regard it as unlikely that the recruited dimer has a head–head contact. The rate of spontaneous GTP hydrolysis for dynamin in solution is ∼0.04 s−1; the rate for assembled dynamin is at least 50- to 100-fold higher (Warnock et al., 1996; Binns et al., 1999; Stowell et al., 1999). The latter presumably derives from the interdimer head–head contacts that develop when two (or more) dimers come together on the same membrane. Head–head contacts in solution would produce futile cycles of GTP hydrolysis. The interaction likely to form the dimeric assembly unit is an extensive twofold contact in the crystal structures of ΔPRD-dynamin1 (Figure 1). The contacts in both structures (rat and human) are essentially identical, and the interacting amino acid residues are strictly conserved among all dynamins1 and 2. This dimer fits well into the cryo-EM reconstruction of a GMPPCP-stabilized dynamin tube (Chappie et al., 2011; Figure 1).
Minimum number of dynamins in a productive burst
The distribution of burst amplitudes, measured in gene-edited hCLTAEN/DNM2EN cells (Figure 6), with ∼50% of dynamin2 retaining its EGFP tag, and in gene-edited SUM-Dyn2 cells (Figure 5), with all of dynamin2 tagged, shows that ∼30–40% of the scission-producing events occur with a burst of 26–28 dynamin molecules, although some transfer of dynamins from the pool accumulated during the gradual phase into the burst-producing structure will probably raise this estimate. These experiments were carried out in both cell types, with ∼50% loss of the EGFP tag in one and negligible loss in the other, so the estimate of the size of the burst is independent of apparent substitution level. Depletion of total dynamin by RNAi often reduced the plateau of the first phase to the level of background, and in those experiments, a substantial fraction (50%) of the events contained 26–30 dynamins. These results indicate that about one turn of the single-start helix is sufficient to produce scission, whether or not dynamins in the initial phase contribute.
Biochemistry of dynamin GTP hydrolysis
Two observations from the literature are relevant to any consideration of models for dynamin action. One shows a relatively modest degree of cooperativity, despite the apparent requirement for coordinated action of a large number of molecules. Thus several studies of GTP hydrolysis by assembled dynamin yield a Hill coefficient of ∼2 (Tuma and Collins, 1994; Stowell et al., 1999). This result leads to the likely conclusion that GTP hydrolysis at the interface of two GTPase heads, each with an active site, is the only source of measurable cooperativity. The other relevant observation is the number of GTP hydrolysis events, ∼15, needed to break a lipid tube under modest tension (Morlot et al., 2012). Roughly seven or eight pairs of heads must engage to produce this number, or fewer if there is repeated use of one or more paired GTPases.
Models for the scission mechanism
What constraints on a picture of dynamin-generated scission do our data impose? We consider the helical cryo-EM reconstruction of a GMPPCP-stabilized dynamin assembly as the most likely model for the initial state of a dynamin collar at the neck of a coated pit. Fitting models derived from x-ray crystal structures into the cryo-EM map (Chappie et al., 2011) shows that one turn of the prominent spiral of density on the outside of the tube contains between 13 and 14 dynamin dimers, with their GTPase heads projecting alternately in opposite directions along the helix axis. If dynamin assembly proceeds by successive addition of dimers along this helical path, head–head contacts (and hence stimulated GTPase activity) will begin to form only during assembly of the second turn of the single-start helix. More specifically, head–head contacts are between dimers i and i + 12. Our data then show that accumulation of even a small segment of the second turn can lead to scission.
At intracellular GTP concentrations, essentially all the free dynamin will have GTP in the nucleotide-binding site. The duration of the dynamin burst in our experiments is <10 s. The rate of assembly is therefore >3 dimers/s—somewhat faster than the stimulated GTP hydrolysis rate (∼1 s−1; i.e., a lifetime of ∼2 s for a dimer loaded with two GTPs). Thus, if assembly follows the principal single-start helix in the GMPPCP sheath, part of a second turn can form before any of the contacting pairs of GTPase domains have hydrolyzed their bound nucleotides. The relatively low cooperativity of GTP hydrolysis nonetheless implies that passage of two paired domains to a GDP-Pi bound state can probably occur at any time after they make contact. Agreement of the minimum number of dynamins required for scission with the minimum number needed to generate at least one head–head interaction is consistent with assembly along the principal helix.
The radius of the membrane tubule within a GMPPCP dynamin sheath is ∼5 nm (from the axis to the center of the bilayer; Chappie et al., 2011). Spontaneous hemifission is believed to require a radius of ∼3 nm (Kozlovsky and Kozlov, 2003). Conformational changes in a dynamin collar could produce such a contraction either by a rotation of the stalks toward a more radial orientation, forcing the PH domains inward while leaving the helical parameters of the outer layer more or less unchanged, or by a decrease in the number of dynamins per turn of the helix, reducing both its outer and inner diameter without changing the radial disposition of the stalks. These two alternatives correspond roughly to the models proposed by Chappie et al. (2011) and by Smirnova et al. (1999) and Faelber et al. (2011). The former is, in its simplest form, an isotropic squeeze (Figure 10A); the latter, a circumferential twist (Figure 10B and Supplemental Movies S1–S3). The isotropic contraction model requires nearly a full turn of paired GTPase domains—that is, nearly two turns of the basic helix. The circumferential twist model requires simply that the assembly reach a state in which one or more pairs of GTPase domains interact. Our data appear to favor the latter picture.
FIGURE 10:
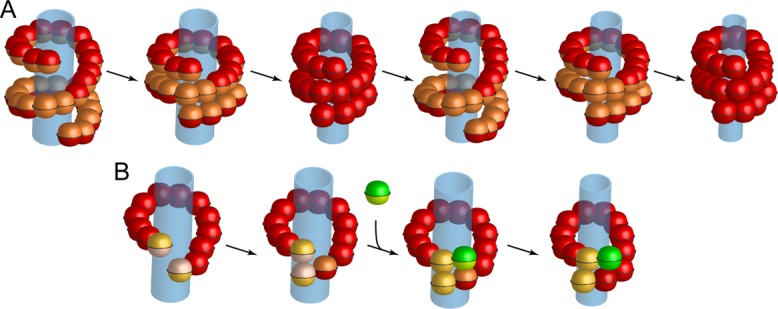
Proposed models for dynamin-mediated scission. (A) Isotropic contraction model requiring close to two turns of the basic helix. Consecutive cycles of GTPase activation between domains phasing opposing rungs provide the power stroke that ultimately compresses the spiral to reach conditions of membrane hemifission and eventual membrane scission. (Adapted from Faelber et al., 2011.) (B) Circumferential twist model proposed in this study, in which two dimers at the leading edge of a dynamin rung interact through their opposing GTPase domains (yellow). Activation of the GTPase activity induces a local conformational change—in effect, a power stroke that locally tightens the approaching ends of the assembled rung. To this effect, arrival of a dynamin dimer (green) to one of the rung ends (yellow) results in the GTPase activation and conformational change of the opposing domains (green and red) associated with the next power stroke. A limited number of such sequential additions would be sufficient to tighten the rung, eventually leading to membrane hemifission and membrane scission.
A progressive, circumferential twist model is consistent with the properties of a mutation, Q40E, at the GTPase dimer interface (Liu et al., 2013). The mutation has no effect on the basal GTPase activity, and it does not prevent formation of a dynamin sheath, either in vitro or in vivo. It does, however, eliminate assembly-stimulated GTPase activity. When coassembled with wild-type dynamin, it has a strong, dominant-negative effect on membrane tubule fission in vitro but little dominant-negative effect on the wild-type, assembly-stimulated GTPase activity. Any process requiring a number of successive steps will be more sensitive to poisoning of any one of those steps than will a concerted process, which can generally bring along with it changes in any inactive but still compliant components. Thus we expect a progressive twist mechanism to be more sensitive to introduction of GTPase heads that cannot pair functionally with another GTPase one helical turn away than a concerted contractile mechanism.
Any twist model for constriction must include a mechanism to prevent the membrane neck from expanding back against the dynamin collar. That is, the collar must retain its integrity, even if one turn slides against another. Concerted GTPase activity throughout the region in which one turn overlaps the next could cause the structure to pass through a transition point in which weak GTPase domain contacts would allow the membrane and collar to spring back. Uncoordinated GTP hydrolysis implies that transient instability of one interturn contact will not disengage the entire assembly.
Studies of dynamin activity on membrane tubules in vitro show that scission occurs at the edge of an extended dynamin sheath, where an abrupt change in membrane curvature alters the membrane elastic energy (Morlot et al., 2012; Shnyrova et al., 2013). A bead attached to the sheath rotates with respect to the membrane tubule, and measurements of the corresponding torque on the membrane indicate that the forces involved are strong enough to overcome the barrier to hemifission, the likely intermediate in a leakage-free process (Bashkirov et al., 2008; Morlot et al., 2012). These observations imply a change in the helical parameters of the dynamin assembly at the edge of the sheath, but they do not require a concerted change throughout its length. Indeed, the rate of tubule breakage is independent of sheath length, over a range from 150 nm to 10 μm, indicating that whatever conformational changes occur are probably confined to the edge (Morlot et al., 2012). A mechanism in which GTP hydrolysis generates constriction by a motor-like mechanism, with one or more dynamin dimers at the edge of a sheath “walking” along those in the next turn, is analogous to a propagating dislocation at the edge of a two-dimensional crystal. Contacts between heads in the GTP-bound state (represented by GMPPCP) are weaker than those in the transition state (represented by GDP-AlF4−)(Chappie et al., 2011), and the conformational change on passage of one or more paired heads from a substrate-bound conformation to a transition-state conformation might in principle drive a shift in register of the remaining pairs in the overlap region. Available structures do not yet allow us to decide on the plausibility of this sort of model—for example, whether the “swing” of the BSE could move one turn a reasonable distance with respect to another in a zone of partial overlap. A propagating dislocation model is nonetheless fully compatible with our finding that one complete turn of the dynamin helix will drive budding of a coated pit, because it suggests that the mechanism of scission at the edge of sheath is essentially the same as scission by a one-turn collar.
MATERIALS AND METHODS
Reagents
Human SK-MEL-2 cells and the corresponding gene-edited hCLTAEN/DNM2EN cells were a kind gift of D. Drubin (University of California, Berkeley, Berkeley, CA); the alleles of dynamin2 and clathrin light chain A in hCLTAEN/DNM2EN were replaced with dynamin2 fused at its C-terminus to EGFP and clathrin light chain A fused at its C-terminus to RFP, respectively. J. Brugge (Harvard Medical School, Boston, MA) kindly provided the human SUM159 cells. The mammalian expression vector mCherry-LCa based on pmCherry (Clontech, Mountain View, CA) was made by fusing mCherry to the N-terminus of rat brain clathrin light chain A.
Mouse monoclonal antibody against dynamin1 (Clone D5; Oncogene Research Products, San Diego, CA), goat polyclonal antibody against dynamin2 (C-18; Santa Cruz Biotechnology, Dallas, TX), and horseradish peroxidase–conjugated secondary antibodies (GE Healthcare, Little Chalfont, United Kingdom, or Invitrogen, Carlsbad, CA) were used for Western blot analysis.
Biotinylated fibronectin was prepared by 1-h incubation at room temperature of 0.2 μM fibronectin (Sigma-Aldrich, St. Louis, MO) with 1 μM NHS-LC-Biotin (Pierce, Rockford, IL) freshly made in phosphate-buffered saline (PBS), followed by overnight dialysis (Slide-A-Lyzer, minidialysis unit; size cutoff, 104 Da; Thermo Scientific, Barrington, IL) at 4°C against filtered PBS. Biotinylated fibronectin was stored at −20°C in the presence of 20% glycerol.
Chemicals were purchased from Sigma-Aldrich unless specified otherwise.
Cell handling
All cells were grown and imaged at 37°C and 5% CO2. SUM159 cells were grown in DMEM/F12/Glutamax (Life Technologies, Grand Island, NY), supplemented with 5% fetal bovine serum (FBS), 100 U/ml penicillin and streptomycin (Life Technologies), 1 μg/ml hydrocortisone (H-4001; Sigma-Aldrich), 5 μg/ml insulin (128-100; Cell Applications, San Diego, CA), and 10 mM 4-(2-hydroxyethyl)-1-piperazineethanesulfonic acid (HEPES), pH 7.4. Sum-Dyn2 cells stably expressing mCherry-LCa were obtained by transfection. hCLTAEN/DNM2EN cells were grown in DMEM/F12/Glutamax supplemented with 10% FBS and 100 U/ml penicillin and streptomycin. Cells (2 ml of medium containing 4 × 10⁴ cells) were placed on top of a coverslip in a six-well plate and imaged 12–24 h after plating.
Gene editing
SUM159 cells were gene-edited to replace dynamin2 with dynamin2 fused at its C-terminus to EGFP using a TALEN-based protocol (Sanjana et al., 2012). The upstream targeting sequence 5′-TCCCTGCTCGACTAGGCCTC-3′ overlapped the dynamin2 TAG stop codon (underlined), whereas the downstream targeting sequence 5′-TGCGTGAGGCCCCCCCGAGA-3′ was located 13 nucleotides downstream (Figure 1A).
The “donor construct” used as template for the homologous recombination step was generated by fusion of two ∼800-nucleotide fragments of genomic DNA upstream and downstream of the stop codon of dynamin2 and the open reading frame of EGFP into the pCR8/GW TOPO vector (Life Technologies). The genomic fragments were obtained using two independent PCR amplification reactions from DNA extracted from SUM159 cells using the QiaAmp DNA mini kit (Qiagen, Valencia, CA); the fragments obtained with primers F1-R1 and F3-R3 spanned ∼800 nucleotides upstream and 800 nucleotides downstream of the dynamin2 stop codon. The open reading frame encoding EGFP was obtained by PCR using primers F2-R2 from an expression plasmid vector. The PCR products were purified, mixed and used for overlap PCR amplification using primers F1 and R3. The resulting 2300-nucleotide product was introduced into pCR8/GW TOPO by TA ligation cloning and verified by DNA sequencing.
The sequence of the primers (Integrated DNA Technologies, Coralville, IA) was as follows:
| Dyn2 up | F1 GAGCGTGTTTGCCAACAGTGACCTC |
| Dyn2 up | R1 GTCGAGCAGGGATGGCTCGGCT |
| Dyn2 EGFP | F2 GCCGAGCCATCCCTGCTCGACgatccaccggtcgccaccCTG |
| Dyn2 EGFP | R2 CCCGAGAGCACGCCCCCCTCGAGGCttacttgtacagctcgtccatg |
| Dyn2 down | F3 GGGGCGTGCTCTCGGG |
| Dyn2 down | R3 GAATACAGAGTGCAGGCACTTACAG |
SUM159 cells were cotransfected with 600 ng each of the upstream and downstream targeting sequences and the pCR8/GW vector containing the donor construct dissolved in a total volume of 250 μl of OptiMEM (Life Technologies) into which 5.4 μl of TransIT 2020 Transfection Reagent (Mirus Bio, Madison, WI) was then added for a 15-min incubation at room temperature; the transfection mixture was added dropwise to 1.5 × 10⁵ SUM159 cells plated the day before in six-well plates containing 1.5 ml of complete medium.
Identification of cells gene-edited in both alleles for dynamin2-EGFP took ∼3 wk and was carried out by a combination of cell sorting as follows: transfected cells were transferred from the single six-well dish into a T175 dish and subjected to fluorescence-activated cell sorting (FACS) upon reaching confluency (∼10 × 106 cells). FACS was carried out using a FACSAria 2-SORP (BD Biosciences, San Jose, CA) instrument equipped with a 300-mW, 488-nm laser and a 70-μm nozzle; cells were detached by trypsinization, centrifuged briefly at 400 × g, resuspended in 2 ml of PBS, and filtered through a 40-μm sterile cell strainer (BD Biosciences). Approximately 104 of SUM159 cells (1%) showing a fluorescence signal significantly higher than that of control nontransfected cells were sorted and grown to confluency in a T175 flask; these cells were subjected to a second round of FACS, and ∼5% (those with the highest fluorescence signal) were isolated, expended in a T175 flask, and frozen. Generation of clonal lines for cells gene-edited in both alleles for dynamin2-EGFP expression was carried out by single-cell flow cytometry sorting in a 96-well plates and then maintained in 12-well plates and split 1:6 at the time they reached confluency. Identification of clone D3, herewith named SUM-Dyn2, with both alleles modified to express dynamin2-EGFP was done by genomic PCR amplification from genomic DNA purified with the QIAamp DNA Mini Kit (Qiagen) using GoTaq Polymerase (Promega, Madison, WI) and the forward 5′-GTCAAACAGCAGGCGAGTTG-3′ and reverse 5′-CAGCGTTAAGGAAGAGGCCA-3′ primers. These two primers map in the genomic sequence of dynamin2 in the region close to the stop codon: the amplification wild-type dynamin2 corresponds to a 395–base pair product, whereas insertion of EGFP results in a 1130-nucleotide product. Expression of dynamin2-EGFP instead of dynamin2 was confirmed by Western blot analysis.
Glass coverslip preparation
Glass coverslips (#1.5; Warner Instruments, Hamden, CT) were cleaned and then coated with a copolymer of poly-l-lysine (PLL) and biotinylated poly(ethylene glycol) (PEG; Susos AG, Dübendorf, Switzerland) as described (Böcking et al., 2011; Cocucci et al., 2012). These PEG-modified coverslips were coated with fibronectin and used to plate cells imaged with TIRF microscopy. Clean coverslips without the PEG modification were used to plate cells imaged with spinning-disk fluorescence microscopy. Clean coverslips were also used to capture dynamin2-EGFP molecules and then used to calibrate the fluorescence intensity signal of single molecules of EGFP visualized by TIRF or spinning-disk fluorescence microscopy; diluted cytosol containing dynamin2-EGFP was placed on clean coverslips immediately after a 3-min glow discharge period at 50 mA (Electron Microscopy Science, Hatfield, PA).
Cell extracts and Western blotting
Cytosolic extracts were prepared from bovine brain (Boll et al., 1996) or from three 10-cm dishes containing SUM-Dyn2 or hCLTAEN/DNM2EN cells grown to confluency. Cells were washed three times in PBS and solubilized at 4°C for 5 min in 300 μl of 50 mM HEPES, pH 7.4, 150 mM NaCl, 15 mM MgCl2, 1 mM ethylene glycol tetraacetic acid, 10% glycerol, 1% Triton X-100, and a protease inhibitor cocktail (Roche, Branford, CT); nuclei were removed by low-speed centrifugation (800 × g, 5 min, 4°C, Centrifuge 5417R; Eppendorf, Hauppauge, NY). Western blot analysis was carried out as described (Cocucci et al., 2012).
Transferrin uptake by flow cytometry
SUM159 cells, plated in 12-well plates and grown to 80% confluency, were washed in PBS and incubated for 10 min with 5 μg/ml Transferrin-Alexa Fluor 647 (transferrin-A647; Life Technologies) at 4 or 37°C. After incubation, the plates were cooled on ice, rinsed with ice-chilled PBS, and briefly incubated or not twice with 150 mM NaCl, 1 mM MgCl2, 0.125 mM CaCl2, and 0.1 M glycine, pH 2.5, to remove the surface-bound transferrin-A647. The cells were then resuspended for 3 min at 37°C by treatment with 0.05% trypsin-EDTA (Life Technologies), rinsed with 700 μl SUM media, and resuspended in 200 μl of PBS containing 1% bovine serum albumin and 0.5 mM EDTA at 4°C. The amount of transferrin associated with each cell, reflecting the extent of endocytosis, was determined by flow cytometry as the mean fluorescence intensity of transferrin-A647 after the acid wash using the 633-nm laser line of the FASCSCanto2 (BD Biosciences).
Depletion of dynamin2 by siRNA treatment and selection of cells for visualization
siRNA treatment of SUM-Dyn2 cells was carried out by transfection of cells grown in six-well plates to a density of 80%. We used 20 nM siRNA (Dharmacon, Fisher Scientific, Pittsburgh PA) of sequence 5′-GACAUGAUCCUGCAGUUCAUU-3′ or a scrambled negative control for transfection with Lipofectamine RNAiMAX (Life Technologies). The day after transfection, the cells were trypsinized and replated at ∼20% confluency in six-well plates and allowed to grow for additional 3 d, after which ∼50 × 103 cells were plated onto coverslips placed in a six-well plate and imaged 24 h later.
Before imaging, the coverslip was placed for 10 min on a temperature- and humidity-controlled microscope stage containing 1 ml of prewarmed MEMα without phenol red (Gibco, Langley, OK) supplemented with 1% FBS to allow temperature equilibration to 37°C. At this point, transferrin-A647 was added at 5 μg/ml and cells incubated for 7 min. Cells with normal or depleted levels of dynamin2-EGFP were selected for imaging as follows: cells with normal levels of dynamin showed active coated-pit dynamics and accumulation of transferrin in endosomes; cells depleted of dynamin were impaired in coated-pit dynamics at the cell surface together with increased fluorescence intensity of the clathrin structures, decrease of the cytosolic diffuse signal of dynamin2-EGFP, and accumulation of fluorescence transferrin at the cell surface. Western blot analysis of dynamin2 levels in cells treated with siRNA was not deemed informative as a way to determine the overall efficiency of dynamin2 depletion because <10% of the cells showed full loss of active pit dynamics and associated inhibition of transferrin uptake.
Osmotic shock
Cells were subjected to a brief, 10-min incubation with iso-osmotic, hypo-osmotic, or hyper-osmotic medium, followed by acquisition in the same medium of a 200-s time series using spinning-disk confocal microscopy consisting of 200 frames acquired every second. Hypo-osmotic medium was prepared by mixing one volume of MEMα without phenol red (Gibco) containing 1% FBS with water also containing 1% FBS. Hyper-osmotic medium was made by dissolving sucrose to 0.25 M in MEMα without phenol red containing 1% FBS.
Live-cell imaging and fluorescence calibration
Spinning-disk confocal fluorescence microscopy and TIRF microscopy were done using Marianas-based systems (Intelligent Imaging Innovations, Denver, CO). Both systems were controlled with SlideBook V5.0 (Intelligent Imaging) operating under Windows 7 on a computer with 12 GB of RAM (Dell, Round Rock, TX). The spinning-disk confocal microscopy system was based on a fully enclosed, environmentally temperature controlled Axiovert 200M microscope equipped with a 100×/1.4 numerical aperture objective (Carl Zeiss Microimaging, Thornwood, NY), a CSU-22 spinning-disk confocal head (Yokogawa Electric, Tokyo, Japan) modified with a photon expansion Borealis upgrade (Andor, Belfast, UK), and computer-controlled piezo-Z stage equipped with a linear X&Y encoder (Applied Scientific Instruments, Eugene, OR). A 1.5× magnification lens placed in front of the cooled electron multiplication charge-coupled device (CCD) camera (QuantEM 512SC; Photometrics, Tucson, AZ) provided a final pixel size corresponding to 100 nm of image. The excitation was provided by solid-state lasers operating at 491, 561 (Coherent, Santa Clara, CA), and 660 nm (CrystaLaser, Reno, NV) coupled to an acousto-optical tunable filter for rapid wavelength switching and power control; images were acquired using 525/50, 620/60, and 680 long-pass emission filters (Semrock, Rochester, NY). The illumination power at the back aperture of the objective was 3.6 mW at 491 nm, 3.4 mW at 561 nm, and 1.7 mW at 660 nm. Time series were acquired every 1 s, with an exposure of 30 ms/frame unless otherwise indicated.
The TIRF microscopy imaging system was as described (Cocucci et al., 2012), except that the spherical aberration correction system was replaced by a 2× magnification lens placed in front of the CCD camera, such that the final pixel size corresponded to 80 nm of image. The incidence angle of the excitation light on the coverslip was adjusted to generate an evanescent field with a penetration depth of ∼100–200 nm. The illumination power at the back aperture of the objective was 3.3 mW. Time series were acquired every 110 ms, with an exposure of 60 ms/frame.
Glass coverslips with plated cells were washed with sterile PBS, placed in an Attofluor Cell Chamber (Invitrogen), and layered with 1 ml of prewarmed MEMα without phenol red (Gibco) supplemented with 1% FBS. The chamber was then placed into a heated sample holder (20/20 Technology, Wilmington, NC) placed inside the environmentally controlled chamber of each microscope.
We used our previously developed imaging procedures and analytical tools to confirm that we could detect the fluorescence from a single dynamin2-EGFP (Cocucci et al., 2012; Kural et al., 2012). Cytosol extracts from SUM-Dyn2 were used to determine the fluorescence intensity of a single molecule of EGFP by single-step photobleaching under conditions of continuous TIRF or spinning-disk fluorescence illumination (Cocucci et al., 2012; Kural et al., 2012). The cytosol extract was diluted ∼1000 times in PBS and then placed on top of a freshly glow-discharged glass coverslip for 5 min. The samples were subjected to continuous illumination, using 60-ms or 2-s exposure/frame for TIRF or spinning-disk confocal microscopy, respectively. The fluorescence intensity of diffraction-limited spots profiles was determined by summing the intensities in a 5 × 5–pixel region centered on the spot subtracted from the local background (TIRF) or as the amplitude of the Gaussian fluorescence intensity profile obtained by applying a two-dimensional Gaussian-fitting function (spinning disk). The fluorescence intensity traces were fitted using a step fitting function (Smith, 1998). The distribution of fluorescence intensity loss associated with a photobleaching step obeyed a normal distribution, and the mean of that distribution corresponded to fluorescence from a single EGFP (Cocucci et al., 2012).
Image analysis
The preferential assembly unit of cytosolic dynamin was determined in SUM-Dyn2 cells as described (Cocucci et al., 2012) by following the incorporation of dynamin2-EGFP into coated pits using live-cell imaging data obtained by TIRF. The centroid of diffraction-limited spots was obtained using u-track software (Jaqaman et al., 2008) with psfSigma, 1; integWindow, 1; alphaLocMax, 0.12; and numSigmaIter, 3. Tracking was constrained to objects that remained for at least 15 consecutive frames (∼1.7 s) and with gaps of <5 frames. The selected traces persisted for 10 s or more and accumulated up to 23 ± 11 dynamin2-EGFP (mean ± SD). A step detection function (Smith, 1998) was applied to each selected trace to obtain the number of dynamins recruited per step and the associated dwell time.
The probability of a particular number of molecules being present in the step (e.g., as (dimer, tetramer, etc.) is ai, such that  . The total expected distribution of EGFPs as a weighted sum of binomial distributions for each step is
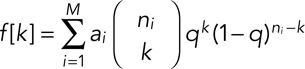 |
where q (98%) is the substitution probability derived from the Western blot data, ni is the maximum number of fluorophores for each value of i, and M is the maximum number of molecules included in the model for that step. From this distribution, the corresponding cumulative intensity distribution is calculated as
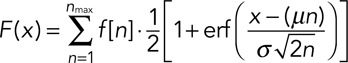 |
where nmax is the maximum number of fluorophores in f[k] and μ and σ are the mean and SD of the intensity of a single molecule, respectively; the values of μ and σ were obtained from the single-molecule dynamin2-EGFP calibration. During the fit of F to the measured cumulative intensity distributions, the parameter ai was estimated for a given configuration of the assembly unit of dynamin (e.g., monomer, dimer, tetramer, hexamer, and octamer). Different models were created by the iterative addition of components to the simplest possible initial description (e.g., one monomer is recruited during each step, or monomer is the only oligomeric state present in the cytosol). Selection of the best combination of models was based on the BIC used to prevent overfitting of the data (Jaqaman and Danuser, 2006). The BIC with the lowest value was the best descriptor of the data; it defines an optimal trade-off between the likelihood of a model and the number of parameters used in the model description. Its value decreased with the model likelihood and increased with the number of model parameters used to fit the data.
Independent confirmation for the extent of substitution determined by Western blot analysis from SUM-Dyn2 cell extracts was obtained by comparing mathematical models of different dynamin2 assembly units (monomer, dimer, tetramer, combinations of dimers and tetramers, etc.) and variable substitution with the experimental data from the SUM-Dyn2 cells used to determine the preferential assembly unit of dynamin; the BIC was then used to search for the model that would best fit the experimental data.
The amount of dynamin recruited to coated pits was determined in SUM-Dyn2 and hCLTAEN/DNM2EN cells from data obtained by spinning-disk confocal fluorescence microscopy using the cmeAnalysis software with clathrin as the “master” and dynamin as the “slave” (Aguet et al., 2013). Parameters used for the detector were Sigma, 1.1, and Alpha, 0.05; valid tracking was constrained to objects containing less than two gap lengths, at least five frames in length, and with <3-pixel shift between consecutive frames. Clathrin traces >25 s in duration were binned as valid coated pits, whereas shorter ones were classified as abortive pits. Clathrin traces present during the full duration of the time series were classified as persistent coated plaques. Not included in the analysis were objects rapidly appearing or disappearing and objects whose dynamics were truncated by the initiation of end of the time series. All objects reported in this study were validated by visual inspection; this verification was necessary because the fluorescence signal elicited by mCherry-LCa or by LCa-RFP was not strong enough for reliable automatic selection.
The number of dynamin2-EGFPs recruited to a coated-pit spot was obtained from the fluorescence intensity of dynamin2-EGFP on the diffraction-limited spot calibrated by the mean intensity of single dynamin2-EGFP obtained by the single-step photobleaching determination. The number of recruited dynamin2 molecules was then calculated by taking into account the extent of substitution estimated by Western blot analysis (98% in SUM-Dyn2 cells, 50% in hCLTAEN/DNM2EN cells). The data are presented as histograms and as cumulative intensity distributions; the estimated error associated with the determination of the number of dynamins shown in the cumulative intensity distribution plot corresponds to the range between 5th and 95th percentiles of the data defined by convolving the binomial distribution function accounting for the extent of substitution and the normal distribution of the fluorescence intensity of single dynamin2-EGFPs.
The total number of recruited dynamins is the number measured at the time the coated pit fully formed; it represents the total accumulation due to the first and second recruitment phases. The number of dynamins recruited during the second phase was calculated by subtracting the total fluorescence intensity from the average value obtained from three consecutive frames at 9, 10, and 11 s before the peak value at the end of coated-pit formation.
Supplementary Material
Acknowledgments
We thank S. C. Harrison for discussions, creation of Figure 1, and editorial help, E. Marino for maintaining the Imaging Resource, and François Aguet, Srigokul (Gokul) Upadhyayula, and members of our laboratory for discussions. We thank Greg Findlay and Nong Dang for helping prepare the TALEN reagents used for gene editing. We thank Janet Iwasa for the animation representing our assembly model of dynamin. We also thank D. Drubin for generously providing the SK-MEL-2 cells and the gene-edited hCLTAEN/DNM2EN cells and J. Brugge for the SUM159 cells. This work was supported by National Institutes of Health Grants GM-075252 and U54 AI057159 (New England Regional Center of Excellence in Biodefense and Emerging Infectious Disease, Core Imaging Facility) to T.K.
Abbreviations used:
- Bar domain
Bin–Amphiphysin–Rvs domain
- BIC
Bayesian information criterion
- BSE
bundle signaling element
- cryo-EM
cryo–electron microscopy
- dyn2
dynamin 2
- EGFP
enhanced green fluorescent protein
- GDP-AIF4–
GDP activated with aluminum fluoride
- GMPPCP
β-γ-methyleneguanosine 5'-triphosphate
- GTPase
GTP-hydrolyzing enzyme
- LCa
clathrin light chain A
- PH domain
Pleckstrin homology domain
- PRD
dynamin proline-rich domain
- RFP
red fluorescent protein
- SUM-dyn2
SUM159 clone gene edited for dynamin2-EGFP in both alleles
- TALEN
transcription-activated–like effector nuclease
- TIRF
total internal reflection fluorescence.
Footnotes
This article was published online ahead of print in MBoC in Press (http://www.molbiolcell.org/cgi/doi/10.1091/mbc.E14-07-1240) on September 17, 2014.
REFERENCES
- Aguet F, Antonescu CN, Mettlen M, Schmid SL, Danuser G. Advances in analysis of low signal-to-noise images link dynamin and AP2 to the functions of an endocytic checkpoint. Dev Cell. 2013;26:279–291. doi: 10.1016/j.devcel.2013.06.019. [DOI] [PMC free article] [PubMed] [Google Scholar]
- Bashkirov PV, Akimov SA, Evseev AI, Schmid SL, Zimmerberg J, Frolov VA. GTPase cycle of dynamin is coupled to membrane squeeze and release, leading to spontaneous fission. Cell. 2008;135:1276–1286. doi: 10.1016/j.cell.2008.11.028. [DOI] [PMC free article] [PubMed] [Google Scholar]
- Binns DD, Barylko B, Grichine N, Atkinson MA, Helms MK, Jameson DM, Eccleston JF, Albanesi JP. Correlation between self-association modes and GTPase activation of dynamin. J Protein Chem. 1999;18:277–290. doi: 10.1023/a:1021083211267. [DOI] [PubMed] [Google Scholar]
- Böcking T, Aguet F, Harrison SC, Kirchhausen T. Single-molecule analysis of a molecular disassemblase reveals the mechanism of Hsc70-driven clathrin uncoating. Nat Struct Mol Biol. 2011;18:295–301. doi: 10.1038/nsmb.1985. [DOI] [PMC free article] [PubMed] [Google Scholar]
- Boll W, Ohno H, Songyang Z, Rapoport I, Cantley LC, Bonifacino JS, Kirchhausen T. Sequence requirements for the recognition of tyrosine-based endocytic signals by clathrin AP-2 complexes. EMBO J. 1996;15:5789–5795. [PMC free article] [PubMed] [Google Scholar]
- Boulant S, Kural C, Zeeh J-C, Ubelmann F, Kirchhausen T. Actin dynamics counteract membrane tension during clathrin-mediated endocytosis. Nat Cell Biol. 2011;13:1124–1131. doi: 10.1038/ncb2307. [DOI] [PMC free article] [PubMed] [Google Scholar]
- Brett TJ, Traub LM. Molecular structures of coat and coat-associated proteins: function follows form. Curr Opin Cell Biol. 2006;18:395–406. doi: 10.1016/j.ceb.2006.06.014. [DOI] [PubMed] [Google Scholar]
- Chappie JS, Acharya S, Leonard M, Schmid SL, Dyda F. G domain dimerization controls dynamin's assembly-stimulated GTPase activity. Nature. 2010;465:435–440. doi: 10.1038/nature09032. [DOI] [PMC free article] [PubMed] [Google Scholar]
- Chappie JS, Acharya S, Liu Y-W, Leonard M, Pucadyil TJ, Schmid SL. An intramolecular signaling element that modulates dynamin function in vitro and in vivo. Mol Biol Cell. 2009;20:3561–3571. doi: 10.1091/mbc.E09-04-0318. [DOI] [PMC free article] [PubMed] [Google Scholar]
- Chappie JS, Dyda F. Building a fission machine—structural insights into dynamin assembly and activation. J Cell Sci. 2013;126:2773–2784. doi: 10.1242/jcs.108845. [DOI] [PMC free article] [PubMed] [Google Scholar]
- Chappie JS, Mears JA, Fang S, Leonard M, Schmid SL, Milligan RA, Hinshaw JE, Dyda F. A pseudoatomic model of the dynamin polymer identifies a hydrolysis-dependent powerstroke. Cell. 2011;147:209–222. doi: 10.1016/j.cell.2011.09.003. [DOI] [PMC free article] [PubMed] [Google Scholar]
- Chen Y-J, Zhang P, Egelman EH, Hinshaw JE. The stalk region of dynamin drives the constriction of dynamin tubes. Nat Struct Mol Biol. 2004;11:574–575. doi: 10.1038/nsmb762. [DOI] [PubMed] [Google Scholar]
- Cocucci E, Aguet F, Boulant S, Kirchhausen T. The first five seconds in the life of a clathrin-coated pit. Cell. 2012;150:495–507. doi: 10.1016/j.cell.2012.05.047. [DOI] [PMC free article] [PubMed] [Google Scholar]
- Cook T, Mesa K, Urrutia R. Three dynamin-encoding genes are differentially expressed in developing rat brain. J Neurochem. 1996;67:927–931. doi: 10.1046/j.1471-4159.1996.67030927.x. [DOI] [PubMed] [Google Scholar]
- Damke H, Baba T, Warnock DE, Schmid SL. Induction of mutant dynamin specifically blocks endocytic coated vesicle formation. J Cell Biol. 1994;127:915–934. doi: 10.1083/jcb.127.4.915. [DOI] [PMC free article] [PubMed] [Google Scholar]
- Doyon JB, Zeitler B, Cheng J, Cheng AT, Cherone JM, Santiago Y, Lee AH, Vo TD, Doyon Y, Miller JC, et al. Rapid and efficient clathrin-mediated endocytosis revealed in genome-edited mammalian cells. Nat Cell Biol. 2011;13:331–337. doi: 10.1038/ncb2175. [DOI] [PMC free article] [PubMed] [Google Scholar]
- Ehrlich M, Boll W, van Oijen A, Hariharan R, Chandran K, Nibert ML, Kirchhausen T. Endocytosis by random initiation and stabilization of clathrin-coated pits. Cell. 2004;118:591–605. doi: 10.1016/j.cell.2004.08.017. [DOI] [PubMed] [Google Scholar]
- Faelber K, Posor Y, Gao S, Held M, Roske Y, Schulze D, Haucke V, Noé F, Daumke O. Crystal structure of nucleotide-free dynamin. Nature. 2011;477:556–560. doi: 10.1038/nature10369. [DOI] [PubMed] [Google Scholar]
- Ferguson SM, Brasnjo G, Hayashi M, Wölfel M, Collesi C, Giovedi S, Raimondi A, Gong LW, Ariel P, Paradise S, et al. A selective activity-dependent requirement for dynamin 1 in synaptic vesicle endocytosis. Science. 2007;316:570–574. doi: 10.1126/science.1140621. [DOI] [PubMed] [Google Scholar]
- Ford MGJ, Jenni S, Nunnari J. The crystal structure of dynamin. Nature. 2011;477:561–566. doi: 10.1038/nature10441. [DOI] [PMC free article] [PubMed] [Google Scholar]
- Forozan F, Veldman R, Ammerman CA, Parsa NZ, Kallioniemi A, Kallioniemi OP, Ethier SP. Molecular cytogenetic analysis of 11 new breast cancer cell lines. Br J Cancer. 1999;81:1328–1334. doi: 10.1038/sj.bjc.6695007. [DOI] [PMC free article] [PubMed] [Google Scholar]
- Goddard TD, Huang CC, Ferrin TE. Visualizing density maps with UCSF Chimera. J Struct Biol. 2007;157:281–287. doi: 10.1016/j.jsb.2006.06.010. [DOI] [PubMed] [Google Scholar]
- Grassart A, Cheng AT, Hong SH, Zhang F, Zenzer N, Feng Y, Briner DM, Davis GD, Malkov D, Drubin DG. Actin and dynamin2 dynamics and interplay during clathrin-mediated endocytosis. J Cell Biol. 2014;205:721–735. doi: 10.1083/jcb.201403041. [DOI] [PMC free article] [PubMed] [Google Scholar]
- Heuser JE, Anderson RG. Hypertonic media inhibit receptor-mediated endocytosis by blocking clathrin-coated pit formation. J Cell Biol. 1989;108:389–400. doi: 10.1083/jcb.108.2.389. [DOI] [PMC free article] [PubMed] [Google Scholar]
- Hinshaw JE, Schmid SL. Dynamin self-assembles into rings suggesting a mechanism for coated vesicle budding. Nature. 1995;374:190–192. doi: 10.1038/374190a0. [DOI] [PubMed] [Google Scholar]
- Jackson LP, Kümmel D, Reinisch KM, Owen DJ. Structures and mechanisms of vesicle coat components and multisubunit tethering complexes. Curr Opin Cell Biol. 2012a;24:475–483. doi: 10.1016/j.ceb.2012.05.013. [DOI] [PMC free article] [PubMed] [Google Scholar]
- Jackson LP, Lewis M, Kent HM, Edeling MA, Evans PR, Duden R, Owen DJ. Molecular basis for recognition of dilysine trafficking motifs by COPI. Dev Cell. 2012b;23:1255–1262. doi: 10.1016/j.devcel.2012.10.017. [DOI] [PMC free article] [PubMed] [Google Scholar]
- Jaqaman K, Danuser G. Linking data to models: data regression. Nat Rev Mol Cell Biol. 2006;7:813–819. doi: 10.1038/nrm2030. [DOI] [PubMed] [Google Scholar]
- Jaqaman K, Loerke D, Mettlen M, Kuwata H, Grinstein S, Schmid SL, Danuser G. Robust single-particle tracking in live-cell time-lapse sequences. Nat Methods. 2008;5:695–702. doi: 10.1038/nmeth.1237. [DOI] [PMC free article] [PubMed] [Google Scholar]
- Kirchhausen T, Owen D, Harrison SC. Molecular structure, function, and dynamics of clathrin-mediated membrane traffic. Cold Spring Harb Perspect Biol. 2014;6, a016725 doi: 10.1101/cshperspect.a016725. [DOI] [PMC free article] [PubMed] [Google Scholar]
- Koenig JH, Kosaka T, Ikeda K. The relationship between the number of synaptic vesicles and the amount of transmitter released. J Neurosci. 1989;9:1937–1942. doi: 10.1523/JNEUROSCI.09-06-01937.1989. [DOI] [PMC free article] [PubMed] [Google Scholar]
- Kozlovsky Y, Kozlov MM. Membrane fission: model for intermediate structures. Biophys J. 2003;85:85–96. doi: 10.1016/S0006-3495(03)74457-9. [DOI] [PMC free article] [PubMed] [Google Scholar]
- Kural C, Tacheva-Grigorova SK, Boulant S, Cocucci E, Baust T, Duarte D, Kirchhausen T. Dynamics of intracellular clathrin/AP1- and clathrin/AP3-containing carriers. Cell Rep 2, 1111–1119. 2012 doi: 10.1016/j.celrep.2012.09.025. [DOI] [PMC free article] [PubMed] [Google Scholar]
- Liu Y-W, Mattila J-P, Schmid SL. Dynamin-catalyzed membrane fission requires coordinated GTP hydrolysis. PLoS One. 2013;8:e55691. doi: 10.1371/journal.pone.0055691. [DOI] [PMC free article] [PubMed] [Google Scholar]
- Liu Y-W, Surka MC, Schroeter T, Lukiyanchuk V, Schmid SL. Isoform and splice-variant specific functions of dynamin-2 revealed by analysis of conditional knock-out cells. Mol Biol Cell. 2008;19:5347–5359. doi: 10.1091/mbc.E08-08-0890. [DOI] [PMC free article] [PubMed] [Google Scholar]
- Macia E, Ehrlich M, Massol R, Boucrot E, Brunner C, Kirchhausen T. Dynasore, a cell-permeable inhibitor of dynamin. Dev Cell. 2006;10:839–850. doi: 10.1016/j.devcel.2006.04.002. [DOI] [PubMed] [Google Scholar]
- McMahon HT, Boucrot E. Molecular mechanism and physiological functions of clathrin-mediated endocytosis. Nat Rev Mol Cell Biol. 2011;12:517–533. doi: 10.1038/nrm3151. [DOI] [PubMed] [Google Scholar]
- Merrifield CJ, Feldman ME, Wan L, Almers W. Imaging actin and dynamin recruitment during invagination of single clathrin-coated pits. Nat Cell Biol. 2002;4:691–698. doi: 10.1038/ncb837. [DOI] [PubMed] [Google Scholar]
- Merrifield CJ, Perrais D, Zenisek D. Coupling between clathrin-coated-pit invagination, cortactin recruitment, and membrane scission observed in live cells. Cell. 2005;121:593–606. doi: 10.1016/j.cell.2005.03.015. [DOI] [PubMed] [Google Scholar]
- Morlot S, Galli V, Klein M, Chiaruttini N, Manzi J, Humbert F, Dinis L, Lenz M, Cappello G, Roux A. Membrane shape at the edge of the dynamin helix sets location and duration of the fission reaction. Cell. 2012;151:619–629. doi: 10.1016/j.cell.2012.09.017. [DOI] [PMC free article] [PubMed] [Google Scholar]
- Morlot S, Roux A. Mechanics of dynamin-mediated membrane fission. Annu Rev Biophys. 2013;42:629–649. doi: 10.1146/annurev-biophys-050511-102247. [DOI] [PMC free article] [PubMed] [Google Scholar]
- Muhlberg AB, Warnock DE, Schmid SL. Domain structure and intramolecular regulation of dynamin GTPase. EMBO J. 1997;16:6676–6683. doi: 10.1093/emboj/16.22.6676. [DOI] [PMC free article] [PubMed] [Google Scholar]
- Neumann S, Schmid SL. Dual role of BAR domain-containing proteins in regulating vesicle release catalyzed by the GTPase, dynamin-2. J Biol Chem. 2013;288:25119–25128. doi: 10.1074/jbc.M113.490474. [DOI] [PMC free article] [PubMed] [Google Scholar]
- Praefcke GJK, McMahon HT. The dynamin superfamily: universal membrane tubulation and fission molecules. Nat Rev Mol Cell Biol. 2004;5:133–147. doi: 10.1038/nrm1313. [DOI] [PubMed] [Google Scholar]
- Ramachandran R, Pucadyil TJ, Liu Y-W, Acharya S, Leonard M, Lukiyanchuk V, Schmid SL. Membrane insertion of the pleckstrin homology domain variable loop 1 is critical for dynamin-catalyzed vesicle scission. Mol Biol Cell. 2009;20:4630–4639. doi: 10.1091/mbc.E09-08-0683. [DOI] [PMC free article] [PubMed] [Google Scholar]
- Roux A, Uyhazi K, Frost A, De Camilli P. GTP-dependent twisting of dynamin implicates constriction and tension in membrane fission. Nature. 2006;441:528–531. doi: 10.1038/nature04718. [DOI] [PubMed] [Google Scholar]
- Sanjana NE, Cong L, Zhou Y, Cunniff MM, Feng G, Zhang F. A transcription activator-like effector toolbox for genome engineering. Nat Protoc. 2012;7:171–192. doi: 10.1038/nprot.2011.431. [DOI] [PMC free article] [PubMed] [Google Scholar]
- Shnyrova AV, Bashkirov PV, Akimov SA, Pucadyil TJ, Zimmerberg J, Schmid SL, Frolov VA. Geometric catalysis of membrane fission driven by flexible dynamin rings. Science. 2013;339:1433–1436. doi: 10.1126/science.1233920. [DOI] [PMC free article] [PubMed] [Google Scholar]
- Smirnova E, Shurland DL, Newman-Smith ED, Pishvaee B, van der Bliek AM. A model for dynamin self-assembly based on binding between three different protein domains. J Biol Chem. 1999;274:14942–14947. doi: 10.1074/jbc.274.21.14942. [DOI] [PubMed] [Google Scholar]
- Smith DA. A quantitative method for the detection of edges in noisy time-series. Philos Trans R Soc Lond B Biol Sci. 1998;353:1969–1981. doi: 10.1098/rstb.1998.0348. [DOI] [PMC free article] [PubMed] [Google Scholar]
- Stowell MH, Marks B, Wigge P, McMahon HT. Nucleotide-dependent conformational changes in dynamin: evidence for a mechanochemical molecular spring. Nat Cell Biol. 1999;1:27–32. doi: 10.1038/8997. [DOI] [PubMed] [Google Scholar]
- Sweitzer SM, Hinshaw JE. Dynamin undergoes a GTP-dependent conformational change causing vesiculation. Cell. 1998;93:1021–1029. doi: 10.1016/s0092-8674(00)81207-6. [DOI] [PubMed] [Google Scholar]
- Taylor MJ, Lampe M, Merrifield CJ. A feedback loop between dynamin and actin recruitment during clathrin-mediated endocytosis. PLoS Biol. 2012;10:e1001302. doi: 10.1371/journal.pbio.1001302. [DOI] [PMC free article] [PubMed] [Google Scholar]
- Taylor MJ, Perrais D, Merrifield CJ. A high precision survey of the molecular dynamics of mammalian clathrin-mediated endocytosis. PLoS Biol. 2011;9:e1000604. doi: 10.1371/journal.pbio.1000604. [DOI] [PMC free article] [PubMed] [Google Scholar]
- Tuma PL, Collins CA. Activation of dynamin GTPase is a result of positive cooperativity. J Biol Chem. 1994;269:30842–30847. [PubMed] [Google Scholar]
- Tuma PL, Collins CA. Dynamin forms polymeric complexes in the presence of lipid vesicles. Characterization of chemically cross-linked dynamin molecules. J Biol Chem. 1995;270:26707–26714. doi: 10.1074/jbc.270.44.26707. [DOI] [PubMed] [Google Scholar]
- Urrutia R, Henley JR, Cook T, McNiven MA. The dynamins: redundant or distinct functions for an expanding family of related GTPases. Proc Natl Acad Sci USA. 1997;94:377–384. doi: 10.1073/pnas.94.2.377. [DOI] [PMC free article] [PubMed] [Google Scholar]
- Warnock DE, Hinshaw JE, Schmid SL. Dynamin self-assembly stimulates its GTPase activity. J Biol Chem. 1996;271:22310–22314. doi: 10.1074/jbc.271.37.22310. [DOI] [PubMed] [Google Scholar]
- Zhang P, Hinshaw JE. Three-dimensional reconstruction of dynamin in the constricted state. Nat Cell Biol. 2001;3:922–926. doi: 10.1038/ncb1001-922. [DOI] [PubMed] [Google Scholar]
Associated Data
This section collects any data citations, data availability statements, or supplementary materials included in this article.