

Beetle luciferases and time-lapse luminescence microscopy were optimized to measure the dynamics of cell cycle genes in yeast with subminute time resolution. This method is faster and the cells are smaller than in previous work. It is shown that luciferase reporters are better than fluorescent proteins at tracking gene expression.
Abstract
Time-lapse fluorescence microscopy is an important tool for measuring in vivo gene dynamics in single cells. However, fluorescent proteins are limited by slow chromophore maturation times and the cellular autofluorescence or phototoxicity that arises from light excitation. An alternative is luciferase, an enzyme that emits photons and is active upon folding. The photon flux per luciferase is significantly lower than that for fluorescent proteins. Thus time-lapse luminescence microscopy has been successfully used to track gene dynamics only in larger organisms and for slower processes, for which more total photons can be collected in one exposure. Here we tested green, yellow, and red beetle luciferases and optimized substrate conditions for in vivo luminescence. By combining time-lapse luminescence microscopy with a microfluidic device, we tracked the dynamics of cell cycle genes in single yeast with subminute exposure times over many generations. Our method was faster and in cells with much smaller volumes than previous work. Fluorescence of an optimized reporter (Venus) lagged luminescence by 15–20 min, which is consistent with its known rate of chromophore maturation in yeast. Our work demonstrates that luciferases are better than fluorescent proteins at faithfully tracking the underlying gene expression.
INTRODUCTION
Time-lapse fluorescence microscopy of genetically encoded fluorescent proteins is the gold standard for measuring in vivo dynamics of gene expression in single cells. However, fluorescence microscopy uses intense light to excite a fluorophore, which can result in high background autofluorescence and phototoxicity in cells. This problem becomes acute when measuring multiple genes (which requires exciting different fluorophores with different wavelengths) on fast time scales (which requires frequent exposure to intense light). For these reasons, time-lapse fluorescence microscopy is typically limited to one or two fluorescent reporters. A further limitation is the slow chromophore maturation of fluorescent proteins, which can introduce a significant time delay between gene expression and measurable change in fluorescence. Fluorescent protein reporters with long maturation times cannot faithfully track gene expression dynamics (Wang et al., 2008; Gedeon and Bokes, 2012)
An alternative is luciferase, an oxidative enzyme that produces photons. Luciferases fold cotranslationally and are enzymatically active upon folding (Frydman et al., 1999). Thus, in contrast to fluorescent proteins, they do not require intense excitation light and do not exhibit maturation delays. Luciferases are an example of convergent evolution because diverse organisms (e.g., beetles, marine invertebrates, bacteria) have independently evolved enzymes to produce light of different colors using unique substrates (e.g., d-luciferin, coelenterazine, and N-decanal; Wilson and Hastings, 1998). Despite this enzymatic diversity, all known luciferases require oxygen to catalyze their substrate into an excited-state product that decays and emits a single photon. The ability to maintain in vivo oxygen and substrate concentrations at high and consistent levels during live-cell time-lapse luminescence microscopy has been a challenge. Another limitation is the number of photons produced per luciferase per second. The maximum catalytic rates of beetle and marine luciferases range from 0.1 to 10 photons/s per luciferase (Branchini et al., 1999; Loening et al., 2006). This is substantially lower than the 1000 photons/s per green fluorescent protein (GFP) at an excitation intensity of 10 W/cm2 (Garcia-Parajo et al., 2000; Chiu et al., 2001).
Time-lapse luminescence microscopy has been successfully used to measure in vivo gene dynamics in larger organisms (e.g., animals, plants, tissue culture) or for slower processes (e.g., circadian oscillation), for which more total photons per pixel can be collected during one camera exposure (Liu et al., 2007; Nakajima et al., 2010). The state of the art for microbial time-lapse luminescence microscopy measured circadian gene dynamics in single cyanobacteria with a 30-min exposure time (Mihalcescu et al., 2004). To our knowledge, no one has developed methods of microbial time-lapse luminescence microscopy that measure in vivo gene dynamics for extended periods of time with subminute resolution (e.g., cell cycle).
Commercial time-lapse microscopes and sensitive charge-coupled device (CCD) cameras have greatly improved over the last decade and are routinely used by biologists. Thus we sought to improve in vivo luciferase enzymatic yield (photons per second) rather than photon detection. We developed a method for live-cell time-lapse luminescence microscopy that can measure subminute gene dynamics in budding yeast at single-cell resolution. This was achieved by optimizing d-luciferin delivery across the lipid bilayer, using microfluidics to trap cells and maintain substrates at saturating concentrations during imaging, and integrating multiple copies of luciferase genes into the yeast genome.
RESULTS
We first designed and constructed green (GrLuc), yellow (YeLuc), and red (RdLuc) luciferase derived from beetles (Viviani et al., 1999a, b; Fujii et al., 2007). We fused an N-terminal nuclear-localization signal (NLS) to concentrate these luciferases into a smaller volume and spread the light signal across fewer pixels (Figure 1A). For comparison, we also tested commercial beetle luciferases (CBG99, CBR, FLuc) and a new marine luciferase (NLuc; Hall et al., 2012) from Promega (Madison, WI; Figure 1B). Each luciferase reporter was regulated by a methionine-repressible promoter (MET17) and integrated into the yeast genome either in single copy or multiple copies; see Materials and Methods. We measured the emission spectrum of our designed luciferases to confirm that they were consistent with their expected color; see Supplemental Figure S1.
FIGURE 1:
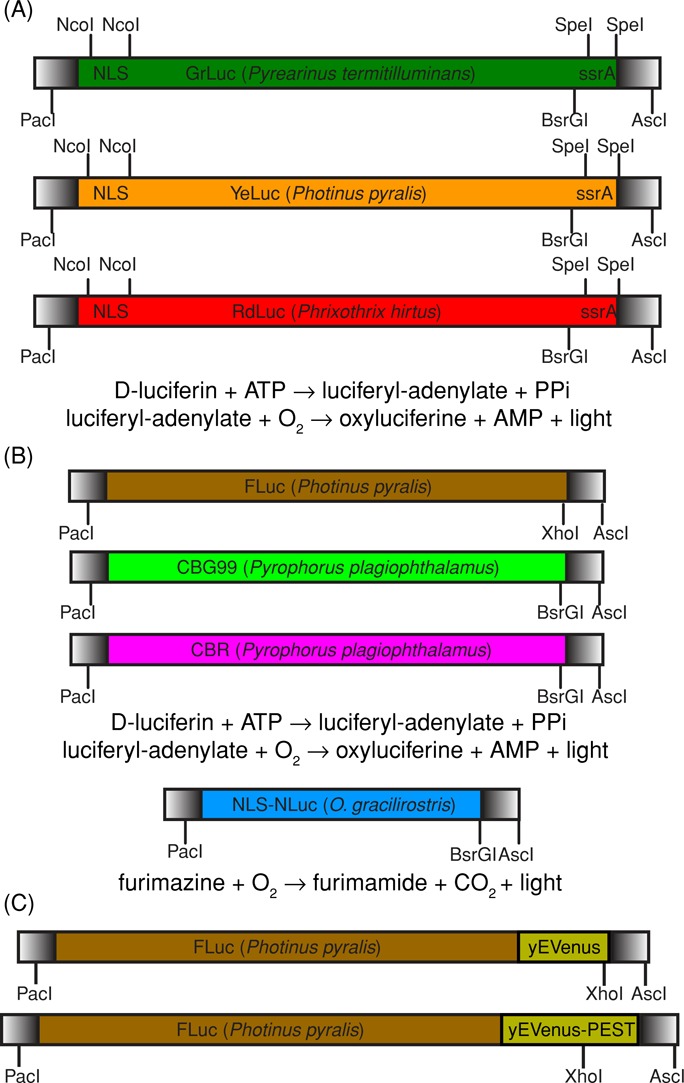
Construction and design of multicolor luciferases. (A) We used gene synthesis (DNA 2.0, Menlo Park, CA) to build beetle luciferases—green from P. termitilluminans (Viviani et al., 1999b), yellow from P. pyralis (Fujii et al., 2007), and red from P. hirtus (Viviani et al., 1999a)—for expression in budding yeast. Beetle luciferase is an enzyme that catalyzes a two-step reaction that requires both ATP and O2 in addition to d-luciferin substrate. An N-terminal SV40 NLS was added between NcoI–NcoI to concentrate luciferase into the nucleus and improve signal-to-background ratio. The C-terminal SKL peroxisomal targeting motif (Leskinen et al., 2003) was removed and replaced by an ssrA degron between SpeI–SpeI for future use in an engineered ClpXP yeast strain (Grilly et al., 2007). The ClpXP strain has LacI-regulated expression of ClpX and ClpP, two subunits of a bacterial proteasome that recognizes a short amino acid sequence, ssrA. Any yeast protein in the engineered ClpXP strain that is fused to an ssrA tag will be conditionally degraded by the addition of isopropyl-β-d-thiogalactoside. (B) For comparison, we tested Promega CBG99 (green) and CBR (red) from P. plagiophthalamus and FLuc (yellow) from P. pyralis. We also tested Promega NLuc (blue), which is a bright marine luciferase that requires only O2 and furimazine (a coelenterazine analogue; Hall et al., 2012). Blue marine luciferases do not require ATP. All of these gene constructs were built to be modular and backward compatible with popular yeast enhanced fluorescent proteins (PacI-AscI; Sheff and Thorn, 2004) and yeast PEST degron (XhoI/BsrGI-AscI) derived from CLN2 gene (Mateus and Avery, 2000). (C) We built FLuc-yEVenus and FLuc-yEVenus-PEST fusion proteins to compare time-lapse luminescence and fluorescence microscopy directly.
We then used a 96-well plate bulk assay with a Wallac Victor 3 luminometer (PerkinElmer-Cetus, Waltham, MA) to optimize conditions (substrates, pH) for in vivo yeast luminescence. Beetle luciferases require d-luciferin, ATP, and oxygen as substrates, whereas NLuc only requires furimazine (a coelenterazine analogue) and oxygen. We expected log-phase cells to maintain their ATP at high concentrations. However, in vivo oxygen, d-luciferin, and furimazine could be limiting because they must diffuse across the lipid bilayer from the external medium (Wood and DeLuca, 1987; Vieites et al., 1994). We determined that 200 μM d-luciferin and 50 μM furimazine were saturating for in vivo luminescence (Figure 2A). We further boosted the in vivo luminescence of beetle luciferases ∼30-fold by lowering the pH of the growth medium (Figure 2B). The luminescence increased because of the low extracellular pH, which reduced the charge of d-luciferin (pKa = 2.9) and improved its diffusion across the lipid bilayer (Wood and DeLuca, 1987; Vieites et al., 1994). We verified that our yeast strains grew well at lower pH (3.8) and that the luciferases were not cytotoxic at high copy number (Figure 2C). The only exception is NLuc, which was already cytotoxic as a single-copy integrant (Figure 2C).
FIGURE 2:

Optimization of pH and substrate concentration in the extracellular medium. We used multicopy strains AMV104, AMV68, AMV69, AMV45, AMV152, AMV151, AMV16, and AMV41, which have a MET17 promoter driving different luciferase reporters; see Table 3. We also included the parental strain (MMY116-2C) as a negative control. Strains were induced overnight and diluted into fresh medium in the morning. Cell cultures were then grown at 30°C to OD660 ≈ 0.2 before starting measurements. Growth medium was synthetic complete methionine drop-out medium with 2% d-glucose (SCD–Met). The bulk luminescence was measured using a 96-well plate assay with a Wallac Victor 3 plate reader. Error bars represent the SD of three technical replicates. (A) We varied the d-luciferin and furimazine concentrations at constant pH values (3.8 and 6.0, respectively). (B) We varied the pH of the growth medium at constant d-luciferin (100 μM) or furimazine (20 μM) concentrations. On the basis of these results, we fixed the pH (3.8), d-luciferin (100 μM), and furimazine (20 μM) for all subsequent luminescence experiments. (C) We measured OD660 every 30 min with a spectrophotometer to quantify strain growth rates in SCD-Met at 30°C. Thin, dotted lines are the 95% confidence interval of the best exponential fit. Both single-copy and multicopy Nluc exhibited slower growth rates than the parental strain.
We also compared the relative brightness of different luciferases. To this end, we integrated a single gene copy of each luciferase into the same target locus. Our beetle luciferases GrLuc and YeLuc were ∼10-fold brighter than RdLuc (Figure 3A). This same color relationship persists for Promega beetle luciferases CBG99 (green), FLuc (yellow), and CBR (red). All of the commercial luciferases were at least ∼10-fold brighter (Figure 3A) than our designed luciferases. NLuc was the brightest. Unfortunately, furimazine was insoluble in aqueous solution and precipitated out, which made NLuc incompatible with long-term, live-cell time-lapse luminescence microscopy.
FIGURE 3:
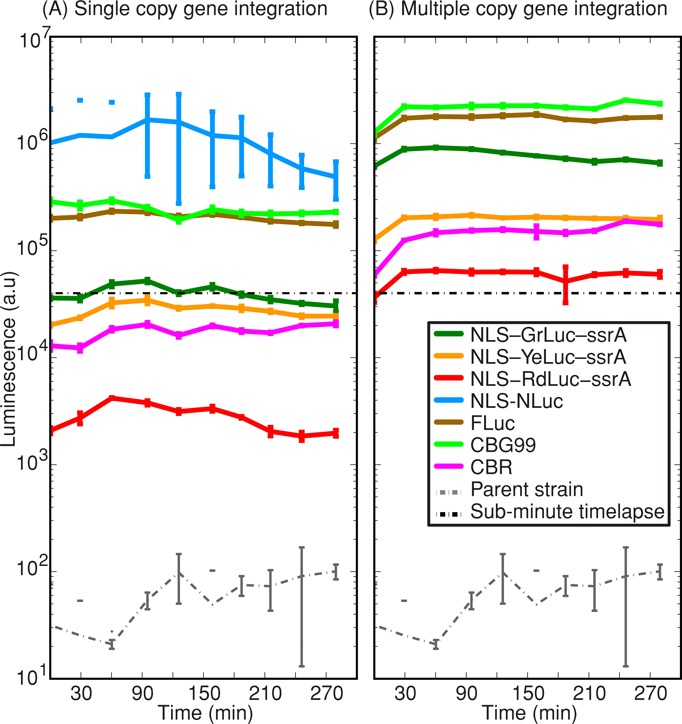
Luminescence output of different multicolor luciferases integrated in yeast chromosome as (A) a single copy or (B) multiple copies. Single-copy strains were AMV70, AMV72, AMV71, AMV54, AMV152-13, AMV151-18, and AMV16, and “bright,” multicopy strains were AMV104, AMV68, AMV69, AMV45, AMV152-03, and AMV151-08; see Table 3. All strains have a MET17 promoter driving different luciferase reporters. We also included the parental strain (MMY116-2C) as a negative control. We used a 96-well plate assay, and error bars represent the SD of three technical replicates. At time t = 0 min, 100 μl of log-phase (OD660 = 0.1) yeast pregrown at 30°C in SCD–Met were inoculated in fresh, identical medium with 100 μM d-luciferin at pH 3.8 or 20 μM furimazine at pH 6.0. Time-lapse luminescence microscopy at subminute time resolution was successful for those strains above the horizontal, dashed line at 4 × 10⁴ luminescence units. With the exception of CBR, commercial luciferases are bright enough at single copy for subminute time-lapse luminescence microscopy in budding yeast.
We screened all multicopy transformants using a 96-well plate luminescence assay and selected the “brightest” strains (Figure 3B) for time-lapse luminescence microscopy. The variability in luminescence between transformants arises from unequal copy number integration in chromosomal loci due to homologous ends-in recombination. Time-lapse luminescence microscopy using standard, agarose pad methods initially exhibited bright luminescence signal. However, the signal disappeared within 15 min. We reasoned that luciferase substrates (d-luciferin, oxygen) were being depleted. Thus we combined a CellAsic microfluidic device (EMD Millipore, Billerica, MA) with time-lapse luminescence microscopy. The microfluidic device trapped yeast cells and maintained growth medium at constant levels through perfusion. The medium exchange time was <1 min, and cells were unable to deplete their substrates. With microfluidics, we consistently measured in vivo gene expression dynamics with subminute time resolution for >12 h (Figure 4). We only stopped time lapse because the yeast microcolony extended beyond the field of view. We further validated our method by benchmarking and quantifying gene induction and repression dynamics of many green, yellow, and red luciferase reporters for several metabolite-repressed yeast promoters (MET17, LEU1, ADE17, LYS9); see Supplemental Figures S2–S4 and Supplemental Table S1.
FIGURE 4:

Fast-time-lapse luminescence microscopy in budding yeast. Montage of LEU1pr-FLuc-yEVenus-PEST switching between leucine repression and induction. Our multicopy strain AMV167 was grown at 30°C on a CellAsic microfluidic device that was mounted on a DeltaVision microscope (Applied Precision, Issaquah, WA) within an incubation chamber. We imaged cells every 4 min. To capture full luminescence, each image is a sum projection of five z-stacks separated by 0.4 μm, with 10-s exposures for each stack for a subminute total. We also acquired a 2-ms fluorescence image, followed by a 7-ms phase image for image segmentation. The difference in exposure times indicates that yEVenus emits ∼104-fold more photons per second than FLuc, which is consistent with known photon flux outputs of fluorescent proteins and luciferases. (A) Previously induced cells were repressed during the switch from SCD-Leu to SCD+Leu medium at 390 min (vertical line in B). (B) Single-cell luminescence and fluorescence traces of repression (n = 16 cells). Image segmentation was done with CellStat program (Kvarnström et al., 2008). Rapid increases in signal are the new buds identified and tracked by the segmentation program. Best fit of a mathematical model of gene repression with delay to average luminescence signal (dark brown) and average fluorescence signal (dark green) is shown in black; see Materials and Methods and Supplemental Table S1 for details. Thin, black dotted lines are the 95% confidence interval of the best fit curve. The luminescence background is set by EMCCD camera noise, whereas fluorescence background is set by cellular autofluorescence. (C) Previously repressed cells were induced during the switch from SCD+Leu to SCD-Leu medium at 390 min (vertical line in D). (D) Single cell luminescence and fluorescence traces of induction (n = 18 cells). Scale bar, 10 μm.
To compare luciferase and fluorescent protein reporters directly, we used both time-lapse luminescence and fluorescence microscopy to measure gene induction and repression dynamics of a FLuc-yEVenus-PEST fusion (Figure 1C) regulated by the LEU1 promoter (Figure 4). We chose yEVenus-PEST because it is a fast-maturing, destabilized yellow fluorescent protein (YFP) commonly used to measure yeast cell cycle dynamics (Skotheim et al., 2008). Our results showed that the fluorescence kinetics of FLuc-yEVenus-PEST during induction and repression are consistently slower and delayed compared with luminescence. The slow kinetics is worse if FLuc-yEVenus is not destabilized with a PEST degron; see Supplemental Figure S5 and Supplemental Table S1. We obtained identical results with FLuc-yEVenus and FLuc-yEVenus-PEST fusions regulated by the MET17 promoter; see Supplemental Figure S6 and Supplemental Table S1.
These results suggested that our luciferase should more faithfully track cell-cycle oscillations than fluorescence reporters. To this end, we expressed FLuc-yEVenus-PEST under the transcriptional control of two different yeast cell cycle promoters, SIC1 and RNR1. We successfully tracked cell cycle luciferase dynamics with subminute resolution (Figure 5). SIC1 transcripts are known to peak at the M/G1 border near cytokinesis, whereas RNR1 transcripts peak at the G1/S border (Spellman et al., 1998). Our data showed that the luminescence of SIC1pr-FLuc-yEVenus-PEST peaks on average 13 min before budding, whereas fluorescence peaks 6 min after budding. The luminescence of RNR1pr-FLuc-yEVenus-PEST peaks on average 7 min before budding, and fluorescence peaks 11 min after budding. Thus fluorescence lagged the luminescence signal by 15–20 min. This delay was identical to the measured in vivo chromophore maturation delay of yEVenus-PEST (Charvin et al., 2008). To verify that our protein fusion was not interfering with yEVenus folding and/or maturation, we built strains with either yEVenus-PEST or FLuc under the control of SIC1 or RNR1 promoter, respectively. Fluorescence of yEVenus-PEST alone continued to exhibit a 15–20 min delay when compared with luminescence of FLuc (Supplemental Figure S7). A two-sample Student's t test of our fluorescence peak and budding data shows no significant statistical difference between FLuc-yEVenus-PEST (Figure 5) and yEVenus-PEST (Supplemental Figure S7) with either SIC1 or RNR1 promoter; see Supplemental Table S2 for a complete statistical analysis. The same is true for luminescence peak and budding data between FLuc-yEVenus-PEST and FLuc. Supplemental Table S2 also shows that PEST has no significant effect on the timing of peak signal and budding. We conclude that FLuc-yEVenus-PEST fusion does not significantly affect the timing of either FLuc luminescence or yEVenus fluorescence.
FIGURE 5:

Time-lapse luminescence microscopy of cell-cycle dynamics. Single-cell time-lapse luminescence and fluorescence microscopy of multicopy strains AMV163 and AMV165 with (A, B) SIC1pr-FLuc-yEVenus-PEST and (C, D) RNR1pr-FLuc-yEVenus-PEST, respectively. Filming and image segmentation were identical to Figure 4, except that each luminescence z-stack was 12 s. (A) A representative SIC1pr-FLuc-yEVenus-PEST and (C) RNR1pr-FLuc-yEVenus-PEST time course. The raw, noisy luminescence and fluorescence were smoothed with a Savitzky–Golay filter (with a span of eight data points and one polynomial degree) to reliably detect peak SIC1 or RNR1 expression. The vertical, dashed lines in individual traces correspond to budding, a visible cell cycle event. Statistical differences in timing between budding and peak times are reported in tables beneath the figures. The yeast cell division cycle exhibits significant variability in amplitude and period, a feature that leads to loss of synchrony in a population of cells (Di Talia et al., 2007). This loss of synchrony is easily observed when we align different single-cell traces of (B) SIC1pr-FLuc-yEVenus-PEST and (D) RNR1pr-FLuc-yEVenus-PEST to their second peaks. We align to the second peak because daughter cells are known to have large, variable delays in their first cell cycle (Di Talia et al., 2009).
DISCUSSION
Here we optimized luminescence microscopy to measure in vivo gene dynamics (e.g., cell cycle) in yeast cells with subminute resolution. The temporal resolution was ∼4 times faster and the cellular volumes were ∼20 times smaller than previous methods with beetle luciferases (Supplemental Table S3). Our protocol now adds time-lapse luminescence microscopy to the microbiologist's toolbox for measuring fast gene dynamics with a beetle luciferase. Time-lapse luminescence can be used alone (if phototoxicity and/or chromophore maturation is a problem) or in conjunction with time-lapse fluorescence microscopy (if more gene reporters are needed). Successful time-lapse luminescence only required a dark room, a sensitive electron-multiplying (EM) CCD camera, and a microfluidic device to prevent depletion of critical luciferase substrates (e.g., d-luciferin, oxygen). All of this equipment is commercially available and compatible with standard time-lapse fluorescence microscopes. We did not measure dynamics of several genes simultaneously using our multicolor luciferases, but luminescence multiplexing can be done in batch culture (Nakajima et al., 2005) and in single cells (Kwon et al., 2010) with filters and spectral unmixing.
Our method was developed to study fast transcriptional dynamics. However, luciferases can be fused to proteins to study localization and protein–protein interactions via split luciferases (Ozawa et al., 2001; Luker et al., 2004; Malleshaiah et al., 2010) or bioluminescence resonance energy transfer (Xu et al., 1999). If protein localization or transport is fast, the ∼1-min exposure time required with a beetle luciferase fusion cannot provide the same spatial resolution as fluorescent proteins. Directed evolution and rational design of blue marine luciferases (e.g., NanoLantern, NLuc) have improved the photon flux ∼10- to 100-fold (Hoshino et al., 2007; Hall et al., 2012). For example, NanoLantern was able to measure protein localization and transport in mammalian cells (Saito et al., 2012). Unfortunately, in our hands, NLuc (a blue marine luciferase) was cytotoxic, and furimazine (a derivative of coelenterazine substrate) was insoluble in the microfluidic device. As conditions continue to be improved for in vivo luminescence, luciferases should eventually exhibit all the benefits of fluorescence proteins without the drawbacks. This will also require co-optimizing substrates to be water soluble and diffusible across the lipid bilayer.
MATERIALS AND METHODS
Plasmid construction
Luciferase sequences from larval click beetle (Pyrearinus termitilluminans; GrLuc, green), firefly (Photinus pyralis; YeLuc, yellow), and railroad worm (Phrixothrix hirtus; RdLuc, red) were obtained from GenBank (AF116843, AB261988, AF139645; Viviani et al., 1999a, b; Fujii et al., 2007). Restriction enzyme cut sites, an N-terminal SV40 NLS, and an ssrA degron tag were added to the sequence. The designed DNA sequence was de novo synthesized by DNA 2.0 (Figure 1) into their pJ204 vector. Optimized luciferases from click beetle, Pyrophorus plagiophthalamus (pCBG99, green; and pCBR, red), and deep-sea shrimp, Oplophorus gracilirostris, were obtained from Promega. The plasmid pRS303d-KAN-GAL1pr-Luc (A4V) (Robertson et al., 2008), which contains the optimized firefly (P. pyralis) luciferase from pGL3-Basic vector (Promega), was a gift from the Carl Johnson laboratory at Vanderbilt University (Nashville, TN).
We first built the MET17 promoter (also known as MET25) driving each of the luciferase genes. Parental p406-MET17pr-yEVenus vector was digested with PacI-AscI, and the reporter gene (yEVenus) was replaced with a PacI-AscI–digested luciferase insert (GrLuc, YeLuc, or RdLuc from pJ204-NLS-luciferase-ssrA). In the case of commercial luciferases, the insert genes were amplified from the original vectors (see oligos in Tables 1 and 2). Most of the forward oligos contained a PacI site, whereas the reverse oligos had AscI and BsrGI or XhoI sites (Figure 1 and Table 1). The resulting PCR product was then digested and ligated to parental p406-MET17pr-yEVenus vector that had been digested with PacI-AscI (Table 2) or integrating using the Sequence and Ligation Independent Cloning (SLIC) method. The “disintegrator” plasmids were built by cutting luciferase inserts and pIS385-MET17pr parental vectors with PacI-AscI, followed by ligation to create pIS385-MET17pr-luciferases.
TABLE 1:
Oligos.
| Target sequence | Oligo name | Oligo sequence 5′ → 3′ | Cut sites |
| FLuc gene from pRS303d-KAN-GAL1pr-FLuc(A4V) plasmid; ligation using SLIC protocol | SLIC_FLuc_FWD | ATTACCCCCATCCATACTCTAGAACTAGTGGATCCCCCGGGTTAATTAACATGGAAGACGTCAAAAACAT | Pacl |
| SLIC_FLuc_REV | TCATAAATCATAAGAAATTCGCTTATTTAGAAGTGGCGCGCCTTATTCTCGAGACACGGCGATCTTTCCGC | AscI XhoI | |
| NLuc gene from pNL1.1 plasmid | PacI_NLS_NLuc | CTCTTAATTAACACCATGGCACCACCAAAGAAAAAGAGAAAAGTAGCCATGGTCTTCACACTCGAAGAT | Pacl |
| AscI_BsrGI_NLuc | AGTGGCGCGCCTTATTTGTACAACGCCAGAATGCGTTCGCACA | AscI BsrGI | |
| yEVenus gene from p406-MET17pr-yEVenus plasmid; ligation using SLIC protocol | SLIC_FLuc_YFP_fwd | AAGAAGGGCGGAAAGATCGCCGTGGGTGGGGGATCAATGTCTAAAGGTGAAGAATTATTC | |
| SLIC_FLuc_YFP_rev | AGAAATTCGCTTATTTAGAAGTGGCGCGCCTTATTCTCGAGATTCATCAATACCATGGGT | AscI XhoI | |
| CBG99 gene from CBG99-control plasmid | MET25_PacI_CB_F | CATACTCTAGAACTAGTGGATCCCCCGGGTTAATTAACCATGGTGAAGCGTGAGAAAAATGTC | Pacl |
| Adh_BsrGI_CBG99_R | AATTCGCTTATTTAGAAGTGGCGCGCCTTATTTGTACAAACCGCCGGCCTTCTCCAACAA | AscI BsrGI | |
| CBR gene from CBR-control plasmid | MET25_PacI_CB_F | CATACTCTAGAACTAGTGGATCCCCCGGGTTAATTAACCATGGTGAAGCGTGAGAAAAATGTC | Pacl |
| Adh_BsrGI_CBR_R | AATTCGCTTATTTAGAAGTGGCGCGCCTTATTTGTACAAACCGCCGGCCTTCACCAACAA | AscI BsrGI |
SLIC, Sequence- and ligation-independent cloning.
TABLE 2:
Plasmids.
| Plasmid name | Parental vector | Final plasmid gene | Yeast selectable marker(s) |
|---|---|---|---|
| pNB774 | pJ204-NLS-GrLuc-ssrA | NLS-GrLuc-ssrA (from DNA 2.0) | – |
| pNB775 | pJ204-NLS-YeLuc-ssrA | NLS-YeLuc-ssrA (from DNA 2.0) | – |
| pNB776 | pJ204-NLS-RdLuc-ssrA | NLS-RdLuc-ssrA (from DNA 2.0) | – |
| pNB329 | pNL1.1 | NLuc | – |
| pNB591 | pRS303d-KAN-GAL1pr-Luc (A4V) | FLuc | kanMX |
| pNB770 | CBR-control | CBR | – |
| pNB771 | CBG99-control | CBG99 | – |
| pNB689 | p406-MET17pr-yEVenus | MET17pr-NLS-GrLuc-ssrA | URA3 |
| pNB690 | p406-MET17pr-yEVenus | MET17pr-NLS-YeLuc-ssrA | URA3 |
| pNB691 | p406-MET17pr-yEVenus | MET17pr-NLS-RdLuc-ssrA | URA3 |
| pNB649 | p406-MET17pr-yEVenus | MET17pr-FLuca | URA3 |
| pNB768 | p406-MET17pr-yEVenus | MET17pr-CBG99a | URA3 |
| pNB769 | p406-MET17pr-yEVenus | MET17pr-CBRa | URA3 |
| pNB648 | p406-MET17pr-yEVenus | MET17pr-NLS-NLuc | URA3 |
| pNB655 | p406-MET17pr-FLuc | MET17pr-FLuc-yEVenusa | URA3 |
| pNB682 | p406-MET17pr-FLuc-yEVenus | MET17pr-FLuc-yEVenus-PEST | URA3 |
| pNB695 | pIS385-MET17pr-yELucYellow | MET17pr–NLS–GrLuc–ssrA | URA3/LYS2 |
| pNB693 | pIS385-MET17pr-yELucYellow | MET17pr-NLS-YeLuc-ssrA | URA3/LYS2 |
| pNB697 | pIS385-MET17pr-yELucYellow | MET17pr-NLS-RdLuc-ssrA | URA3/LYS2 |
| pNB660 | pIS385-MET17pr-yELucYellow | MET17pr-FLuc | URA3/LYS2 |
| pNB330 | pIS385-MET17pr-yELucGreen | MET17pr-NLS-NLuca | URA3/LYS2 |
| pNB753 | p406-GAL1pr-NLS-GrLuc-ssrA | LEU1pr-NLS-GrLuc-ssrA | URA3 |
| pNB762 | p406-MET17pr-FLuc | LEU1pr-FLuc | URA3 |
| pNB786 | p406-LEU1pr-NLS-YeLuc-ssrA | LEU1pr-FLuc-yEVenus | URA3 |
| pNB787 | p406-LEU1pr-NLS-YeLuc-ssrA | LEU1pr-FLuc-yEVenus-PEST | URA3 |
| pNB777 | p406-LEU1pr-NLS-YeLuc-ssrA | LEU1pr-CBR | URA3 |
| pNB778 | p406-LEU1pr-NLS-YeLuc-ssrA | LEU1pr-CBG99 | URA3 |
| pNB752 | p406-GAL1pr-NLS-GrLuc-ssrA | ADE17pr-NLS-GrLuc-ssrA | URA3 |
| pNB761 | p406-MET17pr-FLuc | ADE17pr-FLuc | URA3 |
| pNB758 | p406-GAL1pr-NLS-GrLuc-ssrA | LYS9pr-NLS-GrLuc-ssrA | URA3 |
| pNB763 | p406-MET17pr-FLuc | LYS9pr-FLuc | URA3 |
| pNB767 | p406-SIC1pr-mCherry | SIC1pr-FLuc | URA3 |
| pNB812 | p405-RNR1pr-yEVenus | RNR1pr-yEVenus-PEST | LEU2 |
| pNB813 | p405-ACT1pr-yEVenus | SIC1pr-yEVenus-PEST | LEU2 |
| pNB783 | p406-MET17pr-FLuc | RNR1pr-FLuc | URA3 |
| pNB785 | p406-SIC1pr-mCherry | SIC1pr-FLuc-yEVenus-PEST | URA3 |
| pNB789 | p406-RNR1pr-FLuc | RNR1pr-FLuc-yEVenus-PEST | URA3 |
aGene obtained by PCR. For details of source plasmid and oligos see Table 1.
All remaining plasmids with LEU1, ADE17, LYS9, SIC1, and RNR1 promoters were created either by swapping promoters (using SacI-PacI) or by swapping luciferases (using PacI-AscI).
We created a luciferase and fluorescent protein fusion by inserting the yEVenus gene, amplified from p406-MET17pr-yEVenus (see oligos in Table 1), into digested XhoI-AscI p406-MET17pr-FLuc using the SLIC method. PEST degron was extracted from p406-MET17pr-FLuc-PEST by XhoI-AscI digest and then ligated to XhoI-AscI–digested p406-MET17pr-FLuc-yEVenus. The resulting cassette was then inserted after LEU1, SIC1, and RNR1 promoters using PacI-AscI cut sites. All plasmids were verified by analytical restriction digest and fragment analysis by 3730xl DNA Analyzer (Life Technology, Grand Island, NY). Most plasmids in Table 2 are available from Addgene (Cambridge, MA).
Strain construction
Standard methods were used for bacterial and yeast transformations. All yeast strains in Table 3 were derived from MMY116-2C, which is the W303 laboratory strain in which the ade2-1 mutation was restored to ADE2. Multicopy strains in Table 3 were created using homologous ends-in recombination at the URA3 or LEU2 locus after plasmid linearization by StuI or AflII digestion, respectively. A consequence of ends-in homologous recombination is that different transformants will have different numbers of plasmid copies integrated into their target locus (Orr-Weaver et al., 1981). Most single-copy strains in Table 3 were created using a URA3 pop-in/pop-out “disintegrator plasmid” (Sadowski et al., 2007). Briefly, the luciferase gene and URA3 are integrated via homologous ends-in recombination into the LYS2 locus after NruI digestion of plasmids. Subsequent selection for URA3 pop out results in a single gene integration of luciferase in disrupted LYS2 locus (lys2Δ). Single-copy integration was confirmed by PCR. All strains in Table 3 are available upon request.
TABLE 3:
Yeast strain genotypes.
| Strain | Genotype (relative to MMY116-2C)a | Gene integration |
|---|---|---|
| AMV104-02 | MET17pr-NLS-GrLuc-ssrA::URA3 | Multicopy |
| AMV68-10 | MET17pr-NLS-YeLuc-ssrA::URA3 | Multicopy |
| AMV69-06 | MET17pr-NLS-RdLuc-ssrA::URA3 | Multicopy |
| AMV45-06 | MET17pr-FLuc::URA3 | Multicopy |
| AMV152-03 | MET17pr-CBG99::URA3 | Multicopy |
| AMV151-08 | MET17pr-CBR::URA3 | Multicopy |
| AMV41-02 | MET17pr-NLS-NLuc::URA3 | Multicopy |
| AMV70-01 | MET17pr-NLS-GrLuc-ssrA::lys2Δ | Single copy |
| AMV72-01 | MET17pr-NLS-YeLuc-ssrA::lys2Δ | Single copy |
| AMV71-01 | MET17pr-NLS-RdLuc-ssrA::lys2Δ | Single copy |
| AMV54-01 | MET17pr-FLuc::lys2Δ | Single copy |
| AMV152-13 | MET17pr-CBG99::URA3 | Single copyb |
| AMV151-18 | MET17pr-CBR::URA3 | Single copyb |
| AMV16 | MET17pr-NLS-NLuc::lys2Δ | Single copy |
| AMV50-08 | MET17pr-FLuc-yEVenus::URA3 | Multicopy |
| AMV63-03 | MET17pr-FLuc-yEVenus-PEST::URA3 | Multicopy |
| AMV141-08 | LEU2c LEU1pr-NLS-GrLuc-ssrA::URA3 | Multicopy |
| AMV150-18 | LEU2c LEU1pr-FLuc::URA3 | Multicopy |
| AMV153-17 | LEU2c LEU1pr-CBR::URA3 | Multicopy |
| AMV154-16 | LEU2c LEU1pr-CBG99::URA3 | Multicopy |
| AMV166-16 | LEU2c LEU1pr-FLuc-yEVenus | Multicopy |
| AMV167-07 | LEU2c LEU1pr-FLuc-yEVenus-PEST | Multicopy |
| AMV138-06 | ADE17pr-NLS-GrLuc-ssrA::URA3 | Multicopy |
| AMV148-04 | ADE17pr-FLuc::URA3 | Multicopy |
| AMV144-06 | LYS9pr-NLS-GrLuc-ssrA::URA3 | Multicopy |
| AMV149-15 | LYS9pr-FLuc::URA3 | Multicopy |
| AMV137-03 | SIC1pr-FLuc::URA3 | Multicopy |
| AMV156-04 | SIC1pr-yEVenus-PEST::LEU2 | Multicopy |
| AMV163-10 | SIC1pr-FLuc-yEVenus-PEST::URA3 | Multicopy |
| AMV155-12 | RNR1pr-FLuc::URA3 | Multicopy |
| AMV157-19 | RNR1pr-yEVenus-PEST::LEU2 | Multicopy |
| AMV165-12 | RNR1pr-FLuc-yEVenus-PEST::URA3 | Multicopy |
aMATα can1-100 his3-11,15 trp1-1 leu2-3,112 ura3-1.
bSingle-copy gene integration at URA3 locus was confirmed using PCR.
cLEU2 restored by integrating pRS405 plasmid into leu2-3,112 locus.
Ninety-six–well plate luminescence assay
A Wallac Victor 3 plate reader was used to measure luminescence intensity (Figures 2 and 3). Yeast strains were grown overnight to reach OD660 ≈ 0.2. Our growth medium was SCD–Met at pH 3.8 for beetle luciferases and pH 6.0 for NLuc. The samples were then diluted to OD660 ≈ 0.1 and loaded in a 96-well black assay plate (nontreated) with flat, clear bottom. At the beginning of the time course, 100 μM beetle luciferin or 20 μM furimazine was added to the cell cultures. All cultures were grown in a 30°C incubator, and before each measurement, plates were vortexed for 30 s to resuspend and oxygenate the cell cultures. Luminescence intensity in each well was measured over a 0.5-s exposure time, and samples were spread along the plate in a chess pattern to minimize light leakage from well to well.
Time-lapse luminescence microscopy
The brightest multicopy strain of each luciferase (Figure 3B) was grown in culture tubes overnight in a 30°C incubator to reach OD660 ≈ 0.1–0.2. Metabolite-repressed promoter strains were pregrown in dropout medium to induce (SCD-Metabolite) or in synthetic complete medium to repress (SCD) luciferases. The CellAsic microfluidic chamber has a ceiling height of 4 μm, which is the dimension of haploid yeast. However, yeast cells are naturally flocculent and clump during pregrowth. Thus we sonicated the yeast in a Bioruptor UCD-200 sonicator (Diagenode, Denville, NJ) for 30 s at medium intensity to obtain single-cell suspensions before loading them onto microfluidic plates (CellAsic). Media distribution was controlled by ONIX microfluidic perfusion platform, which provides a well-oxygenated environment. Bioluminescence imaging of yeast cells was performed with a DV Elite microscope equipped with UltimateFocus, an Evolve EMCCD camera (Photometrics, Tucson, AZ), and a 60×/1.25 numerical aperture phase-contrast oil objective lens. Cells were grown at 30°C in complete (SCD) or dropout medium (SCD–Met, SCD–Ade, SCD–Lys, SCD–Leu) at pH 3.8. The medium was supplemented with 200 μM beetle d-luciferin. We imaged cells every 4 min. To improve signal-to-noise ratios, we used 2 × 2 binning (256 × 256 pixels) and a camera gain of 55 with a transfer speed of 5000. The microscope was in an isolated, dark room with a floor-to-ceiling curtain. All light sources in the microscope, computer, and other equipment in the room were wrapped with foil paper and dark tape. We blocked all excitation light, and we removed the emission filters to maximize light transmission. We also modified our time-lapse macro to turn off the UltimateFocus laser every time we did a luminescence exposure.
Time-lapse files with raw luminescence data were preprocessed in Fiji (Schindelin et al., 2012) in the following order: 1) remove bright spot artifacts (i.e., hot pixels), with Remove Outliers function (threshold 1000; 20-pixel radius) for each z-slice, 2) use Sum Slices projection under Z Project menu, and 3) save integrated z-stack in tiff format. Phase-contrast images were imported into CellStat (a MATLAB plug-in; Kvarnström et al., 2008) to segment and track yeast cells over time. Each cell contour over time was verified manually and refined when needed. To retrieve the total luminescence and fluorescence for each cell, the preprocessed luminescence files were imported into CellStat and merged with phase-contrast image contours. Time-course data and statistics were retrieved using the Highest method from CellStat.
Fitting a simple model of gene expression to luminescence data
We developed a quantitative model of gene expression to objectively compare different luciferases as transcriptional reporters. The simplest is a binary model of transcription, which assumes that upon induction or repression, the gene expression output jumps between two synthesis rates. The approach to steady state is dictated by the degradation time scale (τ), which could be luciferase inactivation, degradation, and/or dilution through cell growth. To account for delays due to transcription, mRNA processing, translation, folding, or maturation of either luciferase or fluorescent protein, we included an explicit delay term (δ).
Repression model
where Smax and Smin are the steady-state concentrations of induced and repressed luminescence signal, respectively. We used nonlinear least squares (nlinfit in MATLAB) to fit our repression model to average the luminescence signal of single cells repressed by the addition of metabolite. The best-fit curves are shown in Supplemental Figures S2–S6, with the corresponding best-fit parameters (and confidence intervals) shown in Supplemental Table S1. The same repression model and fitting procedure was used for fluorescence signal.
Induction model
where Smax and Smin are the steady-state concentrations of induced and repressed luminescence signal, respectively. We used nonlinear least squares (nlinfit in MATLAB) to fit our induction model to average the luminescence signal of single cells induced by the removal of metabolite. The best-fit curves are shown in Supplemental Figures S2–S6. with the corresponding best–fit parameters (and confidence intervals) shown in Supplemental Table S1. The same induction model and fitting procedure was used for fluorescence signal.
Cell doubling time.
We measured the doubling time of single cells before switching the medium at ∼6 h by counting number of cells as a function of time. We used nonlinear least squares (“nlinfit” function in MATLAB) of a simple exponential exp[ln2(t/λ)] to fit the data. The estimated doubling time (λ) before medium switch and the 95% confidence intervals are shown in Supplemental Table S1. On average, cell-doubling time in medium with missing metabolites (SCD–Met, SCD–Leu, SCD–Ade, SCD–Lys) was ∼93 min compared to ∼86 min in complete medium.
Supplementary Material
Acknowledgments
We are grateful to the Duke Center for Systems Biology for early seed funding, Akihiro Imai and Sam Johnson (Duke University, Durham, NC) for early help with luminescence microscopy, Carl Johnson (Vanderbilt University, Nashville, TN) for the FLuc plasmid, Megan Gray (Promega) for early access to NLuc, Ian Stanton (Duke University) for use of the Therien lab spectrophotometer, and Mats Kvarnström (Fraunhofer-Chalmers Centre, Göteborg, Sweden) for the CellStat image segmentation program. We thank Sam Johnson, Danny Lew, Stefano Di Talia, and the members of the Buchler lab for helpful comments on the manuscript. This work was funded by Defense Advanced Research Projects Agency Biochronicity Grant DARPA-BAA-11-66, National Institutes of Health Director's New Innovator Award DP2 OD008654-01, and Burroughs Wellcome Fund CASI Award BWF 1005769.01.
Abbreviations used:
- Ade
adenine
- CCD
charge-coupled device
- GFP
green fluorescent protein
- Leu
leucine
- Lys
lysine
- Met
methionine
- NLS
nuclear localization signal
- SCD
synthetic complete dextrose
- SLIC
Sequence and Ligation Independent Cloning
- yEVenus
yeast-enhanced Venus
- YFP
yellow fluorescent protein.
Footnotes
This article was published online ahead of print in MBoC in Press (http://www.molbiolcell.org/cgi/doi/10.1091/mbc.E14-07-1187) on September 17, 2014.
REFERENCES
- Branchini BR, Magyar RA, Murtiashaw MH, Anderson SM, Helgerson LC, Zimmer M. Site-directed mutagenesis of firefly luciferase active site amino acids: a proposed model for bioluminescence color. Biochemistry. 1999;38:13223–13230. doi: 10.1021/bi991181o. [DOI] [PubMed] [Google Scholar]
- Charvin G, Cross FR, Siggia ED. A microfluidic device for temporally controlled gene expression and long-term fluorescent imaging in unperturbed dividing yeast cells. PLoS One. 2008;3:e1468. doi: 10.1371/journal.pone.0001468. [DOI] [PMC free article] [PubMed] [Google Scholar]
- Chiu CS, Kartalov E, Unger M, Quake S, Lester HA. Single-molecule measurements calibrate green fluorescent protein surface densities on transparent beads for use with “knock-in” animals and other expression systems. J. Neurosci Methods. 2001;105:55–63. doi: 10.1016/s0165-0270(00)00354-x. [DOI] [PubMed] [Google Scholar]
- Di Talia S, Skotheim JM, Bean JM, Siggia ED, Cross FR. The effects of molecular noise and size control on variability in the budding yeast cell cycle. Nature. 2007;448:947–951. doi: 10.1038/nature06072. [DOI] [PubMed] [Google Scholar]
- Di Talia S, Wang H, Skotheim JM, Rosebrock AP, Futcher B, Cross FR. Daughter-specific transcription factors regulate cell size control in budding yeast. PLoS Biol. 2009;7:e1000221. doi: 10.1371/journal.pbio.1000221. [DOI] [PMC free article] [PubMed] [Google Scholar]
- Frydman J, Erdjument-Bromage H, Tempst P, Hartl FU. Co-translational domain folding as the structural basis for the rapid de novo folding of firefly luciferase. Nat Struct Biol. 1999;6:697–705. doi: 10.1038/10754. [DOI] [PubMed] [Google Scholar]
- Fujii H, Noda K, Asami Y, Kuroda A, Sakata M, Tokida A. Increase in bioluminescence intensity of firefly luciferase using genetic modification. Anal Biochem. 2007;366:131–136. doi: 10.1016/j.ab.2007.04.018. [DOI] [PubMed] [Google Scholar]
- Garcia-Parajo MF, Segers-Nolten GMJ, Veerman JA, Greve J, Van Hulst NF. Real-time light-driven dynamics of the fluorescence emission in single green fluorescent protein molecules. Proc Natl Acad Sci USA. 2000;97:7237–7242. doi: 10.1073/pnas.97.13.7237. [DOI] [PMC free article] [PubMed] [Google Scholar]
- Gedeon T, Bokes P. Delayed protein synthesis reduces the correlation between mRNA and protein fluctuations. Biophys J. 2012;103:377–385. doi: 10.1016/j.bpj.2012.06.025. [DOI] [PMC free article] [PubMed] [Google Scholar]
- Grilly C, Stricker J, Pang WL, Bennett MR, Hasty J. A synthetic gene network for tuning protein degradation in Saccharomyces cerevisiae. Mol Syst Biol. 2007;3:127. doi: 10.1038/msb4100168. [DOI] [PMC free article] [PubMed] [Google Scholar]
- Hall MP, Unch J, Binkowski BF, Valley MP, Butler BL, Wood MG, Otto P, Zimmerman K, Vidugiris G, Machleidt T, et al. Engineered luciferase reporter from a deep sea shrimp utilizing a novel imidazopyrazinone substrate. ACS Chem Biol. 2012;7:1848–1857. doi: 10.1021/cb3002478. [DOI] [PMC free article] [PubMed] [Google Scholar]
- Hoshino H, Nakajima Y, Ohmiya Y. Luciferase-YFP fusion tag with enhanced emission for single-cell luminescence imaging. Nat Methods. 2007;4:637–639. doi: 10.1038/nmeth1069. [DOI] [PubMed] [Google Scholar]
- Kvarnström M, Logg K, Diez A, Bodvard K, Käll M. Image analysis algorithms for cell contour recognition in budding yeast. Opt Express. 2008;16:12943–12957. doi: 10.1364/oe.16.012943. [DOI] [PubMed] [Google Scholar]
- Kwon H, Enomoto T, Shimogawara M, Yasuda K, Nakajima Y, Ohmiya Y. Bioluminescence imaging of dual gene expression at the single-cell level. BioTechniques. 2010;48:460–462. doi: 10.2144/000113419. [DOI] [PubMed] [Google Scholar]
- Leskinen P, Virta M, Karp M. One-step measurement of firefly luciferase activity in yeast. Yeast. 2003;20:1109–1113. doi: 10.1002/yea.1024. [DOI] [PubMed] [Google Scholar]
- Liu AC, Welsh DK, Ko CH, Tran HG, Zhang EE, Priest AA, Buhr ED, Singer O, Meeker K, Verma IM, et al. Intercellular coupling confers robustness against mutations in the SCN circadian clock network. Cell. 2007;129:605–616. doi: 10.1016/j.cell.2007.02.047. [DOI] [PMC free article] [PubMed] [Google Scholar]
- Loening AM, Fenn TD, Wu AM, Gambhir SS. Consensus guided mutagenesis of Renilla luciferase yields enhanced stability and light output. Protein Eng Des Sel. 2006;19:391–400. doi: 10.1093/protein/gzl023. [DOI] [PubMed] [Google Scholar]
- Luker KE, Smith MCP, Luker GD, Gammon ST, Piwnica-Worms H, Piwnica-Worms D. Kinetics of regulated protein-protein interactions revealed with firefly luciferase complementation imaging in cells and living animals. Proc Natl Acad Sci USA. 2004;101:12288–12293. doi: 10.1073/pnas.0404041101. [DOI] [PMC free article] [PubMed] [Google Scholar]
- Malleshaiah MK, Shahrezaei V, Swain PS, Michnick SW. The scaffold protein Ste5 directly controls a switch-like mating decision in yeast. Nature. 2010;465:101–105. doi: 10.1038/nature08946. [DOI] [PubMed] [Google Scholar]
- Mateus C, Avery SV. Destabilized green fluorescent protein for monitoring dynamic changes in yeast gene expression with flow cytometry. Yeast. 2000;16:1313–1323. doi: 10.1002/1097-0061(200010)16:14<1313::AID-YEA626>3.0.CO;2-O. [DOI] [PubMed] [Google Scholar]
- Mihalcescu I, Hsing W, Leibler S. Resilient circadian oscillator revealed in individual cyanobacteria. Nature. 2004;430:81–85. doi: 10.1038/nature02533. [DOI] [PubMed] [Google Scholar]
- Nakajima Y, Kimura T, Sugata K, Enomoto T, Asakawa A, Kubota H, Ikeda M, Ohmiya Y. Multicolor luciferase assay system: one-step monitoring of multiple gene expressions with a single substrate. BioTechniques. 2005;38:891–894. doi: 10.2144/05386ST03. [DOI] [PubMed] [Google Scholar]
- Nakajima Y, Yamazaki T, Nishii S, Noguchi T, Hoshino H, Niwa K, Viviani VR, Ohmiya Y. Enhanced beetle luciferase for high-resolution bioluminescence imaging. PLoS One. 2010;5:e10011. doi: 10.1371/journal.pone.0010011. [DOI] [PMC free article] [PubMed] [Google Scholar]
- Orr-Weaver TL, Szostak JW, Rothstein RJ. Yeast transformation: a model system for the study of recombination. Proc Natl Acad Sci USA. 1981;78:6354–6358. doi: 10.1073/pnas.78.10.6354. [DOI] [PMC free article] [PubMed] [Google Scholar]
- Ozawa T, Kaihara A, Sato M, Tachihara K, Umezawa Y. Split luciferase as an optical probe for detecting protein-protein interactions in mammalian cells based on protein splicing. Anal Chem. 2001;73:2516–2521. doi: 10.1021/ac0013296. [DOI] [PubMed] [Google Scholar]
- Robertson JB, Stowers CC, Boczko E, Johnson CH. Real-time luminescence monitoring of cell-cycle and respiratory oscillations in yeast. Proc Natl Acad Sci USA. 2008;105:17988–17993. doi: 10.1073/pnas.0809482105. [DOI] [PMC free article] [PubMed] [Google Scholar]
- Sadowski I, Su T-C, Parent J. Disintegrator vectors for single-copy yeast chromosomal integration. Yeast. 2007;24:447–455. doi: 10.1002/yea.1469. [DOI] [PubMed] [Google Scholar]
- Saito K, Chang Y-F, Horikawa K, Hatsugai N, Higuchi Y, Hashida M, Yoshida Y, Matsuda T, Arai Y, Nagai T. Luminescent proteins for high-speed single-cell and whole-body imaging. Nature Commun. 2012;3:1262. doi: 10.1038/ncomms2248. [DOI] [PMC free article] [PubMed] [Google Scholar]
- Schindelin J, Arganda-Carreras I, Frise E, Kaynig V, Longair M, Pietzsch T, Preibisch S, Rueden C, Saalfeld S, Schmid B, et al. Fiji: an open-source platform for biological-image analysis. Nat Methods. 2012;9:676–682. doi: 10.1038/nmeth.2019. [DOI] [PMC free article] [PubMed] [Google Scholar]
- Sheff MA, Thorn KS. Optimized cassettes for fluorescent protein tagging in Saccharomyces cerevisiae. Yeast. 2004;21:661–670. doi: 10.1002/yea.1130. [DOI] [PubMed] [Google Scholar]
- Skotheim JM, Di Talia S, Siggia ED, Cross FR. Positive feedback of G1 cyclins ensures coherent cell cycle entry. Nature. 2008;454:291–296. doi: 10.1038/nature07118. [DOI] [PMC free article] [PubMed] [Google Scholar]
- Spellman PT, Sherlock G, Zhang MQ, Iyer VR, Anders K, Eisen MB, Brown PO, Botstein D, Futcher B. Comprehensive identification of cell cycle-regulated genes of the yeast Saccharomyces cerevisiae by microarray hybridization. Mol Biol Cell. 1998;9:3273–3297. doi: 10.1091/mbc.9.12.3273. [DOI] [PMC free article] [PubMed] [Google Scholar]
- Vieites JM, Navarro-García F, Pérez-Díaz R, Pla J, Nombela C. Expression and in vivo determination of firefly luciferase as gene reporter in Saccharomyces cerevisiae. Yeast. 1994;10:1321–1327. doi: 10.1002/yea.320101009. [DOI] [PubMed] [Google Scholar]
- Viviani VR, Bechara EJ, Ohmiya Y. Cloning, sequence analysis, and expression of active Phrixothrix railroad-worms luciferases: relationship between bioluminescence spectra and primary structures. Biochemistry. 1999a;38:8271–8279. doi: 10.1021/bi9900830. [DOI] [PubMed] [Google Scholar]
- Viviani VR, Silva AC, Perez GL, Santelli RV, Bechara EJ, Reinach FC. Cloning and molecular characterization of the cDNA for the Brazilian larval click-beetle Pyrearinus termitilluminans luciferase. Photochem Photobiol. 1999b;70:254–260. doi: 10.1562/0031-8655(1999)070<0254:camcot>2.3.co;2. [DOI] [PubMed] [Google Scholar]
- Wang X, Errede B, Elston TC. Mathematical analysis and quantification of fluorescent proteins as transcriptional reporters. Biophys J. 2008;94:2017–2026. doi: 10.1529/biophysj.107.122200. [DOI] [PMC free article] [PubMed] [Google Scholar]
- Wilson T, Hastings JW. Bioluminescence. Annu Rev Cell Dev Biol. 1998;14:197–230. doi: 10.1146/annurev.cellbio.14.1.197. [DOI] [PubMed] [Google Scholar]
- Wood KV, DeLuca M. Photographic detection of luminescence in Escherichia coli containing the gene for firefly luciferase. Anal Biochem. 1987;161:501–507. doi: 10.1016/0003-2697(87)90480-5. [DOI] [PubMed] [Google Scholar]
- Xu Y, Piston DW, Johnson CH. A bioluminescence resonance energy transfer (BRET) system: Application to interacting circadian clock proteins. Proc Natl Acad Sci USA. 1999;96:151–156. doi: 10.1073/pnas.96.1.151. [DOI] [PMC free article] [PubMed] [Google Scholar]
Associated Data
This section collects any data citations, data availability statements, or supplementary materials included in this article.