

Abstract
In skeletal muscle fibres, glycogen has been shown to be stored at different subcellular locations: (i) between the myofibrils (intermyofibrillar); (ii) within the myofibrils (intramyofibrillar); and (iii) subsarcolemmal. Of these, intramyofibrillar glycogen has been implied as a critical regulator of sarcoplasmic reticulum Ca2+ release. The aim of the present study was to test directly how the decrease in cytoplasmic free Ca2+ ([Ca2+]i) during repeated tetanic contractions relates to the subcellular glycogen distribution. Single fibres of mouse flexor digitorum brevis muscles were fatigued with 70 Hz, 350 ms tetani given at 2 s (high-intensity fatigue, HIF) or 10 s (low-intensity fatigue, LIF) intervals, while force and [Ca2+]i were measured. Stimulation continued until force decreased to 30% of its initial value. Fibres were then prepared for analyses of subcellular glycogen distribution by transmission electron microscopy. At fatigue, tetanic [Ca2+]i was reduced to 70 ± 4% and 54 ± 4% of the initial in HIF (P < 0.01, n = 9) and LIF (P < 0.01, n = 5) fibres, respectively. At fatigue, the mean inter- and intramyofibrillar glycogen content was 60–75% lower than in rested control fibres (P < 0.05), whereas subsarcolemmal glycogen was similar to control. Individual fibres showed a good correlation between the fatigue-induced decrease in tetanic [Ca2+]i and the reduction in intermyofibrillar (P = 0.051) and intramyofibrillar (P = 0.0008) glycogen. In conclusion, the fatigue-induced decrease in tetanic [Ca2+]i, and hence force, is accompanied by major reductions in inter- and intramyofibrillar glycogen. The stronger correlation between decreased tetanic [Ca2+]i and reduced intramyofibrillar glycogen implies that sarcoplasmic reticulum Ca2+ release critically depends on energy supply from the intramyofibrillar glycogen pool.
Introduction
Ca2+ plays a pivotal role in muscle contractility. It is released from the intracellular store, the sarcoplasmic reticulum (SR), upon muscle activation by action potential propagation into the transverse tubular system (T-tubular system) and activation of voltage sensor molecules (dihydropyridine receptors), which in turn open SR Ca2+ release channels (ryanodine receptors; for review see Dulhunty, 2006). The released Ca2+ gives rise to a transient increase in cytoplasmic free [Ca2+] ([Ca2+]i) resulting in the initiation of cross-bridge cycling (for review see Gordon et al. 2000).
In skeletal muscle, a decrease in Ca2+ release from SR is known to occur during fatigue from most types of exercise (Favero et al. 1993; Duhamel et al. 2006; Ørtenblad et al. 2011; Gejl et al. 2014) and during repeated activation in vitro (Westerblad & Allen, 1991, Fryer et al. 1995; Chin & Allen, 1997). The impaired SR Ca2+ release will eventually decrease [Ca2+]i leading to loss of force. The mechanism(s) underlying the fatigue-induced decrease in SR Ca2+ release is not fully understood (Allen et al. 2008), but one factor causing reduced release appears to be decreased endogenous glycogen stores (Allen et al. 2008; Ørtenblad et al. 2013). A connection between glycogen and SR Ca2+ release was first observed by Chin & Allen (1997) using intact mouse single muscle fibres to measure tetanic force and [Ca2+]i and small fibre bundles to measure glycogen content during identical conditions. They demonstrated that when fibres were first fatigued by repeated tetani and then allowed to recover, the reduction in [Ca2+]i and force in a subsequent fatigue run occurred more rapidly when fibres had recovered in glucose-free medium than in standard glucose-containing medium. This association between reductions in glycogen and SR Ca2+ release has later been confirmed in other studies (Kabbara et al. 2000; Helander et al. 2002).
The results of more recent studies indicate that the role of glycogen in skeletal muscle fatigue depends on the subcellular localization of glycogen (for reviews see Nielsen & Ørtenblad, 2013 and Ørtenblad et al. 2013). Three subcellular localizations have been defined (Fridén et al. 1989; Marchand et al. 2002): (i) intermyofibrillar glycogen located between the myofibrils in close connection to mitochondria; (ii) intramyofibrillar glycogen located within the myofibrils most often in the I band; and (iii) subsarcolemmal glycogen located just beneath the surface membrane of the fibre along with mitochondria and nuclei.
Two studies using different techniques indicate that intramyofibrillar glycogen is associated with the control of SR Ca2+ release (Nielsen et al. 2009; Ørtenblad et al. 2011). The first study used mechanically skinned rat extensor digitorum longus muscle fibres and showed that only intramyofibrillar glycogen correlated with fatigue resistance, hence indicating a relationship between intramyofibrillar glycogen and SR Ca2+ release (Nielsen et al. 2009). The second study showed in isolated SR vesicles that only the intramyofibrillar glycogen content correlated with the Ca2+ release rate (Ørtenblad et al. 2011). Together these studies indicate that the decreased [Ca2+]i at fatigue is likely to be connected to a localization-specific depletion of glycogen within the muscle fibres.
With the use of intact living single fibres, force and [Ca2+]i, as well as glycogen content and localization can be measured in the same fibre. Using this technique, we aimed to answer the question whether the fatigue-induced reduction in tetanic [Ca2+]i during fatigue correlates with a specific depletion of intramyofibrillar glycogen.
Methods
Ethical approval
All experiments complied with the Swedish Animal Welfare Act, the Swedish Welfare ordinance, and applicable regulations and recommendations from Swedish authorities. The study was approved by the Stockholm North Ethical Committee on Animal Experiments. The experiments comply with the policies of the Journal of Physiology (Drummond, 2009). Female C57BL/6 mice (n = 18) were killed by rapid neck disarticulation.
Force and [Ca2+]i measurements
Intact single flexor digitorum brevis (FDB) fibres with tendons were mechanically dissected. Aluminium T clips were attached to tendons of the isolated fibre. The fibre was then placed in a stimulation chamber between an Akers 801 force transducer (Kronex Technologies, Oakland, California, USA) and an adjustable holder. The fibre was stimulated with supramaximal electrical pulses (0.5 ms in duration) delivered via platinum electrodes placed along the long axis of the fibre. The length of the fibre was adjusted to achieve maximum tetanic force, and the fibre diameter at this length was measured to calculate the cross-sectional area. Fibres were initially superfused at room temperature (25°C) by Tyrode solution containing (in mm) 121 NaCl, 5.0 KCl, 1.8 CaCl2, 0.5 MgCl2, 0.4 NaH2PO4, 24.0 NaHCO3 and 0.1 EDTA. The solution was bubbled with 95% O2–5% CO2, giving pH 7.4. Foetal calf serum (0.2%) was also added to the solution.
To measure [Ca2+]i, fibres were pressure injected with the fluorescent indicator indo-1 (Molecular Probes/Invitrogen, Carlsbad, CA, USA). Indo-1 was excited at 360 ± 5 nm and the light emitted at 405 ± 5 and 495 ± 5 nm was measured with two photomultiplier tubes (Photon Technology International, Wedel, Germany). Indo-1 fluorescence signals were converted into [Ca2+]i using an in vivo calibration previously described (Andrade et al. 1998, Bruton et al. 2012). Fluorescence and force signals were sampled online at 100 Hz and stored on a computer for subsequent data analysis.
Stimulation protocols
At the start of each experiment, fibres were stimulated with 350 ms tetani every 1 min at 15 to 150 Hz and force and [Ca2+]i were measured to ensure similar basic properties for fibres in each of the four groups: control (Con), high-intensity fatigue (HIF), low-intensity fatigue (LIF) and low-intensity equivalent (LIE) (described below). There were no differences in either peak force at 150 Hz (P = 0.87) or in the [Ca2+]i giving 50% of the maximum force between groups (P = 0.24).
Con fibres did not undergo fatiguing stimulation and were prepared for transmission electron microscopy (TEM) after performing the force-frequency measurements. We were interested in evaluating the relationship between glycogen depletion with respect to [Ca2+]i and force during different fatigue paradigms. Thus to prevent glycogen resynthesis, all fibres exposed to repeated tetani (70 Hz, 350 ms duration) were superfused by a glucose-free Tyrode solution throughout the stimulation period. Fibres in the HIF group were stimulated with tetani repeated every 2 s until the force was reduced to 30% of its initial value. Fibres in the LIF group were stimulated with tetani repeated every 10 s until the force decreased to 30% of its initial value. Fibres in the LIE group were also stimulated every 10 s but performed a total of 42 contractions, which was the mean number of contractions performed by fibres in the HIF group.
Glycogen measurements
Immediately after the end of the stimulation protocol, fibres were prepared for TEM as previously described (Nielsen et al. 2009). Briefly, the fibres were fixed with a 2.5% glutaraldehyde in 0.1 m sodium cacodylate buffer (pH 7.3) for 24 h and subsequently rinsed four times in 0.1 m sodium cacodylate buffer. Following rinsing, fibres were post-fixed with 1% osmium tetroxide (OsO4) and 1.5% potassium ferrocyanide [K4Fe(CN)6] in 0.1 m sodium cacodylate buffer for 90 min at 4°C. After post-fixation, the fibres were rinsed twice in 0.1 m sodium cacodylate buffer at 4°C, dehydrated through a graded series of alcohol at 4–20°C, infiltrated with graded mixtures of propylene oxide and Epon at 20°C, and embedded in 100% Epon at 30°C.
In each fibre, ultrathin (60 nm) sections were cut (using a Leica Ultracut UCT ultramicrotome, Leica Microsystems A/S, Ballerup, Denmark) in two depths (separated by 6 μm) of the longitudinal oriented fibre and contrasted with uranyl acetate and lead citrate. Sections were examined and photographed in a precalibrated transmission electron microscope (Philips EM 208 (Philips, Amsterdam, The Netherlands) and a Megaview III FW camera (Olympus, Soft Imaging Solutions GmbH, Münster, Germany) or a Philips CM100 (Philips, Amsterdam, The Netherlands) and an Olympus Veleta camera (Olympus, Soft Imaging Solutions GmbH, Münster, Germany)). From each fibre, a total of 48 images were obtained at ×34–40,000 magnification in a randomized systematic order, including 24 images from the subsarcolemmal region and 24 images from the myofibrillar region.
The glycogen volume in the three subcellular localizations (inter- and intramyofibrillar and subsarcolemmal) was quantified using the TEM images and standard stereological methods (Weibel, 1980; Gundersen et al. 1988). The volume fraction (VV) of glycogen in each location was estimated as proposed by Weibel (1980; their eqn 4.20), taking the effect of section thickness into account: VV = AA − t((1/π)BA − NA((tH)/(t + H))), where AA is the glycogen area fraction, t section thickness (60 nm), BA glycogen boundary length density, NA number of particles per area and H is the average glycogen profile diameter. It was assumed that the particles were spherical (Melendez-Hevia et al. 1993). The glycogen area fraction was estimated by point counting (using a grid with a size of 60 nm) and the average glycogen profile diameter was directly measured using iTEM (FEI Company, Eindhoven, The Netherlands). The glycogen boundary length density (BA) was calculated based on the direct measurement of glycogen particle diameter: BA = ((π SV)/4) + (t NV π h), where SV is the glycogen particle surface area density, and Nv is the number of particles per volume.
Intermyofibrillar glycogen content is expressed relative to the myofibrillar space (estimated by point counting using a grid size of 300 nm). Intramyofibrillar glycogen is expressed relative to the intramyofibrillar space (estimated by point counting using a grid size of 300 nm), and subsarcolemmal glycogen was expressed relative to the fibre surface (estimated by direct length measurements). The fibres were assumed to be of cylindrical shape with a diameter of 30 μm when the distribution of glycogen between the three locations is expressed relative to the total content.
As described above, inter- and intramyofibrillar glycogens are expressed as volume densities, whereas subsarcolemmal glycogen is expressed as volume per fibre surface area. To assess the relative distribution of the different glycogen pools, subsarcolemmal glycogen is also expressed relative to the volume beneath the surface area of a cylindrically shaped fibre (Vb) = R × 0.5 × A, where R is fibre radius and A is the fibre surface area (see Fig.6E–G). All analyses were performed by the same blinded investigator. The variation in the parameters between images was used to estimate a coefficient of error (CEest) as proposed for stereological ratio estimates by Howard and Reed (2005). The CEest were 0.13, 0.14 and 0.19 for inter- and intramyofibrillar and subsarcolemmal glycogen, respectively.
Figure 6. Mice have a different subcellular distribution of skeletal muscle glycogen compared with humans.
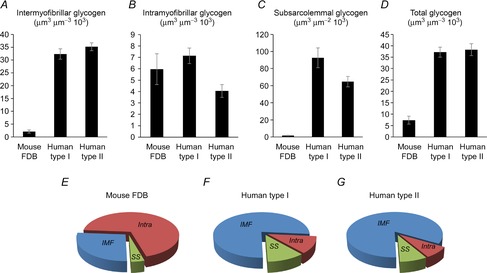
Comparison between control mouse FDB fibres (n = 10) and human type I (n = 30 fibres from 10 subjects) and type II (n = 29 fibres from 10 subjects) muscle fibres (human data obtained from Nielsen et al. 2011). Mouse fibres have much lower intermyofibrillar (A), subsarcolemmal (C) and total (D) glycogen content, whereas the levels of intramyofibrillar glycogen (B) is comparable to human fibres. Thus, relative distributions show that intramyofibrillar glycogen is the largest subfraction in mouse fibres (E), whereas intermyofibrillar glycogen is the largest in human fibres (F and G). FDB, flexor digitorum brevis; IMF, intermyofibrillar; Intra, intramyofibrillar; SS, subsarcolemmal.
Statistics
Statistical analyses were performed using Stata 10.1 (StataCorp. 2007; Stata Statistical Software: Release 10; StataCorp LP, College Station, TX, USA). Group differences in glycogen content were tested using the non-parametric Kruskal–Wallis rank sum test and post hoc pairwise comparisons with the Mann–Whitney U test. Group differences in force and [Ca2+]i were determined using unpaired and paired Student's t tests, or univariate ANOVA where appropriate. Data are presented as means ± SEM unless otherwise indicated. The significance level was set at 0.05.
Results
Force and [Ca2+]i for different stimulation protocols
Several fibres in each group (Con, n = 10; HIF, n = 10; LIF, n = 6; LIE, n = 2) were damaged during the preparation procedure for TEM and were excluded from all analyses.
During fatiguing stimulation, the total mean time required to reach 30% of the initial force was ∼82 s in the HIF group and ∼770 s in the LIF group (Fig.1). HIF fibres also performed fewer contractions to reach 30% of the initial force (41 ± 5, n = 9) than LIF fibres (77 ± 13, n = 5; P < 0.01). Interestingly, tetanic [Ca2+]i was better preserved at the end of fatigue in HIF than in LIF fibres (70 ± 4% vs. 54 ± 4% of the initial; P < 0.01) (Fig.2), which indicates that the force decrease in HIF fibres also involved a decreased myofibrillar Ca2+ sensitivity (Allen et al. 2008). Furthermore, fatigue in the HIF group was characterized by a slowing of relaxation (tetanic half-relaxation time increased to 166 ± 29% of its initial value; P = 0.05), whereas the half-relaxation time was unaffected in fatigued LIF fibres (98 ± 24% of its initial value; P = 0.93). At the end of fatiguing stimulation, resting [Ca2+]i showed a markedly larger increase in HIF fibres (223 ± 22%) than in LIF fibres (147 ± 21%; P < 0.05). Thus, markedly larger functional changes associated with acute fatigue were observed in HIF than in LIF fibres (Allen et al. 2008).
Figure 1. Typical original records from single flexor digitorum brevis fibres of fatigue-induced changes in tetanic [Ca2+]i and force during repetitive stimulation with the high-intensity fatigue (A) and low-intensity fatigue protocols (B).
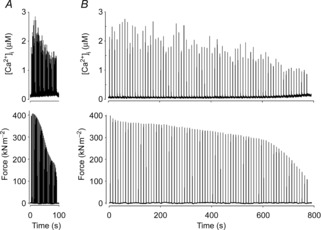
Muscle fibres were either stimulated every 2 s (A) or every 10 s (B) until force production was decreased to 30% of its initial value.
Figure 2. Typical and mean data for high-intensity fatigue fibres (A) and low-intensity fatigue fibres (B) showing [Ca2+]i and force for the first and last contraction of repetitive stimulation.
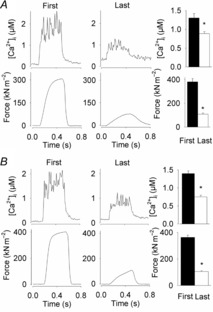
Means ± SEM, n = 9 and n = 5, respectively. *Last contraction is significantly different from the first (P < 0.05).
Fibres in the LIE group performed 42 contractions (mean number of contractions in the HIF group) at 10 s intervals. Based on the force loss during the repeated tetani, LIE fibres were divided into two groups: fibres with >75% force loss (LIE fatigued, LIE-F; n = 5) and fibres with <50% force loss (LIE non-fatigued, LIE-N; n = 9 fibres) (Fig.3). At the end of the stimulation period, the mean tetanic [Ca2+]i and force were decreased to 48 ± 6% and 5 ± 2% of the initial in LIE-F fibres and the corresponding values in LIE-N were 88 ± 6% and 78 ± 4%, respectively. The half-relaxation time was unaffected at the end of the stimulation protocol in both LIE-F and LIE-N fibres (93 ± 20% and 93 ± 7% of the respective initial values).
Figure 3. Typical and mean data for low-intensity equivalent fatigued fibres (A) and low-intensity equivalent non-fatigued fibres (B) showing [Ca2+]i and force for the first and last contraction of repetitive stimulation.
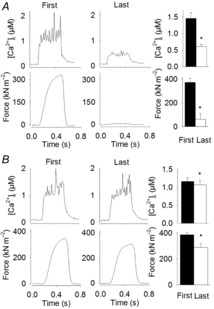
Means ± SEM, n = 5 and n = 9, respectively. *Last contraction is significantly different from the first (P < 0.05).
Subcellular glycogen localization at the end of the different stimulation protocols
Immediately after the stimulation protocols, fibres were prepared for TEM where the content and localization of glycogen were quantified. Representative images are shown in Fig.4. In control fibres, glycogen content was distributed with 4 ± 1% as subsarcolemmal and the remaining glycogen was distributed with 72 ± 3% as intramyofibrillar and 28 ± 3% as intermyofibrillar. Thus, subsarcolemmal glycogen constitutes a small fraction of total glycogen in these mouse FDB muscle fibres, and the intramyofibrillar fraction accounts for three-fold more glycogen than the intermyofibrillar fraction.
Figure 4. Transmission electron microscopy images showing representative sarcomeres from control (A) and low-intensity fatigued (B) fibres.
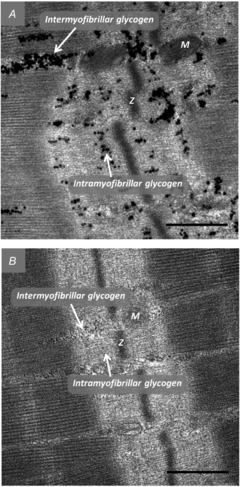
Fibres were fixed in glutaraldehyde immediately after the stimulation protocol and subsequently prepared for glycogen visualization by transmission electron microscopy (see Materials and methods). Glycogen can be seen as the black circles located both within the myofibrils (intramyofibrillar) and between myofibrils (intermyofibrillar). M, mitochondria; Z, z-line. Original magnification ×40,000. Scale bars represent 500 nm.
Compared with control fibres, the mean intermyofibrillar glycogen content was decreased by 62 ± 3% in HIF (P < 0.05), 74 ± 6% in LIF (P < 0.01) and 75 ± 6% in LIE-F (P < 0.01) fibres at the end of the stimulation protocol (Fig.5A). A similar picture emerged for intramyofibrillar glycogen, which was reduced by 60 ± 4% in HIF (P < 0.01), 71 ± 5% in LIF (P < 0.01) and 68 ± 8% in LIE-F (P < 0.01) fibres (Fig.5B). On the other hand, the mean inter- and intramyofibrillar glycogen did not differ between LIE-N and control fibres. Thus, the relative distribution of glycogen between inter- and intramyofibrillar localizations was not different in any of the five groups of fibres (P = 0.93).
Figure 5. Inter- and intramyofibrillar glycogen are markedly decreased in fatigued fibres.
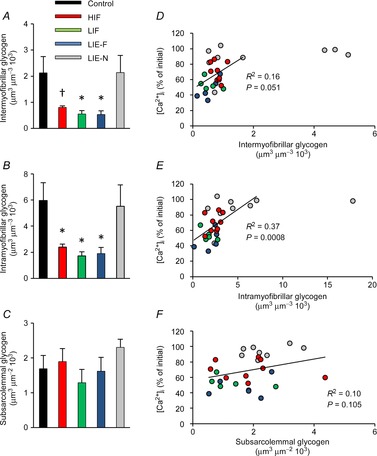
The content of three subcellular localizations of glycogen (A, intermyofibrillar; B, intramyofibrillar; C, subsarcolemmal) was estimated based on transmission electron microscopy images of control fibres (black, n = 10), HIF (red, n = 9), LIF (green, n = 5), LIE-F (blue, n = 5) and LIE-N (grey, n = 9) fibres. Data are means ± SEM †P < 0.05 compared to control fibres. *P < 0.01 compared to control fibres. D–F, the relation between tetanic [Ca2+]i at the end of the stimulation period and subcellular glycogen content of individual fibres. Colour coding as in A–C. Regression analyses were performed on data points from HIF, LIF and LIE fibres. HIF, high-intensity fatigued; LIE-F, low-intensity equivalent fatigued; LIE-N, low-intensity equivalent non-fatigued; LIF, low-intensity fatigued.
The subsarcolemmal glycogen content was not lower in any of the fatigued groups of fibres compared to control or LIE-N fibres (Fig.5C). A consequence of the unchanged subsarcolemmal glycogen and decreased inter- and intramyofibirllar glycogen following stimulation was that the relative amount of subsarcolemmal glycogen to total glycogen increased from ∼4% before to ∼10% after stimulation in HIF, LIF and LIE-F fibres (P < 0.01).
In Fig.5D–F we plotted tetanic [Ca2+]i vs. subcellular glycogen contents for individual fibres. This analysis reveals a large span of inter- and intramyofibrillar glycogen content in LIE-N fibres, which was accompanied by high tetanic [Ca2+]i. The variation between fibres in inter- and intramyofibrillar glycogen content was much smaller for the three groups of fibres showing decreased force at the end of the stimulation period (i.e. HIF, LIF and LIE-F). In these groups there was a steep relationship between decreasing tetanic [Ca2+]i and low glycogen (Fig.5D and E) and correlation analyses suggest that tetanic [Ca2+]i is more closely associated with intramyofibrillar glycogen (R2 = 0.37, P = 0.0008) than with intermyofibrillar glycogen (R2 = 0.16, P = 0.051) (Fig.5D and E). As expected, there was no clear relation between tetanic [Ca2+]i and subsarcolemmal glycogen content (Fig.5F).
Discussion
In the present study, we used a novel powerful procedure to first measure [Ca2+]i and force during repeated contractions in an intact single muscle fibre, and subsequently to quantify subcellular glycogen depletion with electron microscopy in the same single fibre. The results demonstrate a close relationship between severe depletion of inter- and intramyofibrillar glycogen and a fatigue-induced decrease in tetanic [Ca2+]i, and hence force. On the other hand, subsarcolemmal glycogen content was not different between unfatigued and fatigued fibres, suggesting that processes controlling SR Ca2+ release are independent of this glycogen pool.
Glycogen and fatigue: What are the mechanisms?
Mean inter- and intramyofibrillar glycogen was markedly lower in the groups of fibres where tetanic [Ca2+]i, and hence force, were severely decreased by repeated contractions (i.e. HIF, LIF and LIE-F fibres) than in groups where tetanic [Ca2+]i and force were high (i.e. control and LIE-N; see Fig.5A and B). This is in accordance with human studies showing that when performing moderate to high-intensity exercise, there is an almost complete depletion of the muscle glycogen stores at the time point of voluntary exhaustion (Hermansen et al. 1967; Karlsson et al. 1974). However, the picture becomes less clear when values from individual fibres are considered (see Fig.5D and E). The spread in glycogen content between fibres in the HIF, LIF and LIE-F groups is rather small and these fibres show a clear positive correlation between decreasing inter- and intramyofibrillar glycogen and decreasing tetanic [Ca2+]i. These data indicate that inter- and intramyofibrillar glycogen must become almost depleted by repeated contractions (fractional glycogen volumes below ∼1/1000 and ∼1/3000, respectively) before the decrease starts to be associated by a consistent negative impact on SR Ca2+ release (decreased to or below 80% of initial). Intriguingly, a threshold value of 1/3000 for intramyofibrillar glycogen has also been found for diminished fatigue resistance capacity of rat extensor digitorum longus single fibres (Nielsen et al. 2009), and decreased calcium release rate in isolated SR vesicles from human muscle biopsies (Ørtenblad et al. 2011). Thus, the sensitivity of the SR Ca2+ release process for intramyofibrillar glycogen seems to be conserved across the investigated mammalian species and experimental conditions.
Although the mean inter- and intramyofibrillar glycogen was markedly higher in control and LIE-N fibres than in the other three groups, there was a large spread in glycogen concentrations (see Fig.5) with some control and LIE-N fibres having glycogen levels as low as in the other groups, but tetanic [Ca2+]i was still normal. The reason for this is uncertain but may be related to the fact that glycogen could only be measured in a small fraction of the total cell volume and this cell fraction may not be fully representative of the whole fibre. Furthermore, the link between decreased glycogen and reduced SR Ca2+ release is likely to be indirect, mediated via the metabolic disturbance caused by glycogen depletion. Control and LIE-stimulated fibres were exposed to no or limited metabolic challenge, and hence changes in metabolites (e.g. increased concentration of inorganic phosphate ions or decreased ATP) and their effects on SR Ca2+ release would be limited despite low glycogen levels. These two factors may also explain why the correlation between the fatigue-induced decrease in tetanic [Ca2+]i and the reduction in inter- and intramyofibrillar were not higher than R2 0.16 and 0.37, respectively.
A conspicuous finding of the present study is that tetanic [Ca2+]i was severely decreased in LIF and LIE-F fibres, but still these fibres showed no obvious signs of fatigue-induced changes of myofibrillar function, e.g. no slowing of relaxation. Mean tetanic [Ca2+]i was, in fact, more decreased in LIF fibres than in HIF fibres despite both being stimulated until force was decreased to 30% of the initial, which indicates decreased myofibrillar Ca2+ sensitivity in the latter. Numerous studies have shown that fatigue-induced slowing of relaxation and decreased myofibrillar Ca2+ sensitivity are consequences of increased stress on the energy metabolism (Allen et al. 2008). Our present results from LIF and LIE-F fibres then show that decreased tetanic [Ca2+]i can occur even without obvious signs of adverse effects on myofibrillar function (e.g. decreased Ca2+ sensitivity and slowed relaxation). This might be taken as evidence for metabolic microenvironments within muscle fibres, where some regions experience severe metabolic disturbance (e.g. regions important for SR Ca2+ release), whereas other regions are little affected (e.g. myofibrils). This would also fit with different roles for inter- and intramyofibrillar glycogen, where the latter would be the pool important for SR Ca2+ release (Ørtenblad et al. 2011).
The results of the present LIF and LIE-F fibres (i.e. decreased tetanic [Ca2+]i accompanied by little change of myofibrillar function) are essentially opposite to those previously observed in FDB fibres of creatine kinase deficient (CK–/–) mice. In these CK–/– fibres, tetanic [Ca2+]i is well maintained during fatigue induced by repeated tetanic stimulation and the force decrease is mainly due to defective myofibrillar function. This pattern was observed both when CK–/– fibres were fatigued under control conditions (Dahlstedt et al. 2000) and when mitochondrial respiration was inhibited by cyanide (Bruton et al. 2003). Similar results with maintained tetanic [Ca2+]i during repeated tetanic stimulation were also observed when CK was pharmacologically inhibited with 2,4-dinitro-1-fluorobenzene (Dahlstedt & Westerblad, 2001). Assuming that inter- and intramyofibrillar glycogen are reduced also when CK is inhibited, these results suggest that the decrease in tetanic [Ca2+]i requires both glycogen depletion and break-down of phosphocreatine. One possible underlying mechanism is that the myoplasmic concentration of inorganic phosphate ions (Pi) increases as phosphocreatine breaks down. Pi then enters the SR via small conductance chloride channels and the open probability of these increases when [ATP] decreases because of glycogen depletion. Subsequently, the increased [Pi] in the SR causes Ca2+-Pi precipitation, which decreases the Ca2+ available for release (Allen et al. 2008 and references therein).
Alternatively, the decrease in tetanic [Ca2+]i could potentially be explained by decreased membrane excitability. Indeed, maintenance of resting membrane potential by Na+/K+ pumps during repetitive muscle contractions depend on the presence of glycolytic ATP production (James et al. 1999; Dutka & Lamb, 2007). Interestingly, the majority of Na+/K+ pumps and the SR Ca2+ release channels are colocalized within the diffusion-restricted space between SR and the T-tubular system. Thus, they would share a common glycogen pool and indirect evidence suggests that this is the intramyofibrillar glycogen pool (Nielsen et al. 2009; Ørtenblad et al. 2011).
In the present study, mean subsarcolemmal glycogen concentrations show no differences between the five groups of fibres (see Fig.5C), and there was no obvious relation between tetanic [Ca2+]i and subsarcolemmal glycogen in individual fibres (see Fig.5F). This is in agreement with other studies reporting that subsarcolemmal glycogen is relatively less depleted during exercise than inter- and intramyofibrillar glycogen (Nielsen et al. 2011), and that subsarcolemmal glycogen content does not correlate with the SR Ca2+ release rate in isolated SR vesicles (Ørtenblad et al. 2011).
Differences in glycogen distribution between mouse and human muscle fibres?
The relative subcellular distribution of glycogen in the type II mouse FDB muscle fibres used in the present study is markedly different from human skeletal muscle type I and II fibres (Fig.6). Mouse FDB fibres have only ∼20% of the total glycogen content found in human muscle fibres, but still the intramyofibrillar glycogen is similar in the two. Based on the findings in the present and previous studies, intramyofibrillar glycogen may have a fundamental role in maintaining normal excitation–contraction coupling during intense muscle activities. This then implies that mouse fibres consume relatively more energy than human fibres to maintain excitation–contraction coupling. The exact nature of this difference was not addressed in the present study but candidates are the SR Ca2+ pumps and the Na+/K+ pumps.
Conclusion
Measurements of tetanic [Ca2+]i, force and subcellular glycogen content in individual mouse skeletal muscle fibres demonstrate a relationship between depletion of inter- and intramyofibrillar glycogen and decreased tetanic [Ca2+]i during fatiguing contractions. Interestingly, in fatigued fibres we observed the strongest correlation between decreased tetanic [Ca2+]i and reduced intramyofibrillar glycogen, which suggests that depletion of this pool is most closely associated with the decrease in tetanic [Ca2+]i. In fibres exposed to low-intensity stimulation, tetanic [Ca2+]i was decreased without clear signs of metabolic stress-induced effects on myofibrillar function, which suggests metabolic microenvironments. Mouse type II FDB fibres have a markedly larger relative content of intramyofibrillar glycogen than type I and II human fibres. This, together with previous results, indicates that the intramyofibrillar glycogen pool is fundamental for normal excitation–contraction coupling function.
Acknowledgments
We thank Karin Trampedach, Kirsten Hansen and Ursula Jungerman for technical assistance. The TEM was performed at the Department of Pathology, Odense University Hospital and at the Core Facility for Integrated Microscopy, Faculty of Health and Medical Sciences, University of Copenhagen.
Glossary
- Con
control
- HIF
high-intensity fatigue
- LIE
low-intensity equivalent
- LIE-N
low-intensity equivalent non-fatigued
- LIE-F
low-intensity equivalent fatigued
- LIF
low-intensity fatigue
- SR
sarcoplasmic reticulum
- T-tubular
transverse tubular
- TEM
transmission electron microscopy
Key points
Muscle glycogen (the storage form of glucose) is consumed during muscle work and the depletion of glycogen is thought to be a main contributor to muscle fatigue.
In this study, we used a novel approach to first measure fatigue-induced reductions in force and tetanic Ca2+ in isolated single mouse muscle fibres following repeated contractions and subsequently quantify the subcellular distribution of glycogen in the same fibre. Using this approach, we investigated whether the decreased tetanic Ca2+ induced by repeated contractions was associated with glycogen depletion in certain subcellular regions.
The results show a positive correlation between depletion of glycogen located within the myofibrils and low tetanic Ca2+ after repetitive stimulation.
We conclude that subcellular glycogen depletion has a central role in the decrease in tetanic Ca2+ that occurs during repetitive contractions.
Additional information
Competing interests
The authors declare that they have no competing interests.
Author contribution
All authors were involved in the study design. The force and [Ca2+]i measurements of single fibres were performed by A.J.C. TEM measurements were performed by J.N. All authors contributed to the analysis and interpretation of data. J.N. and A.J.C. drafted the manuscript and all authors were involved in revisions and have reviewed the final, submitted version.
Funding
This work was supported by funds from the Danish Ministry of Culture Committee on Sports Research, Augustinus Fonden, Swedish National Centre for Sports Research and the Swedish Research Council.
References
- Allen DG, Lamb GD. Westerblad H. Skeletal muscle fatigue: cellular mechanisms. Physiol Rev. 2008;88:287–332. doi: 10.1152/physrev.00015.2007. [DOI] [PubMed] [Google Scholar]
- Andrade FH, Reid MB, Allen DG. Westerblad H. Effect of hydrogen peroxide and dithiothreitol on contractile function of single skeletal muscle fibres from the mouse. J Physiol. 1998;509:565–575. doi: 10.1111/j.1469-7793.1998.565bn.x. [DOI] [PMC free article] [PubMed] [Google Scholar]
- Bruton JD, Dahlstedt AJ, Abbate F. Westerblad H. Mitochondrial function in intact skeletal muscle fibres of creatine kinase deficient mice. J Physiol. 2003;552:393–402. doi: 10.1113/jphysiol.2003.050732. [DOI] [PMC free article] [PubMed] [Google Scholar]
- Bruton JD, Cheng AJ. Westerblad H. Methods to detect Ca2+ in living cells. Adv Exp Med Biol. 2012;740:27–43. doi: 10.1007/978-94-007-2888-2_2. [DOI] [PubMed] [Google Scholar]
- Chin ER. Allen DG. Effects of reduced muscle glycogen concentration on force, Ca2+ release and contractile protein function in intact mouse skeletal muscle. J Physiol. 1997;498:17–29. doi: 10.1113/jphysiol.1997.sp021838. [DOI] [PMC free article] [PubMed] [Google Scholar]
- Dahlstedt AJ. Westerblad H. Inhibition of creatine kinase reduces the fatigue-induced decrease of tetanic [Ca2+]i in mouse skeletal muscle. J Physiol. 2001;533:639–649. doi: 10.1111/j.1469-7793.2001.00639.x. [DOI] [PMC free article] [PubMed] [Google Scholar]
- Dahlstedt AJ, Katz A, Wieringa B. Westerblad H. Is creatine kinase responsible for fatigue? Studies of isolated skeletal muscle deficient in creatine kinase. FASEB J. 2000;14:982–990. doi: 10.1096/fasebj.14.7.982. [DOI] [PubMed] [Google Scholar]
- Drummond GB. Reporting ethical matters in the Journal of Physiology: standards and advice. J Physiol. 2009;587:713–719. doi: 10.1113/jphysiol.2008.167387. [DOI] [PMC free article] [PubMed] [Google Scholar]
- Duhamel TA, Perco JG. Green HJ. Manipulation of dietary carbohydrates after prolonged effort modifies muscle sarcoplasmic reticulum responses in exercising males. Am J Physiol Regul Integr Comp Physiol. 2006;291:R1100–R1110. doi: 10.1152/ajpregu.00858.2005. [DOI] [PubMed] [Google Scholar]
- Dulhunty AF. Excitation-contraction coupling from 1950s into the new millennium. Clin Exp Pharmacol Physiol. 2006;33:763–772. doi: 10.1111/j.1440-1681.2006.04441.x. [DOI] [PubMed] [Google Scholar]
- Dutka TL. Lamb GD. Na+-K+ pumps in the transverse tubular system of skeletal muscle fibers preferentially use ATP from glycolysis. Am J Physiol Cell Physiol. 2007;293:C967–C977. doi: 10.1152/ajpcell.00132.2007. [DOI] [PubMed] [Google Scholar]
- Favero TG, Pessah IN. Klug GA. Prolonged exercise reduces Ca2+ release in rat skeletal muscle sarcoplasmic reticulum. Pflugers Arch. 1993;422:472–475. doi: 10.1007/BF00375074. [DOI] [PubMed] [Google Scholar]
- Fridén J, Seger J. Ekblom B. Topographical localization of muscle glycogen: an ultrahistochemical study in the human vastus lateralis. Acta Physiol Scand. 1989;135:381–391. doi: 10.1111/j.1748-1716.1989.tb08591.x. [DOI] [PubMed] [Google Scholar]
- Fryer MW, Owen VJ, Lamb GD. Stephenson DG. Effects of creatine phosphate and Pi on Ca2+ movements and tension development in rat skinned skeletal muscle fibres. J Physiol. 1995;482:123–140. doi: 10.1113/jphysiol.1995.sp020504. [DOI] [PMC free article] [PubMed] [Google Scholar]
- Gejl K, Hvid LG, Frandsen U, Jensen K, Sahlin K. Ørtenblad N. Muscle glycogen content modifies SR Ca2+ release rate in elite endurance athletes. Med Sci Sports Exerc. 2014;46:496–505. doi: 10.1249/MSS.0000000000000132. [DOI] [PubMed] [Google Scholar]
- Gordon AM, Homsher E. Regnier M. Regulation of contraction in striated muscle. Physiol Rev. 2000;80:853–924. doi: 10.1152/physrev.2000.80.2.853. [DOI] [PubMed] [Google Scholar]
- Gundersen HJ, Bendtsen TF, Korbo L, Marcussen N, Møller A, Nielsen K, Nyengaard JR, Pakkenberg B, Sørensen FB, Vesterby A. West MJ. Some new, simple and efficient stereological methods and their use in pathological research and diagnosis. APMIS. 1988;96:379–394. doi: 10.1111/j.1699-0463.1988.tb05320.x. [DOI] [PubMed] [Google Scholar]
- Helander I, Westerblad H. Katz A. Effects of glucose on contractile function, [Ca2+]i, and glycogen in isolated mouse skeletal muscle. Am J Physiol Cell Physiol. 2002;282:C1306–C1312. doi: 10.1152/ajpcell.00490.2001. [DOI] [PubMed] [Google Scholar]
- Hermansen L, Hultman E. Saltin B. Muscle glycogen during prolonged severe exercise. Acta Physiol Scand. 1967;71:129–139. doi: 10.1111/j.1748-1716.1967.tb03719.x. [DOI] [PubMed] [Google Scholar]
- Howard CV. Reed MG. Unbiased Stereology. Three-dimensional Measurement in Microscopy. Oxford: Bios Scientific Publishers; 2005. [Google Scholar]
- James JH, Wagner KR, King J-K, Leffler RE, Upputuri RK, Balasubramanian A, Friend LA, Shelly DA, Paul RJ. Fischer JE. Stimulation of both aerobic glycolysis and Na+-K+-ATPase activity in skeletal muscle by epinephrine or amylin. Am J Physiol Endocrinol Metab. 1999;277:E176–E186. doi: 10.1152/ajpendo.1999.277.1.E176. [DOI] [PubMed] [Google Scholar]
- Kabbara AA, Nguyen LT, Stephenson GM. Allen DG. Intracellular calcium during fatigue of cane toad skeletal muscle in the absence of glucose. J Muscle Res Cell Motil. 2000;21:481–489. doi: 10.1023/a:1005650425513. [DOI] [PubMed] [Google Scholar]
- Karlsson J, Nordsjö L-O. Saltin B. Muscle glycogen utilization during exercise after physical training. Acta Physiol Scand. 1974;90:210–217. doi: 10.1111/j.1748-1716.1974.tb05579.x. [DOI] [PubMed] [Google Scholar]
- Marchand I, Chorneyko K, Tarnopolsky M, Hamilton S, Shearer J, Potvin J. Graham TE. Quantification of subcellular glycogen in resting human muscle: granule size, number, and location. J Appl Physiol. 2002;93:1598–1607. doi: 10.1152/japplphysiol.00585.2001. [DOI] [PubMed] [Google Scholar]
- Melendez-Hevia E, Waddell TG. Shelton ED. Optimization of molecular design in the evolution of metabolism: the glycogen molecule. Biochem J. 1993;295:477–483. doi: 10.1042/bj2950477. [DOI] [PMC free article] [PubMed] [Google Scholar]
- Nielsen J. Ørtenblad N. Physiological aspects of the subcellular localization of glycogen in skeletal muscle. Appl Physiol Nutr Metab. 2013;38:91–99. doi: 10.1139/apnm-2012-0184. [DOI] [PubMed] [Google Scholar]
- Nielsen J, Schrøder HD, Rix CG. Ørtenblad N. Distinct effects of subcellular glycogen localization on tetanic relaxation time and endurance in mechanically skinned rat skeletal muscle fibres. J Physiol. 2009;587:3679–3690. doi: 10.1113/jphysiol.2009.174862. [DOI] [PMC free article] [PubMed] [Google Scholar]
- Nielsen J, Holmberg HC, Schrøder HD, Saltin B. Ørtenblad N. Human skeletal muscle glycogen utilization in exhaustive exercise: role of subcellular localization and fibre type. J Physiol. 2011;589:2871–2885. doi: 10.1113/jphysiol.2010.204487. [DOI] [PMC free article] [PubMed] [Google Scholar]
- Ørtenblad N, Nielsen J, Saltin B. Holmberg HC. Role of glycogen availability on sarcoplasmic reticulum Ca2+ kinetics in human skeletal muscle. J Physiol. 2011;589:711–725. doi: 10.1113/jphysiol.2010.195982. [DOI] [PMC free article] [PubMed] [Google Scholar]
- Ørtenblad N, Westerblad H. Nielsen N. Muscle glycogen stores and fatigue. J Physiol. 2013;591:4405–4413. doi: 10.1113/jphysiol.2013.251629. [DOI] [PMC free article] [PubMed] [Google Scholar]
- Weibel ER. Stereological Methods. Vol. 2: Theoretical Foundations. London: Academic Press; 1980. [Google Scholar]
- Westerblad H. Allen DG. Changes of myoplasmic calcium concentration during fatigue in single mouse muscle fibers. J Gen Physiol. 1991;98:615–635. doi: 10.1085/jgp.98.3.615. [DOI] [PMC free article] [PubMed] [Google Scholar]