

Abstract
Experimental 13C kinetic isotope effects have been used to interrogate the rate-limiting step of the Michael addition of glycinate imines to benzyl acrylate catalyzed by a chiral 2,3-bis(dicyclohexylamino) cyclopropenimine catalyst. The reaction is found to proceed via rate-limiting carbon–carbon bond formation. The origins of enantioselectivity and a key noncovalent CH···O interaction responsible for transition state organization are identified on the basis of density functional theory calculations and probed using experimental labeling studies. The resulting high-resolution experimental picture of the enantioselectivity-determining transition state is expected to guide new catalyst design and reaction development.
Introduction
Chiral cyclopropenimines developed in one of our laboratories are emerging as a powerful class of enantioselective Brønsted base catalysts.1−3 The prototypical reaction of glycine imine 2 and methyl acrylate 3a catalyzed by 2,3-bis(dicyclohexylamino) cyclopropenimine 1 gives the Michael adduct 4a in 99% yield with 98% ee. The rate of this transformation is approximately 2–3 orders of magnitude faster than that achieved with an analogous guanidine-based catalyst.4 This example of the superior performance of cyclopropenimines hints at the tremendous potential of this new class of Brønsted base catalysts.5
Scheme 1. Chiral Brønsted Base-Catalyzed Michael Addition of Glycine Imine to Acrylates.

An in-depth understanding of this catalyst system would be invaluable to our efforts to pursue new methodological applications and further catalyst development studies. With this goal in mind, we undertook a mechanistic study of the title reaction using experimental 13C kinetic isotope effects (KIEs) and density functional theory (DFT) calculations. 13C KIEs are uniquely sensitive probes of the rate-limiting transition state geometry of a reaction and have been successfully used to probe the mechanism of several fundamental organic reactions.6 Herein we report identification of the rate-limiting step, elucidation of stabilizing transition state interactions, and the origin of enantioselectivity of this novel organocatalytic reaction.
Results and Discussion
Determination of Experimental KIEs
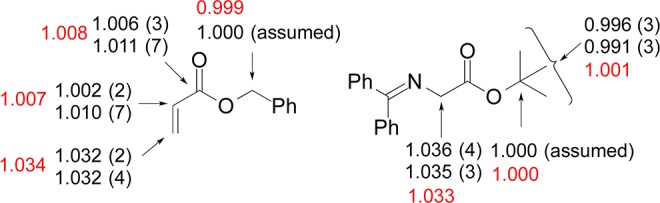
We chose the reaction of the glycine imine 2 and benzyl acrylate 3b catalyzed by 1 for the measurement of 13C KIEs using NMR methodology at natural abundance.7 Complementary approaches were used for the determination of 13C KIEs for the two reaction components 2 and 3b. The KIEs for 2 were determined by analysis of product samples.8 Thus, the isotopic composition of 4b was measured from two independent experiments taken to 21 ± 2% and 22 ± 2% conversion in 2 and compared to samples of 4b isolated from reactions taken to 100% conversion. The KIEs for 3b were determined by analysis of recovered starting material:9 samples of 3b were reisolated from two independent experiments taken to 72 ± 2% and 74 ± 2% conversion (with respect to 3b) and were compared to samples of unreacted 3b. The experimental KIEs calculated from the change in 13C isotopic composition and the fractional conversion are shown in Figure 1.10
Figure 1.
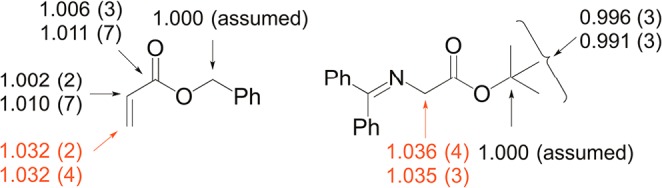
Experimental 13C KIEs for reaction of 2 and 3b catalyzed by 1. The two sets of KIEs for each carbon represent two independent experiments and the numbers in parentheses represent the standard deviation in the last digit as determined from six measurements. KIEs for the bond-forming carbon atoms are shown in red.
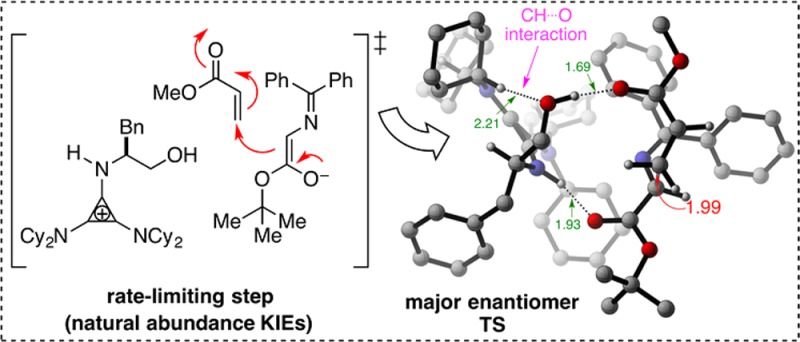
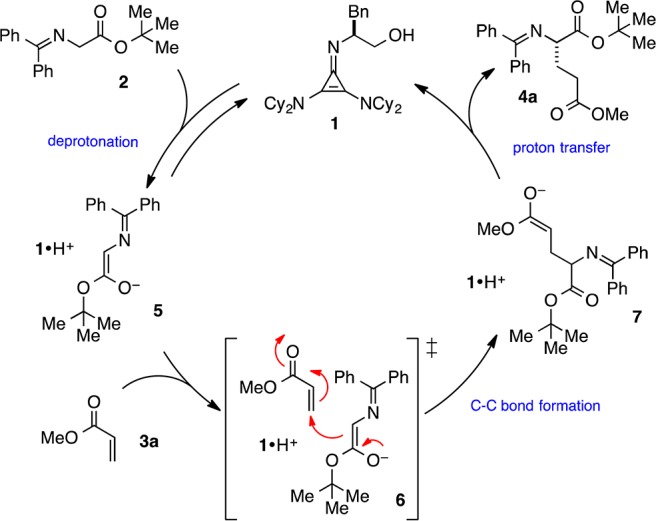
The experimental 13C KIEs provide qualitative information about the rate-limiting step in a catalytic cycle. In our initial publication,1 we proposed a mechanism for this reaction that involves initial deprotonation of 2 by 1 to generate H-bonded cyclopropenium ion-enolate complex 5 (Scheme 2). Subsequent Michael addition of 5 to 3 affords adduct 7 via transition state 6. Finally, proton transfer from the cyclopropenium ion to the Michael adduct results in release of 4 and regeneration of 1. Substantial 13C KIEs for the two bond-forming carbon atoms (shown in red in Figure 1) suggest carbon–carbon bond formation to be the rate-limiting step in the catalytic cycle. All other KIEs are close to unity, consistent with minor rehybridization occurring at this isotope-sensitive step.
Scheme 2. Proposed Mechanism Based on Experimental KIEs.
Theoretical Studies
We next sought to gain detailed insight into the organization of this enantioselectivity-determining carbon–carbon bond-forming transition state through theoretical studies. Preliminary results reported in our initial publication1 suggest a key role of the dicyclohexylamino substituents in mediating reaction efficiency and enantioselectivity, while the NH proton and the pendant hydroxyl group in catalyst 1 are vital elements in assembling this transition state via multiple H-bonding interactions. A comprehensive theoretical study of this reaction is complicated by a number of factors, namely, (1) the size of the system—the cyclopropenimine-catalyzed reaction of 2 and 3a involves 150 atoms, (2) the possibility of several conformations for the catalyst, (3) the possibility of either E or Z geometry of the intermediate enolate 5 and of s-cis or s-trans geometry of the acrylate 3a, and (4) several competing H-bonding scenarios in the assembly of the transition state.
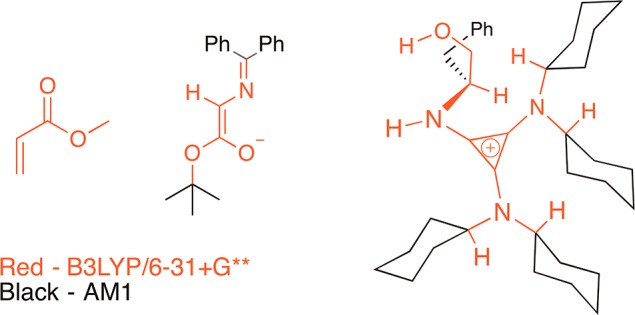
A detailed investigation of the catalyst geometry revealed a preference for a conformation wherein the cyclohexyl rings are geared in the same direction and the hydrogen atom at the chiral center is oriented anti to the NH proton (the H–C–N–H dihedral angle is −146°; B3LYP/6-31+G**).11 The next step in the study was the identification of carbon–carbon bond forming transition structures leading to the major and minor enantiomers of product 4a and the theoretical prediction of enantioselectivity. Owing to the large size of the system, initial explorations of transition structures were performed using the hybrid ONIOM12 (B3LYP/6-31+G**:AM1) method as implemented in Gaussian 09.13 The ONIOM method treats the key bond-forming and H-bonding portions of the transition state using the high-level DFT method (B3LYP/6-31+G**) and the steric bulk of the catalyst and reactants using the semiempirical method (AM1). The division of layers for the ONIOM calculations is shown in Figure 2. The time efficiency of the ONIOM method allowed us to explore a range of transition structures, including those involving higher energy catalyst conformations, those involving different H-bonding scenarios, and those lacking multiple H-bonding interactions. The summary of the results from the ONIOM study is presented in the Supporting Information.
Figure 2.
Division of layers for the ONIOM method used for initial exploration of transition structures.
The exploratory ONIOM study led to the identification of a subset of viable transition structures arising from four distinct binding modes (5a–d, Figure 3) of the catalyst–enolate complex 5. A simple template that can be used to describe these “most likely” transition state assemblies is shown in Figure 3. After initial deprotonation of 2 by 1, the resulting catalyst-bound enolate 5 can adopt either the E or Z geometry. In monocoordinated binding mode 5a, the enolate is held by a single H-bonding interaction between the hydroxyl group on the catalyst and the enolate oxygen. The NH moiety of protonated 1 presumably directs 3a for conjugate attack by H-bonding to the oxygen atom of 3a at the transition state. Four possible orientations of binding mode 5a that allow for this combination of H-bonding interactions are shown in Figure 3. They are labeled 5aRE, 5aRZ, 5aSE, and 5aSZ based on the binding mode 5a, the enantiomer of product formed (R or S), and the enolate geometry (E or Z). A similar (and complementary) situation arises when the enolate oxygen is H-bonded to the NH moiety of catalyst 1—binding mode 5b. In this monocoordinated binding mode, the enolate can once again adopt either a E or Z conformation and the hydroxyl group directs 3a for conjugate attack via H-bonding to the oxygen atom. Four additional conformations, 5bRE, 5bRZ, 5bSE, and 5bSZ, can be envisioned from binding mode 5b.
Figure 3.

Possible binding modes of the catalyst–enolate complex 5.
In binding modes 5c and 5d, the enolate is bound to the catalyst via two H-bonding interactions: between the oxygen and nitrogen acceptor atoms (of the enolate) and the two H-bond donors in the protonated catalyst. Two important features distinguish these dicoordinated binding modes from the monocoordinated counterparts: (1) the enolate is forced to adopt only the E conformation to accommodate the two H-bonding interactions, and (2) in the transition structures for conjugate attack based on binding modes 5c and 5d, the oxygen atom of 3a is not involved in H-bonding with the catalyst. For obvious reasons, transition structures wherein neither the NH nor the OH moiety of 1 is involved in H-bonding were not considered in detail.
Transition structures based on the 12 distinct binding modes of 5 were recalculated using the B3LYP/6-31G* method.14 The DFT treatment of the whole system is expected to yield a better description of the energetics of noncovalent interactions (such as CH-π interactions) compared to the ONIOM calculations.15 All reported distances are in angstroms, and all reported energies are E+zpe energy from the B3LYP/6-31G* calculations. Frequency calculations performed on these transition structures revealed one imaginary frequency corresponding to carbon–carbon bond formation.
Shown in Figure 4 (S transition structures) and Figure 5 (R transition structures) are the eight transition structures corresponding to the eight geometries shown in Figure 3 for monocoordinated binding modes 5a and 5b. Two features are common to all eight transition structures namely (1) strong H-bonding interactions between both reactants (2 and 3a) and the two H-bond donors in the catalyst, and (2) an s-cis conformation of 3a.16 The lowest energy transition structures leading to each enantiomer, TS5bSE (Erel = 0.0 kcal/mol, Figure 4) and TS5aRZ (Erel = 1.7 kcal/mol, Figure 5), are highlighted using green and red boxes, respectively. This energy difference (1.7 kcal/mol) corresponds to a predicted 89% ee. Consideration of a contributing second transition structure leading to the major enantiomer (TS5aSE, Erel = 0.9 kcal/mol; which is still lower in energy than TS5aRZ by 0.8 kcal/mol) gives an altered prediction of 92% ee. This is in good agreement with the experimental 98% ee.17
Figure 4.

Transition structures leading to major (S) enantiomer of product 4a that utilize monocoordinated binding modes 5a and 5b. Most hydrogen atoms have been removed for clarity. All transition structures are oriented with the acrylate in the foreground and the enolate in the background.
Figure 5.

Transition structures leading to minor (R) enantiomer of product 4a that utilize monocoordinated binding modes 5a and 5b. Most hydrogen atoms have been removed for clarity. All transition structures are oriented with the acrylate in the foreground and the enolate in the background.
The exact origin of the favorability of TS5bSE over TS5aRZ is probably attributable to a complex interplay of several stabilizing/destabilizing interactions. A detailed examination of some of these stabilizing interactions will be discussed in a later section. Finally, all transition structures resulting from the dicoordinated binding modes 5c and 5d (Supporting Information) were found to be over 12 kcal/mol (at least) higher in energy than TS5bSE, illustrating the importance of H-bonding between the catalyst and both reacting partners at the transition state.
Six of the eight transition structures in Figures 4 and 5 are within 5 kcal/mol of the lowest energy transition structure TS5bSE. Interestingly, the two transition structures that are significantly higher in energy, TS5bSZ (Erel = 11.5 kcal/mol) and TS5bRE (Erel = 10.4 kcal/mol), are almost identical except with respect to the geometry of the enolate. In our attempt to understand this result, we took a closer look at the key difference between these two transition structures and the six lower energy transition structures. All transition structures in Figures 4 and 5 have similar carbon–carbon bond forming distances (2.0–2.2 Å), and are stabilized by the two short H-bonding interactions (NH···O and OH···O in the range of 1.7–1.9 Å) discussed earlier. An additional (and rather unusual) CH···O interaction, in the range of 2.1–2.3 Å between the cyclohexyl–CH and the hydroxyl oxygen atom, appears to be contributing to transition state stabilization of the six lower energy transition structures in Figures 4 and 5. Intriguingly, this CH···O distance is significantly larger in the two high-energy transition structures TS5bRE (3.39 Å, Figure 5) and TS5bSZ (3.52 Å, Figure 4). This finding suggests that the contribution of the CH···O interaction to transition state stabilization is, crudely, around 5 kcal/mol. This is based on the observation that there is no obvious deleterious interaction (apart from the elongated CH···O distance) in these two transition structures that is not present in one of the six transition structures that are within 5 kcal/mol of the lowest energy transition structure. A more detailed evaluation of this interaction will be presented in a later section.
Predicted KIEs
To interpret the experimental KIE results described above, 13C KIEs were computed from the scaled vibrational frequencies of the two lowest energy transition structures leading to the major enantiomer (TS5bSE and TS5aSE, as a weighted average based on their energies) using the program ISOEFF98.18,19 A one-dimensional tunneling correction20 was applied to the predicted 13C KIEs. The predicted KIEs, along with the experimental values obtained for each carbon atom, are shown in Figure 6. The excellent agreement of experiment and theory validates the transition state model and supports carbon–carbon bond formation to be the rate-limiting step of the reaction.
Figure 6.
Comparison of experimental (black) and predicted (red) 13C KIEs.
On the Origin of Enantioselectivity
To obtain a qualitative breakdown of the energy difference between the key transition structures contributing to the formation of either enantiomer of product, an analysis of H-bonding and other stabilizing interactions was performed (Table 1). Also listed is the carbon–carbon bond-forming distance of each transition structure. The strength of an H-bonding interaction depends on both the H-bonding distance and the donor–hydrogen-acceptor angle, a linear arrangement of the three atoms forming the angle results in the strongest H-bonding interaction.21 Each H-bonding distance is listed in Table 1 along with the donor–hydrogen–acceptor angle. Finally, the structures have been analyzed for stabilizing CH-π interactions, the criterion being that the relevant hydrogen is appropriately oriented with respect to the π system and that the distance between the hydrogen and the closest aromatic carbon atom is < 3.0 Å.
Table 1. Analysis of Stabilizing Interactions for TS5bSE, TS5aSE, and TS5aRZ.
| TS5bSE | TS5aSE | TS5aRZ | |
|---|---|---|---|
| 1. C–C distance | 1.99 Å | 2.20 Å | 2.22 Å |
| 2. enolate bound to | +NH (1.93 Å) | OH (1.78 Å) | OH (1.73 Å) |
| ∠NHO = 154° | ∠NHO = 159° | ∠OHO = 171° | |
| 3. acrylate bound to | OH (1.69 Å) | +NH (1.82 Å) | +NH (1.83 Å) |
| ∠OHO = 173° | ∠OHO = 158° | ∠NHO = 162° | |
| 4. Cy–CH···O distance | 2.21 Å | 2.16 Å | 2.15 Å |
| ∠CHO = 171° | ∠CHO = 163° | ∠CHO = 168° | |
| 5. CH-π interactions | 1 | 2 | 0 |
The two main features that distinguish TS5bSE from the other two structures are (1) the shorter C–C bond distance (1.99 Å) and (2) a stronger interaction between the acrylate oxygen atom and the H-bond donor atom (1.69 Å and ∠OHO = 173.2°). Since C–C bond formation is more advanced in TS5bSE, there is a greater buildup of negative charge at the acrylate oxygen atom resulting in the stronger H-bonding interaction. Favorable CH-π interactions were also identified in both TS5bSE and TS5aSE that were absent in TS5aRZ (see Supporting Information for pdbs of these structures).
A full understanding of the exact origin of enantioselection in this system is complicated by the accessibility of both E and Z enolates and the possibility of multiple binding modes for the catalyst–enolate complex 5 (Figure 3). In contrast to the vast majority of asymmetric transformations, enantioselectivity in this reaction is not a result of selective access of one face versus the other of a single complex; rather it appears to result from the best network of H-bonding interactions, geometry of the enolate, and other stabilizing interactions. The observation that the major enantiomer (S) is formed from two very geometrically distinct transition structures, TS5bSE (∼83%) and TS5aSE (∼17%), suggests that the prediction of enantioselectivity for other reactions catalyzed by 1 (or even the same reaction with a different Michael acceptor) will require a full consideration of all possible transition state assemblies. The main contribution of this work is the development of a template (Figure 3) that provides a systematic basis for the prediction of enantioselectivity in reactions catalyzed by 1. We are currently adopting this template for the optimization of reactions that are in the early stages of development.
Analysis of the CH···O Interaction
We next turned our attention to understanding why the Cy-CH···O distance is elongated in the two high energy transition structures TS5bRE and TS5bSZ. Among all the binding modes shown in Figure 3, the bond-forming enolate carbon atom is the farthest away from the pendant hydroxyl group in binding modes 5bRE and 5bSZ. As a result, the hydroxyl group has to adopt a conformation that is different (from the six other lower energy transition structures in Figures 4 and 5) in order to stabilize the oxygen atom of 3a via H-bonding at the transition state. This different conformation of the hydroxyl group does not allow close proximity between the Cy–CH and the hydroxyl oxygen. In other words, maintaining the CH···O interaction appears to be less important than stabilization (via H-bonding) of the developing negative charge of the oxygen atom of 3a in these transition structures. This observation is further supported by the energies of the transition structures resulting from binding modes 5c and 5d, even though all four transition structures TS5cRE, TS5cSE, TS5dRE, and TS5dSE had Cy-CH···O distances between 2.1 and 2.4 Å (not shown, see Supporting Information), they were found to be 12.0, 13.2, 19.5, and 16.5 kcal/mol (respectively) higher in energy than TS5bSE due to lack of transition state stabilization of the acrylate oxygen atom.
While the contribution of the CH···O interaction to transition state stabilization is significant, its role in determining enantioselectivity is expected to be minimal since bothTS5bSE and TS5aRZ benefit from the stabilization afforded by this interaction. Nevertheless, we envisioned that slight perturbation of enantioselectivity could be used as an experimental probe of this interaction–since the CH···O distance is slightly different in the key transition structures. With this in mind, we synthesized the deuterated version of the catalyst 1a with all four Cy–CHs substituted by deuterium. To observe even a small KIE on the enantioselectivity, a catalyst mixture of 50% (S)-d4-1 and 50% (R)-1 was employed for the addition of glycine imine 2 to 3a (Figure 7). A KIE would be manifested in the reaction in the form of a nonracemic product. The product from this reaction was essentially racemic (<5% ee), however, indicating a KIE of ∼1.0. The lack of an observed KIE does not undermine the importance of a transition state CH···O interaction. Indeed, because the relevant hydrogen is not participating in any bond-forming or bond-breaking events, and because both the major and minor enantiomer transition states likely benefit from this interaction to similar extents, it is not unreasonable that any KIE would be too small to measure.22
Figure 7.

Labeling studies as an experimental probe of CH···O interaction.
Finally, examination of this interaction in the crystal structure (∼2.51 Å)3 and computed structures (2.35 Å, B3LYP/6-31G*) of the protonated catalyst revealed that it is present, albeit to a lesser extent, in the ground state. The discrepancy in these numbers suggests that our calculations might be slightly overestimating this interaction.23 However, the compression of this distance on going from the protonated catalyst to the transition state, (by 0.15–0.2 Å) suggests that the role of this interaction in the transition state stabilization is nontrivial. We recognize that gas phase B3LYP/6-31G* calculations might be inadequate in accurately describing the energetic contribution of this interaction but we expect higher-level calculations to exhibit similar trends on going from the ground state to the transition state. The preliminary investigations using ONIOM methods, where this interaction was calculated using a 6-31+G** basis set, showed similar trends in the CH···O distance at the transition state (2.10–2.3 Å, see Supporting Information for complete details and analyses of these calculations).
Conclusions
Experimental 13C KIEs and theoretical studies provide a high-resolution picture of the enantioselectivity-determining transition state of the Michael addition of glycinate imines to acrylate catalyzed by a chiral 2,3- bis(dicyclohexylamino) cyclopropenimine catalyst. On the basis of these studies, we have developed a template for predicting enantioselectivity in reactions catalyzed by 1. An unusual intramolecular CH···O interaction has been identified as a key element in transition state organization. Transition structures where H-bond donors on the catalyst stabilize both reactants via H-bonding are favored. Ultimately, enantioselection results from the best network of H-bonding interactions, geometry of the enolate, and other stabilizing interactions. The use of this information for the rational design of novel cyclopropenimine-based Brønsted base catalysts will be reported in due course.
Acknowledgments
M.J.V. acknowledges support from startup funding at Binghamton University from the SUNY Research Foundation and the National Science Foundation through XSEDE resources provided by the XSEDE Science Gateways program. T.H.L. acknowledges financial support from NIH NIGMS (R01 GM102611) and an Ely Lilly Grantee Award. W.D.W. acknowledges support from NIH NIGMS (R01 GM094478). J.S.B. is grateful for NSF and NDSEG doctoral fellowships. We thank the Leighton group (Columbia University) for use of their instrumentation.
Supporting Information Available
Experimental and computational details and discussions, NMR spectra and integrations, relevant pdb files, absolute energies, and the coordinates of the atoms in all the molecules whose geometries were optimized. This material is available free of charge via the Internet at http://pubs.acs.org.
Author Contributions
# J.S.B. and G.S.S. contributed equally to this work.
The authors declare no competing financial interest.
Funding Statement
National Institutes of Health, United States
Supplementary Material
References
- Bandar J.; Lambert T. H. J. Am. Chem. Soc. 2012, 134, 5552–5555. [DOI] [PubMed] [Google Scholar]
- Bandar J. S.; Lambert T. H. J. Am. Chem. Soc. 2013, 135, 11799–11802. [DOI] [PMC free article] [PubMed] [Google Scholar]
- Bandar J. S.; Mazori A. Y.; Lambert T. H. Manuscript in preparation.
- Ishikawa T.; Araki Y.; Kumamoto T.; Seki H.; Fukuda K.; Isobe T. Chem. Commun. 2001, 245. [Google Scholar]
- Several catalytic enantioselective Brønsted base catalyzed reactions are currently being developed using 1 and related catalysts. 1 is available as a salt from Sigma-Aldrich.
- Selected examples include; a Beno B. R.; Houk K. N.; Singleton D. A. J. Am. Chem. Soc. 1996, 118, 9984–9985. [Google Scholar]; b Singleton D. A.; Merrigan S. R.; Liu J.; Houk K. N. J. Am. Chem. Soc. 1997, 119, 3385–3386. [Google Scholar]; c DelMonte A. J.; Haller J.; Houk K. N.; Sharpless K. B.; Singleton D. A.; Strassner T.; Thomas A. A. J. Am. Chem. Soc. 1997, 119, 9907–9908. [Google Scholar]; d Keating A. E.; Merrigan S. R.; Singleton D. A.; Houk K. N. J. Am. Chem. Soc. 1999, 121, 3933–3938. [Google Scholar]; e Frantz D. E.; Singleton D. A. J. Am. Chem. Soc. 2000, 122, 3288–3295. [Google Scholar]; f Zhu H.; Clemente F. R.; Houk K. N.; Meyer M. P. J. Am. Chem. Soc. 2009, 131, 1632–1633. [DOI] [PMC free article] [PubMed] [Google Scholar]; g Vetticatt M. J.; Desai A. A.; Wulff W. D. J. Org. Chem. 2013, 78, 5142–5152. [DOI] [PMC free article] [PubMed] [Google Scholar]
- Singleton D. A.; Thomas A. A. J. Am. Chem. Soc. 1995, 117, 9357–9358. [Google Scholar]
- a Frantz D. E.; Singleton D. A.; Snyder J. P. J. Am. Chem. Soc. 1997, 119, 3385–3386. [Google Scholar]; b Singleton D. A.; Schulmeier B. E. J. Am. Chem. Soc. 1999, 121, 9313–9317. [Google Scholar]
- We chose this approach because reisolation of 3b from the product mixture could be accomplished relatively easily unlike 2, which is prone to hydrolysis during chromatography.
- Full experimental details of the KIE measurements are provided in the Supporting Information.
- This computed geometry of the protonated catalyst is consistent with the crystal structure of the protonated catalyst complexed to a chloride ion and a water molecule. See ref (1) for published crystal structure.
- a Svensson M.; Humbel S.; Morokuma K. J. Chem. Phys. 1996, 105, 3654–3661. [Google Scholar]; b Vreven T.; Morokuma K. J. Comput. Chem. 2000, 21, 1419–1432. [Google Scholar]; c Dapprich S.; Komáromi I.; Byun K. S.; Morokuma K.; Frisch M. J. J. Mol. Struct. 1999, 461, 1–21. [Google Scholar]
- Frisch M. J.; Trucks G. W.; Schlegel H. B.; Scuseria G. E.; Robb M. A.; Cheeseman J. R.; Scalmani G.; Barone V.; Mennucci B.; Petersson G. A.; Nakatsuji H.; Caricato M.; Li X.; Hratchian H. P.; Izmaylov A. F.; Bloino J.; Zheng G.; Sonnenberg J. L.; Hada M.; Ehara M.; Toyota K.; Fukuda R.; Hasegawa J.; Ishida M.; Nakajima T.; Honda Y.; Kitao O.; Nakai H.; Vreven T.; Montgomery J. A. Jr.; Peralta J. E.; Ogliaro F.; Bearpark M.; Heyd J. J.; Brothers E.; Kudin K. N.; Staroverov V. N.; Kobayashi R.; Normand J.; Raghavachari K.; Rendell A.; Burant J. C.; Iyengar S. S.; Tomasi J.; Cossi M.; Rega N.; Millam N. J.; Klene M.; Knox J. E.; Cross J. B.; Bakken V.; Adamo C.; Jaramillo J.; Gomperts R.; Stratmann R. E.; Yazyev O.; Austin A. J.; Cammi R.; Pomelli C.; Ochterski J. W.; Martin R. L.; Morokuma K.; Zakrzewski V. G.; Voth G. A.; Salvador P.; Dannenberg J. J.; Dapprich S.; Daniels A. D.; Farkas Ö.; Foresman J. B.; Ortiz J. V.; Cioslowski J.; Fox D. J.. Gaussian 09, revision A1; Gaussian, Inc.: Wallingford CT, 2009. [Google Scholar]
- Becke A. D. J. Chem. Phys. 1993, 98, 5648–5652. [Google Scholar]
- Usually, detailed computational investigations of such large systems are carried out using hybrid(DFT:semiempirical) methods such as ONIOM followed by single-point energy calculations to obtain the best-possible energy. These methods are significantly more error-prone than a full-DFT treatment.
- This observation has been validated experimentally. 2-Cyclopentenone (s-trans) is found to be a poor Michael acceptor while 2-methylenecyclopentanone (s-cis) is an excellent acceptor.
- To confirm that the trend in the relative energies, of transition structures discussed in the manuscript, is not an artifact of the method used, we computed TS5bSE, TS5aSE, TS5aRE, and TS5aRZ using mPW1K/6-31G* calculations followed by single-point energy calculations using mPW1K/6-31+G**. Additionally, we performed full transition state optimizations using B3LYP/6-31G* PCM (ethyl acetate) calculations and B3LYP/gen calculations (with the “high layer” of the ONIOM scheme (Figure 2) computed using B3LYP/6-31+G** and the “low layer” using B3LYP/6-31G*) for these four transition structures. All these calculations revealed similar energy trends to those reported in the manuscript, with TS5bSE being the lowest energy transition structure in all methods employed. See Supporting Information for full details of these calculations. We chose B3LYP/6-31G* because the energies were in closest agreement to experimental enantioselectivity, and because we had performed an exhaustive exploration of transition state assemblies using this method.
- Anisimov V.; Paneth P. J. Math. Chem. 1999, 26, 75. [Google Scholar]
- Frequencies were scaled by 0.9614.Scott A. P.; Radom L. J. Phys. Chem. 1996, 100, 16502. [Google Scholar]
- Bell R. P.The Tunnel Effect in Chemistry; Chapman & Hall: London, 1980. [Google Scholar]
- Taylor M. S.; Jacobsen E. N. Angew. Chem., Int. Ed. 2006, 45, 1520–1543. [DOI] [PubMed] [Google Scholar]
- See Supporting Information for a detailed interpretation of this KIE.
- For the protonated catalyst calculations, the addition of a PCM solvent model for ethyl acetate to the B3LYP/6-31G* calculations increased the CH···O distance to 2.43 Å. Adding polarization and diffuse functions (6-31+G**, gas phase) further increased this distance to 2.46 Å. These values are more in line with the crystal structure; however, employing a PCM model with a higher basis set is prohibitive for transition state calculations.
Associated Data
This section collects any data citations, data availability statements, or supplementary materials included in this article.