

Abstract
Magnetic resonance (MR) technology offers noninvasive methods for in vivo assessment of neuroabnormalities. A comprehensive neuropsychological/behavioral, MR imaging (MRI), MR spectroscopy (MRS) and functional MRI (fMRI) assessment was administered to children with fetal alcohol spectrum disorders (FASD) to determine whether global and/or focal abnormalities could be identified and to distinguish diagnostic subclassifications across the spectrum. The four study groups included (1) FAS/partial FAS; (2) static encephalopathy/alcohol exposed (SE/AE); (3) neurobehavioral disorder/alcohol exposed (ND/AE) as diagnosed with the FASD 4-Digit Code; and (4) healthy peers with no prenatal alcohol exposure. Results are presented in four separate reports: MRS (reported here) and neuropsychological/behavioral, MRI and fMRI outcomes (reported separately). MRS was used to compare neurometabolite concentrations [choline (Cho), n-acetyl-aspartate (NAA) and creatine (Cre)] in a white matter region and a hippocampal region between the four study groups. Choline concentration in the frontal/parietal white matter region, lateral to the midsection of the corpus callosum, was significantly lower in FAS/PFAS relative to all other study groups. Choline decreased significantly with decreasing frontal white matter volume and corpus callosum length. These outcomes suggest low choline concentrations may reflect white matter deficits among FAS/PFAS. Choline also decreased significantly with increasing severity of the 4-Digit FAS facial phenotype, increasing impairment in psychological performance and increasing alcohol exposure. NAA and Cre concentrations did not vary significantly. This study provides further evidence of the vulnerability of the cholinergic system in FASD.
Keywords: Fetal alcohol spectrum disorder (FASD), Magnetic resonance spectroscopy (MRS), FASD 4-Digit Diagnostic Code, Choline, n-Acetyl-aspartate, Creatine
1. Introduction
Fetal alcohol syndrome (FAS) is a permanent birth defect syndrome caused by maternal alcohol consumption during pregnancy. FAS is defined by growth deficiency, a unique cluster of minor facial anomalies and central nervous system (CNS) dysfunction and/or structural brain abnormalities [1]. The cognitive/behavioral problems in this condition stem from prenatal brain damage. Not all individuals with prenatal alcohol exposure present with measurable CNS dysfunction or structural brain abnormalities, and not all who present with measurable CNS dysfunction or structural brain abnormalities have FAS. Recently, the term fetal alcohol spectrum disorders (FASD) was coined to depict the spectrum of outcomes observed among individuals with prenatal alcohol exposure. FASD is not a medical diagnosis. Rather, medical diagnoses/conditions like FAS, Partial FAS, Static Encephalopathy/Alcohol Exposed and Neurobehavioral Disorder/Alcohol Exposed fall under the umbrella of FASD. The degree of brain damage among individuals with prenatal alcohol exposure may vary from microcellular and neurochemical aberrations to gross structural anomalies. Similarly, cognitive/behavioral dysfunction varies along the full continuum from mild developmental delay or learning disabilities to global developmental disability. The specificity of the FAS facial phenotype to prenatal alcohol exposure lends credence to the clinical judgment that the cognitive and behavioral dysfunction observed in individuals with FAS is due, at least in part, to brain damage caused by a teratogen [2–4]. Unfortunately, without the unique facial phenotype of FAS or at least a severe or clinically obvious expression of brain damage, the neurodevelopmental disabilities of an individual affected by prenatal alcohol exposure often go unrecognized and inappropriately served [5].
Many individuals with prenatal alcohol exposure exhibit cognitive difficulties and significant maladaptation that prevent them from leading productive, independent lives [6,7]. Across the population, the profile of cognitive dysfunction among individuals with prenatal alcohol exposure is highly variable, though there are some commonalities in functional compromise among subgroups, and conceptual models of overarching deficits have been proposed [8]. However, no single behavioral phenotype specific to alcohol teratogenicity has been described, and a single behavioral phenotype is unlikely. Without a behavioral phenotype specific to the teratogen alcohol, attributing an alcohol-exposed child's dysfunction to brain damage is often questionable at a clinical level [4]. If indisputable evidence of brain damage (e.g., alterations in neurostructure, neurometabolites and/or neuroactivation) could be found in these individuals, and linked to behavioral deficit, diagnostic efforts could be improved. The “disability” of these alcohol-exposed children would be clearly established and help facilitate eligibility for needed services. Furthermore, if specific alterations in neurostructure, neurometabolites and/or neuroactivation could be linked to clinically meaningful, discrete neuropsychological deficits, development of appropriate intervention programs could be accelerated.
The overall goal of this research study was to determine whether magnetic resonance imaging (MRI), magnetic resonance spectroscopy (MRS) and/or functional MRI (fMRI) could serve as noninvasive methods for definitively identifying global and/or focal brain abnormality across the full continuum of FASD and distinguish diagnostic subclassifications within the spectrum. The results of this comprehensive study are presented in four separate reports: MRS (presented here), and the neuropsychological/behavioral [9], MRI and fMRI [10] outcomes reported separately.
MRS measures concentrations of neurometabolites, including choline-containing compounds (Cho), markers of cell membrane stability and myelination; N-acetyl aspartate (NAA), a neuronal or axonal marker; and creatine (Cre), a marker of metabolic activity [11–14]. Decreased concentrations of Cho and/or NAA have been correlated with organic brain damage in many different disease states and disorders, and with varying levels of cognitive/behavioral dysfunction among both humans and animals [15–20]. Only three FASD MRS studies have been conducted to date, with varied outcomes [16,21,22]. The first FASD MRS study was conducted in a nonhuman primate model of FASD, back in the early 1990s [16]. Cho/Cre was measured in a 34×34×34-mm3 region of interest that included the thalamus, parts of the internal capsule and basal ganglia, and adjacent white matter (Fig. 1A). Cho/Cre increased significantly with increasing duration of prenatal alcohol exposure and increasing impairment in neuropsychological function among animals with the human equivalent of alcohol-related neurodevelopmental disorder (ARND) (cognitive/behavioral impairment, but no physical stigmata of FAS). Interestingly, the only animal to deviate from this pattern was the animal with the most profound cognitive/behavioral impairment and the only live-born animal with FAS-like facial dysmorphia. Rather than having the highest Cho/Cre level, as would have been expected, this animal had the lowest Cho/Cre level (more than two standard deviations below the mean of all other study groups). It was speculated and reported at the time that this animal may have sustained a level of damage that was beyond that of the other animals, perhaps severe enough to result in depletion of cholinergic nuclei. Research in mice had previously confirmed that in utero ethanol exposure could cause severe depletion of cholinergic nuclei, with the most severe effects observed among those with FAS-like craniofacial anomalies [23]. NAA/Cre was also evaluated in the nonhuman primate study. Levels did not vary significantly with exposure or neuropsychological function. More recently, two FASD MRS studies have been conducted in humans, one focusing on the caudate nucleus [22], the other targeting several regions (parietal and frontal cortices, frontal white matter, corpus callosum, thalamus and cerebellar dentate nucleus) [21]. No significant Cho or Cho/Cre differences were observed between the FASD and control groups in either study. Cortese et al. [22] reported that NAA/Cre was significantly higher in their FASD group relative to their control group, whereas Fagerlund et al. [21] reported that NAA/Cre levels were significantly lower in their FASD group relative to their control group in parietal and frontal cortices, frontal white matter, corpus callosum, thalamus and cerebellar dentate nucleus.
Fig. 1.

Nonhuman primate FASD MRS study [16]. (A) The 34×34×34-mm3 voxel included the thalamus, parts of the internal capsule and basal ganglia, and adjacent white matter. Current MRS Study. (B) Five equiangular subregions of the corpus callosum [(1) genu, (2) anterior body, (3) posterior body, (4) isthmus, (5) splenium] were constructed using the mammilary body as a point of reference. Coronal, sagittal and horizontal views of (C) 15×15×15-mm3 hippocampus/basal nuclear voxel in the left hemisphere, (D) 15×15×15-mm3 white matter voxel in the right frontal/parietal region (to replicate the voxel position in the previous nonhuman primate study) and (E) 20-mm-thick axial multivoxel slice (data to be presented in a separate report).
The present study was conducted to assess absolute concentrations of Cho, NAA and Cre in two 15×15×15-mm3 regions of interest: (1) a frontal/parietal white matter region, to replicate the region targeted in the nonhuman primate study [16]; and (2) a hippocampal/basal nuclear region, to extend the brain regions assessed in the human FASD MRS literature and overlap with a region assessed in the MRI component of this study.
2. Methods and materials
2.1. Subjects and study groups
The protocol was approved by the University of Washington Human Subjects Review Board. The three FASD groups were selected from among 1200 patients previously diagnosed by an interdisciplinary team in the WA State FAS Diagnostic & Prevention Network (FAS DPN) of clinics using the FASD 4-Digit Code [24,25]. Briefly, the four digits of the FASD 4-Digit Code reflect the magnitude of expression of the four key diagnostic features of FASD, in the following order: (1) growth deficiency, (2) characteristic FAS facial phenotype, (3) CNS structural/functional abnormalities and (4) prenatal alcohol exposure (Fig. 2). The magnitude of expression of each feature is ranked independently on a four-point Likert scale, with 1 reflecting complete absence of the FASD feature and 4 reflecting a strong “classic” presence of the FASD feature. Each Likert rank is specifically case defined. There are 256 possible four-digit diagnostic codes, ranging from 1111 to 4444. Each four-digit diagnostic code falls into one of 22 unique clinical diagnostic categories (labeled A through V). Seven of the 22 diagnostic categories (4-Digit Categories A–C and E–H) fall under the umbrella of FASD [(A) FAS/alcohol exposed, (B) FAS/alcohol exposure unknown, (C) partial FAS/alcohol exposed, (E–F) static encephalopathy/alcohol exposed and (G–H) neurobehavioral disorder/alcohol exposed]. The three FASD study groups in the current study represent these FASD diagnostic categories. This diagnostic system is currently being used by a wide variety of diagnostic teams in the USA and other countries. The control population was selected primarily from a large cohort of children enrolled at birth in a University of Washington study of typical development conducted through the Department of Speech and Hearing Sciences. With the enrollment of each child in the FAS/PFAS group, a child matched on age (within 6 months), gender and race was randomly identified and invited to enroll from the eligible SE/AE, ND/AE and control populations. The enrollment goal was 80 subjects (20 per group).
Fig. 2.
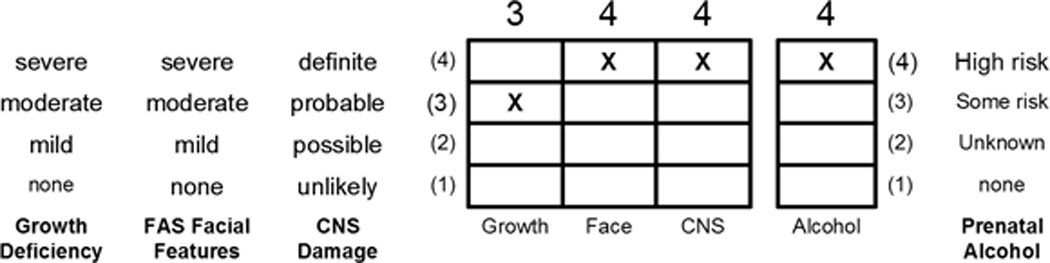
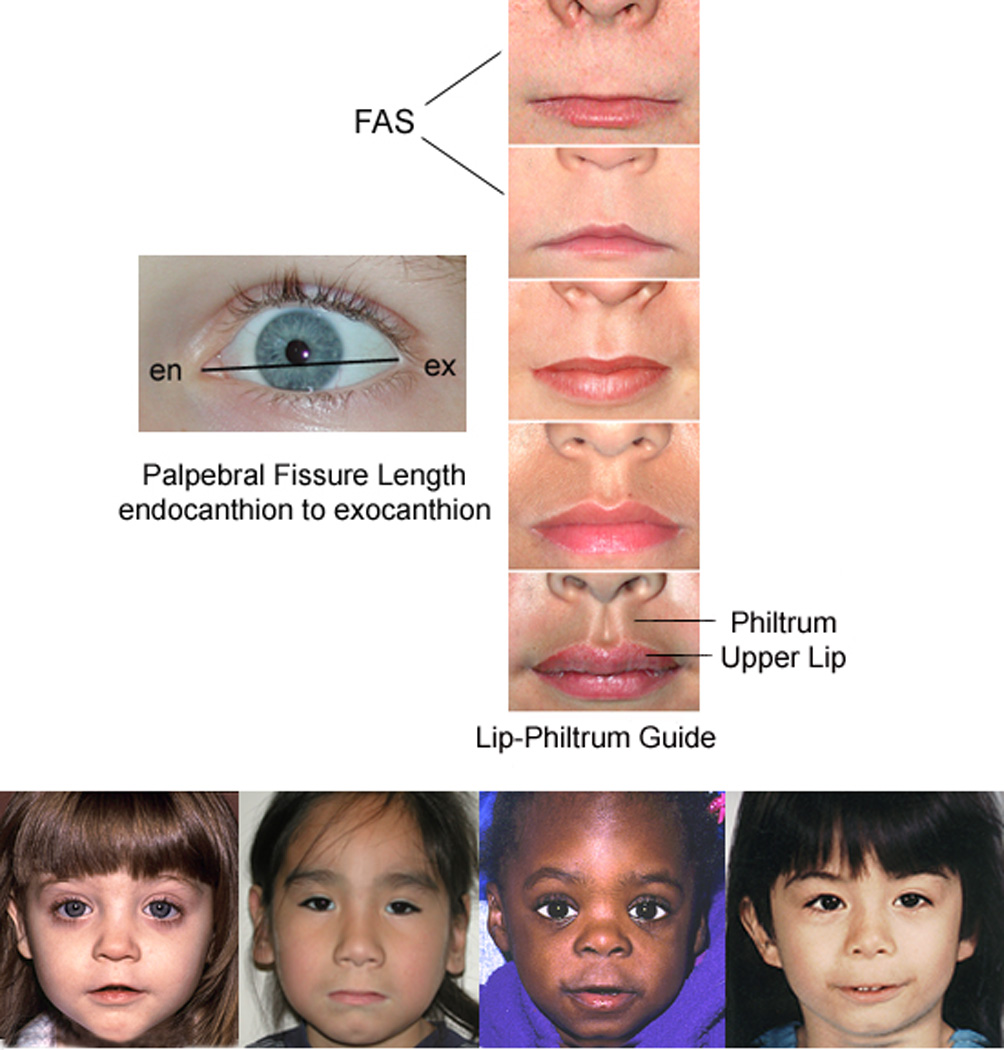
(A) FASD 4-Digit Diagnostic Code. FASD is defined by growth deficiency, specific FAS facial features, evidence of CNS damage, and prenatal alcohol exposure. The 4-Digit Code ranks each of these areas on 4-point, case-defined, Likert scales. The 4-Digit Code (3444) inserted in the grid is 1 of 12 codes that meet the diagnostic criteria for FAS [25]. (B) The Rank 4 FAS facial phenotype, as defined by the FASD 4-Digit Diagnostic Code, requires the presence of all 3 of the following anomalies: (1) palpebral fissure length 2 or more standard deviations below the mean (2) smooth philtrum (Rank 4 or 5 on the Lip-Philtrum Guide); (3) thin upper lip (Rank 4 or 5 on the Lip-Philtrum Guide). Examples of the full Rank 4 FAS facial phenotype for Caucasian, Native American, African American, and Asian American children are shown (copyright Susan Astley Ph.D., University of Washington).
The study enrollment procedure produced a sample of 81 children of diverse ethnicity (Table 1). The age range (8 to 15.9 years) included the broadest age range of children that could be administered a comparable psychometric assessment battery and be reasonably capable of participating in the MR scanning. The 61 children with FASD were highly representative of the entire clinic sample of 1200 from which they were drawn. Each of the four study groups had 16–24 subjects successfully balanced on age, gender and race. The diagnostic features specific to each group were as follows:
Children in Group 1 had a four-digit diagnosis of FAS or partial FAS (FAS/PFAS) (e.g., 4-Digit Diagnostic Categories A–C: with Growth Ranks 1–4, Face Ranks 3–4, CNS Ranks 3 and/or 4, and Alcohol Ranks 2–4). Alcohol Rank 2 (unknown exposure) could only be present if the child had a diagnosis of full FAS because the Rank 4 FAS facial features are so specific to prenatal alcohol exposure [3,26]. Since the only clinical difference between FAS and PFAS in this study was the presence of growth deficiency in the former, FAS and PFAS were combined. In summary, children in Group 1 had severe cognitive/behavioral dysfunction and the FAS facial phenotype.
Children in Group 2 had a four-digit diagnosis of static encephalopathy/alcohol exposed (SE/AE) (e.g., 4-Digit Diagnostic Categories E and F: with Growth Ranks 1–4, Face Ranks 1–2, CNS Ranks 3 and/or 4, and Alcohol Ranks 3–4). In summary, children in Group 2 had severe cognitive/behavioral dysfunction, comparable to Group 1, but did not have the FAS facial phenotype.
Children in Group 3 had a four-digit diagnosis of neurobehavioral disorder/alcohol exposed (ND/AE) (e.g., 4-Digit Diagnostic Categories G and H: with Growth Ranks 1–4, Face Ranks 1–2, CNS Rank 2, and Alcohol Ranks 3–4). In summary, children in Group 3 had prenatal alcohol exposure comparable to Groups 1 and 2, but had only mild to moderate cognitive/behavioral dysfunction and did not have the FAS facial phenotype.
Children in Group 4 (healthy controls/no alcohol exposure) were selected based on parental report that the child was healthy, had no academic concerns and no prenatal alcohol exposure [e.g., 4-Digit Diagnostic Category V: with Growth Ranks 1–2, FAS Face Ranks (no restrictions), CNS Rank 1, Alcohol Rank 1]. In summary, these were nonexposed, healthy, average to high-functioning controls.
Table 1.
Sociodemographic and 4-Digit Diagnostic Code profile of the four study groups. A more detailed profile with between-group analyses is presented in Part I of this series [9]
| Characteristic | 1. FAS/PFASa,b (n=20) |
2. SE/AE (n=24) |
3. ND/AE (n=21) |
4. Control (n=16) |
|||||
|---|---|---|---|---|---|---|---|---|---|
| n | (%) | n | (%) | n | (%) | n | (%) | ||
| Gender | Female | 10 | (50.0) | 8 | (33.3) | 10 | (47.6) | 8 | (50.0) |
| Age at enrollment (years): mean (S.D.) |
12.7 | (2.4) | 12.2 | (2.0) | 12.4 | (2.3) | 12.4 | (2.7) | |
| Race | Caucasian | 12 | (60.0) | 11 | (45.8) | 12 | (57.1) | 13 | (81.3) |
| 4-Digit Code Ranks | |||||||||
| Growth rank | 1. None | 10 | (50.0) | 15 | (62.5) | 13 | (61.8) | 15 | (93.7) |
| 2. Mild | 2 | (10.0) | 2 | (8.3) | 6 | (28.6) | 1 | (6.3) | |
| 3. Moderate | 5 | (25.0) | 3 | (12.5) | 1 | (4.8) | 0 | (0.0) | |
| 4. Severe | 3 | (15.0) | 4 | (16.7) | 1 | (4.8) | 0 | (0.0) | |
| Face rank | 1. None | 0 | (0.0) | 4 | (16.7) | 7 | (33.3) | 10 | (62.5) |
| 2. Mild | 0 | (0.0) | 20 | (83.3) | 14 | (66.7) | 6 | (37.5) | |
| 3. Moderate | 4 | (20.0) | 0 | (0.0) | 0 | (0.0) | 0 | (0.0) | |
| 4. Severe c | 16 | (80.0) | 0 | (0.0) | 0 | (0.0) | 0 | (0.0) | |
| CNS Rank 1–3: Level of functional impairment |
1. None | 0 | (0.0) | 0 | (0.0) | 0 | (0.0) | 16 | (100.0) |
| 2. Moderate | 0 | (0.0) | 3 d | (12.5) | 21 | (100.0) | 0 | (0.0) | |
| 3. Severe | 20 | (100.0) | 21 | (87.5) | 0 | (0.0) | 0 | (0.0) | |
| CNS Rank 4: structural/ neurologic abnormality |
Present | 13 | (65.0) | 6 | (25.0) | 0 | (0.0) | 0 | (0.0) |
| Alcohol rank | 1. No exposure | 0 | (0.0) | 0 | (0.0) | 0 | (0.0) | 16 | (100.0) |
| 2. Unknown exposure | 1 e | (5.0) | 0 | (0.0) | 0 | (0.0) | 0 | (0.0) | |
| 3. Confirmed exposure. Level moderate or unknown |
7 | (35.0) | 12 | (50.0) | 11 | (52.4) | 0 | (0.0) | |
| 4. Confirmed exposure: level high | 12 | (60.0) | 12 | (50.0) | 10 | (47.6) | 0 | (0.0) | |
Six of the 20 subjects in Group 1 had full FAS using the 4-Digit Code. Ten of the 14 PFAS had Rank 4 Faces, but received a diagnosis of PFAS because of their absence of growth deficiency (Growth Rank 1).
Two subjects had agenesis (PFAS) or hypogenesis (FAS) of the corpus callosum.
Definition of Rank 4 FAS Face: palpebral fissure lengths 2 or more SDs below the norm, and lip and philtrum are Rank 4 or 5 on the Lip-Philtrum Guide [24].
All three children with moderate functional impairment had structural evidence of brain abnormality (microcephaly).
The one child with unknown prenatal alcohol exposure had full FAS.
With the use of the FASD terminology introduced by the Stratton et al. [6], the SE/AE group most closely reflects ‘severe ARND’ and the ND/AE group reflects ‘mild ARND’. A comprehensive analysis of the between-group differences of these diagnostic features is presented in the neuropsychological/behavioral report for this study [9].
2.2. Study participation
Participation in the study involved five visits over a 4- to 6-week study period. The neuropsychological and sociodemographic data were collected during Visits 1 and 2. The MR data were collected during Visits 3 and 4. Outcomes of the neuropsychological assessments were shared with the caregivers on Visit 5 and submitted to the child's medical record with caregiver consent.
2.3. Sociodemographic and clinical assessment
A comprehensive sociodemographic and health/medication history of each child was obtained by parent interview and record review. Information included birth data, growth, and all prenatal and lifetime exposures and adverse events. For subjects with FASD, most information was obtained at the time of their FASD diagnostic evaluation. All controls had a reported absence of prenatal alcohol exposure. All children had a standardized digital facial photograph taken at the time of enrollment. The facial photographs were analyzed using the FAS Facial Analysis Software [27] to document the magnitude of expression of the FAS facial phenotype [26]. A more detailed methodology and analysis of the sociodemographic and FASD diagnostic outcomes, including prenatal alcohol exposure histories, are presented in the neuropsychological/behavioral report from this study [9].
2.4. Neuropsychological and psychiatric assessments
A detailed description of the assessment battery and a comprehensive analysis of the between-group differences in neuropsychological outcome are presented in the neuropsychological/behavioral report for this study [9]. Briefly, a comprehensive, standardized assessment battery was administered to each child/caregiver by a psychologist masked to group assignment. The assessment battery was designed to capture the domains of potential neuropsychological impairment seen as the result of the typically diffuse brain damage arising from alcohol teratogenesis (e.g., deficits in executive functioning, visual–spatial skills, learning, memory, academic achievement, speech/language and attention) [8,28–32]. The neuropsychological/behavioral outcomes served to profile the study groups and confirm the groups were clinically and statistically distinct from one another; fundamental to the interpretation of the MR outcomes.
2.5. MR Scanner
All scans (MRI, MRS and fMRI) were acquired using a General Electric 1.5-T scanner in the Diagnostic Imaging Sciences Center at the University of Washington.
2.6. MRI and fMRI
The MRI and fMRI [10] components of this study are reported separately. Briefly, MRI was used to measure the size of the following brain regions: total brain, frontal lobe, caudate, putamen, hippocampus, corpus callosum and cerebellar vermis. fMRI was used to assess neuroactivation in selected brain regions during performance of N-back working memory tasks.
2.7. MR Spectroscopy
The MRS protocol included both single-voxel and multivoxel proton echo planar spectroscopic imaging (Fig. 1C–E). Both of these techniques were included because there are parts of the brain (axial slice at the level of the thalamus) which allow for multivoxel spectroscopy and there are parts of the brain (hippocampus) that best scan with single-voxel techniques due to magnetic field susceptibility problems near the base of the brain. Metabolite concentrations for Cho, NAA and Cre were obtained in absolute concentrations from the single-voxel spectroscopy and relative concentrations (Cho/Cre and NAA/Cre) from the multivoxel spectroscopy. Due to the vast amount of data acquired in the MRS component of this study, this report will focus on the single-voxel spectroscopic imaging. The multivoxel methodology and outcomes will be summarized in a separate, future publication.
2.7.1. Single voxel
Single-voxelMR spectroscopy targeted two 15×15×15-mm3 regions of interest: a right frontal/parietal white matter region and a left hippocampus/basal nuclear region (Fig. 1C and D). The hippocampus voxel targeted the left hippocampus, but due to the size of the voxel, a portion of the left basal nuclear region was also included. The white matter voxel was predominated by white matter superior to the caudate and lateral to Regions 2 and 3 of the corpus callosum. Due to the size of the voxel, the superior tip of the caudate was included. The exact position of the MRS single voxel in three dimensions was overlayed on top of the 3D anatomical image for coregistration purposes to define the extent of tissue overlap as shown in Fig. 1C and D. Point-resolved-spectroscopy pulse sequence and the proton brain exam technique developed by General Electric [33] were used. This technique allows the MR technician to choose the location and size of the volume of interest and then fully automates the adjustment of (1) RF transmit power; (2) center frequency; (3) magnetic field homogeneity; (4) water suppression pulses parameters; and (5) phasing and display of the proton spectra. The 15×15×15-mm3 voxels were positioned over the left hippocampal region and the right frontal/parietal white matter region. Data was then acquired using the following parameters: FID size 2048 complex points; spectral width 2000 Hz; spectral frequency of 63.8 MHz; TR/TE 2000/30 ms. The MRS signal was averaged 128 times so the total acquisition time was 4 min and 16 s. A water spectrum of the same region was also acquired (without water suppression) for quantification used in the LC model software. To optimize the LCModel parameters, phantoms with known concentrations of brain metabolites were prepared and scanned at various acquisition settings. From these spectra, libraries of phantom data, or basis sets, were created as detailed in the LCModel manual [34]. The MR signal strength from the metabolites scanned in the phantoms were used to calculate brain tissue concentrations based on the equation [Note to Editor: this equation will be submitted to the editor first week of Jan. 2009]. The absolute concentrations (millimoles) of Cho, NAA and Cre were computed as detailed in the LCModel manual [34,35] consistent with other techniques employing water referencing [36,37]. Following line fitting, both metabolites and water amplitudes were adjusted for acquisition parameters (receiver settings and transmitter gain) and voxel size compared to the phantom data. Water amplitudes were then adjusted using estimates of water molarity and attenuation [36] and multiplied by the tissue fraction within the voxel. Dividing adjusted metabolite peak amplitudes by this corrected water term yielded metabolite concentrations. Tissue fraction was calculated by summing the CSF voxels within the larger MRS voxel which were segmented out using the high-resolution 3D anatomical image and then dividing the brain volume (total volume-CSF volume) by the total MRS voxel volume. In other words, this software does a correction for the MRS signal attenuation caused by CSF volume based on each individual high-resolution anatomical scan. Quantification of Cho, Cre and NAA required an additional step to correct metabolite data for the differential T2 of the phantom data compared to typical in vivo estimates [34]; this step served to scale concentration output similar to our previous work [37,38]. The ratios Cho/Cre and NAA/Cre were also assessed for comparison to a previous nonhuman primate FASD MRS study [16]. Throughout this report, these metabolites will be preceded by the letter ‘h’ or ‘w’ to reflect whether they were derived from the hippocampus or white matter voxels.
2.8. MRS Hypotheses
In this report, the analyses focus on neurometabolite differences between the four study groups. The hypotheses were derived from the previous nonhuman primate FASD MRS study [16], the human FASD MRS literature [21] and confirmation from the neuropsychological/behavioral [9] and MRI components of this study that the four study groups present along a continuum of increasing impairment.
2.8.1. Primary hypotheses
The mean Cho concentration (and/or Cho/Cre) in the white matter and/or hippocampus voxels will be lower in the FAS/PFAS group than in the control, ND/AE and SE/AE groups [16].
The mean Cho concentration and/or Cho/Cre in the white matter and/or hippocampus voxels will be higher in the functionally impaired but nondysmorphic alcohol-exposed groups (SE/AE and ND/AE) relative to the control group [16].
The mean NAA concentrations and/or NAA/Cre in the white matter and/or hippocampus voxels will decrease as one advances across the four study groups from controls to ND/AE to SE/AE to FAS/PFAS [21].
2.8.2. Secondary exploratory hypotheses
Cho and/or NAA concentrations in the hippocampal and/or white matter voxels will correlate with alterations in size of brain regions measured in the MRI component of this study.
Cho and/or NAA concentrations will correlate with prenatal alcohol exposure (quantity, frequency, timing) [16].
2.9. Statistical analysis
The statistical analyses used to confirm the four study groups were effectively balanced on age, gender and race as described in Part I of this study [9].
2.9.1. Primary hypotheses
Multivariate ANOVA was used to determine whether differences in mean metabolite concentrations existed among the study groups. If significant differences existed, the Duncan post hoc range test was used to identify which group means differed. The Duncan test makes pairwise comparisons using a stepwise procedure. Means were ordered from highest to lowest, and extreme differences were tested first. The Duncan test sets a protection level for the error rate for the collection of tests and identifies homogeneous subsets of means that are not different from one another at the P=.05 level. Age, gender and race were assessed as potential covariates. An a priori test for linear trend was included in the ANOVA to determine whether the mean concentration of Cho, Cho/Cre, NAA and/or NAA/Cre increased or decreased as one advanced across the study groups as specified in the hypotheses. Two-tailed P values of .05 were used throughout the analyses.
2.9.2. Secondary hypotheses
The objective of the secondary analyses was to test additional a priori hypotheses that further supported and extended the primary hypotheses. Due to the increased risk of type I errors resulting from multiple comparisons, all secondary analyses should be considered exploratory and P values interpreted accordingly. These secondary analyses take advantage of a rich dataset and generate hypotheses for future studies. Pearson correlation coefficients were used to assess the strength and direction of an association between two variables measured on continuous scales. ANOVA was used to compare means between groups. Chi-square tests were used to compare proportions between two or more groups.
2.9.3. Power/sample size
This study had 80% power or greater to detect the following effect sizes at a two-tailed alpha level of 0.05: (1) a difference in means equal to or greater than the standard deviation of the mean difference; (2) a correlation coefficient of 0.30 or greater; and (3) a 35-point or greater difference in proportions between two groups. Brooks et al. [37] demonstrated that changes in metabolite concentrations (NAA, Cre, Cho) as small as 12% could be confidently discerned when rigorous positioning guidelines and automated spectral fitting for measuring the cerebral metabolites were used.
3. Results
3.1. Metabolite concentrations across the four study groups: (primary hypotheses)
Metabolite concentrations did not vary by age, race, or gender in this study population.
3.1.1. Choline: white matter voxel
The mean absolute wCho concentration in the frontal/parietal white matter voxel, situated in the right hemisphere, was significantly lower (7% to 12% lower) in the FAS/PFAS group relative to each of the other study groups (Table 2, Fig. 3A). No significant linear trends were observed across the study groups.
Table 2.
MRS Study group: metabolite concentrations in the white matter and hippocampus single voxels across the four study groups and selected individuals
| Metabolite: single-voxel location |
Group | Statistics | |||||||||||
|---|---|---|---|---|---|---|---|---|---|---|---|---|---|
| 1. FAS/PFAS (n=20) |
2. SE/AE (n=24) |
3. ND/AE (n=21) |
4. Control (n=16) |
ANOVA |
|||||||||
| Overall | Post hoc Duncan | A priori linear trend a |
|||||||||||
| Concentration (mM) |
Concentration (mM) |
Concentration (mM) |
Concentration (mM) |
Fb | P | Homologous groups |
Fc | P | |||||
| Mean | (S.D.) | Mean | (S.D.) | Mean | (S.D.) | Mean | (S.D.) | ||||||
| Cho | |||||||||||||
| White matter | 1.24 | (.17) | 1.37 | (.19) | 1.32 | (.19) | 1.39 | (.14) | 2.7 | (.05) | 1,234 | 0.04 | (.84) |
| Hippocampus | 1.31 | (.23) | 1.42 | (.21) | 1.40 | (.25) | 1.42 | (.17) | 1.1 | (.36) | 0.01 | (.92) | |
| NAA | |||||||||||||
| White matter | 8.10 | (1.00) | 8.45 | (1.09) | 8.48 | (1.23) | 8.31 | (1.15) | 0.5 | (.66) | 0.30 | (.56) | |
| Hippocampus | 6.89 | (.94) | 7.22 | (1.07) | 6.95 | (1.33) | 7.33 | (.98) | 0.7 | (.58) | 0.80 | (.38) | |
| Cre | |||||||||||||
| White matter | 5.47 | (.57) | 5.73 | (.67) | 5.75 | (.72) | 5.60 | (.88) | 0.7 | (.55) | 0.30 | (.59) | |
| Hippocampus | 5.34 | (.69) | 5.43 | (.78) | 5.33 | (.69) | 5.32 | (.59) | 0.1 | (.96) | 0.04 | (.84) | |
| Cho/Cre | |||||||||||||
| White matter | .229 | (.033) | .242 | (.046) | .233 | (.041) | .251 | (.032) | 1.1 | (.35) | 0.40 | (.53) | |
| Hippocampus | .246 | (.033) | .263 | (.039) | .262 | (.029) | .270 | (.037) | 1.5 | (.22) | 0.30 | (.61) | |
| NAA/Cre | |||||||||||||
| White matter | 1.48 | (.16) | 1.49 | (.26) | 1.48 | (.13) | 1.49 | (.17) | 0.03 | (.95) | 0.01 | (.93) | |
| Hippocampus | 1.30 | (.19) | 1.35 | (.25) | 1.31 | (.23) | 1.39 | (.21) | 0.5 | (.67) | 0.80 | (.36) | |
Duncan: The Duncan multiple comparison range test is reported if the overall ANOVA is statistically significant; commas separate groups with homogeneous means at P<.05. F: F-statistic. Linear trend: ANOVA unweighted linear trend across the four study groups. N/A: Not applicable.
Linear trends involving Cho and Cho/Cre were assessed across three groups (control, ND/AE, SE/AE). All other linear trends were assessed across all four groups.
Numerator degrees of freedom (df)=3; denominator df=total sample size minus 4.
Numerator df=1; denominator df=total sample size minus number of groups.
Fig. 3.

Choline concentration (millimolar) across all the four study groups in the (A) frontal/parietal white matter and (B) hippocampus voxels.
3.1.2. Choline: hippocampus voxel
The mean absolute hCho concentration in the hippocampus voxel was on average 7% to 8% lower in the FAS/PFAS group relative to each of the other study groups (Table 2). These differences were not statistically significant. The mean, absolute hCho concentration was 8% lower in the FAS/PFAS group relative to all other groups combined (mean 1.41, S.D. 0.21) (Table 2, Fig. 3B). This difference was near significant (t=−1.8, P=.07). No significant linear trends were observed across the study groups.
3.1.3. NAA: White matter and hippocampus voxels
The mean absolute NAA concentrations in the white matter and hippocampus voxels were on average 2% to 6% lower in the FAS/PFAS group relative to the control group, but no significant differences or linear trends were observed across the study groups (Table 2).
3.1.4. Cre: White matter and hippocampus voxels
No significant group differences or linear trends across the groups were observed in the mean absolute Cre concentrations in the white matter or hippocampus voxels (Table 2).
3.1.5. Cho/Cre: White matter and hippocampus voxels
The Cho/Cre ratios followed the same pattern as the absolute measures of Cho, but the magnitudes of the differences were slightly smaller and the variability of the differences slightly greater (Table 2). The mean Cho/Cre ratios in the white matter and hippocampus voxels were lower in the FAS/PFAS group relative to each of the other groups, but the overall ANOVAs were not statistically significant. Although it is customary not to conduct post hoc pairwise contrasts when the overall ANOVA is not significant, it is important to report from an exploratory standpoint that the mean Cho/Cre level was 9% lower in the FAS/PFAS group relative to the control group in both the white matter (t=2.0, P=.058) and hippocampus (t=1.9, P=.061) voxels. In addition, the mean hCho/Cre in the hippocampus voxel was significantly lower in the FAS/PFAS group than in the other three groups combined (mean 0.26, S. D. 0.03) (t=2.1, P=.041). The lower hCho/Cre ratios in the FAS/PFAS group appeared to be driven by low hCho, not by high hCre. No significant linear trends were observed across the groups.
3.1.6. NAA/Cre: White matter and hippocampus voxels
No significant group differences or linear trends across the groups were observed in mean NAA/Cre in the white matter or hippocampus voxels (Table 2).
3.2. Correlation between brain structure and metabolite concentrations (Secondary Hypothesis 1)
Significant differences in the sizes of brain regions between the four study groups were observed in the MRI component of this study. Correlations between metabolite concentrations and the size of brain regions assessed by MRI are presented in Table 3.
Table 3.
MRS-MRI: Pearson correlation coefficients between the size of brain regions and absolute Cho and NAA concentrations in the left hippocampus and right white matter voxels
| Brain structure | Choline concentration (mM) |
NAA Concentration (mM) |
||
|---|---|---|---|---|
| Left hippocampus voxel hCho |
Right white matter voxel wCho |
Left hippocampus voxel hNAA |
Right white matter voxel bNAA |
|
| Total brain volume (cm3) | .270** | .134 | .042 | .187 |
| Total brain midsagittal area (cm2) | .188 | .200 | .166 | .142 |
| Frontal lobe volume (cm3) | .320** | .208 | .028 | .159 |
| Frontal lobe gray matter volume (cm3) | .287** | .151 | .095 | .126 |
| Frontal lobe white matter volume (cm3) | .298** | .263* | − 0.42 | .203 |
| Corpus callosum | ||||
| Midsagittal area (cm2) | .280** | .448** | .141 | .162 |
| Length (cm) | .258* | .363** | .036 | .104 |
| Region 1: genu midsagittal area (cm2) | .145 | .310** | .052 | .125 |
| Region 2: midsagittal area (cm2) | .071 | .263** | .074 | .147 |
| Region 3: midsagittal area (cm2) | .245* | .379** | .028 | .208* |
| Region 4: midsagittal area (cm2) | .257* | .257* | .063 | .071 |
| Region 5: splenium midsagittal area (cm2) | .189 | 373** | .006 | .071 |
| Cerebellar vermis | ||||
| Midsagittal area (cm2) | .197 | .197 | −.043 | .097 |
| Lobules 1–5: midsagittal area (cm2) | .114 | .277** | −.121 | .112 |
| Lobules 6–7: midsagittal area (cm2) | .307** | .075 | .075 | .033 |
| Lobules 8–10: midsagittal area (cm2) | −.028 | .144 | −.104 | .102 |
| Right caudate volume (cm3) | .079 | −.019 | −.078 | .130 |
| Left caudate volume (cm3) | .005 | −.027 | −.067 | −.008 |
| Total caudate volume (cm3) | .041 | −.023 | −.073 | .059 |
| Right putamen volume (cm3) | .285** | .193 | .011 | .136 |
| Left putamen volume (cm3) | .169 | .135 | .047 | −.054 |
| Total putamen volume (cm3) | .243* | .175 | .030 | .046 |
| Right hippocampus volume (cm3) | .077 | .195 | .049 | .137 |
| Left hippocampus volume (cm3) | .220* | .155 | .124 | .082 |
| Total hippocampus volume (cm3) | .154 | .180 | .090 | .112 |
P<.05.
P<.01.
3.2.1. White matter voxel
The 15×15×15-mm3 voxel in the right hemisphere included the superior tip of the caudate, but was predominated by white matter in the frontal/parietal region, lateral to Regions 2 and 3 of the corpus callosum (Fig. 1B). The wCho concentration decreased significantly with decreasing volume of the frontal lobe white matter and the midsagittal area of cerebellar vermis lobules 1–5. wCho also decreased significantly with decreasing midsagittal area of the corpus callosum as a whole and of each of its five subsections (most strongly with Region 3). wCho concentration was not significantly correlated with total brain volume. The wNAA concentration in the white matter voxel, situated lateral to Regions 2 and 3 of the corpus callosum, decreased significantly with decreasing midsagittal area of Region 3 of the corpus callosum.
3.2.2. Hippocampus voxel
The hCho concentration in the voxel that included the hippocampus and basal nuclear region in the left hemisphere decreased significantly with decreasing size of the left hippocampus, frontal lobe, corpus callosum, cerebellar vermis lobules 6–7, putamen and total brain (Table 3). hNAA, hCre, hNAA/Cre and hCho/Cre levels in the hippocampus voxel did not correlate significantly with the size of any brain region.
3.2.2.1. Partial voluming
It is important to note that a fixed-size voxel will capture more surrounding tissue in a smaller brain than in a larger brain. This is referred to as partial voluming. This could influence the mean metabolite concentration within a voxel, since metabolite concentrations vary normally by region and tissue type. The mean total volume of the brain for the FAS/PFAS group was 11% smaller than that for the control group. Thus, the fixed-size voxel in the hippocampal region would capture, on average, 11% more surrounding tissue in the FAS/PFAS group than in the control group. The mean hCho concentration in the FAS/PFAS group was 1.31 mM compared to 1.42 mM in the control group. If the lower hCho level in the FAS/PFAS group was solely an artifact of inclusion of 11% more tissue from adjoining regions, those adjoining regions would have to have exceptionally low hCho levels (0.32 mM or lower, if one assumes the remaining 89% of the voxel had a mean hCho level of 1.42 like the controls) to reduce the mean hCho level in the FAS/PFAS hippocampus voxel to 1.31. This magnitude of variation in Cho concentration between adjacent tissues far exceeds the normal regional variation reported in the literature [39,40]. Due to the size of the voxel placed in the hippocampus region, hippocampal and basal nuclear regions were captured in all subjects, including those in the control group (Fig. 1C). It would appear from visual inspection of the hippocampus voxel that inclusion of adjacent tissue would likely increase the white matter content of the voxel. Cho levels are typically higher in white matter than in gray matter [39–41]. If the FAS/PFAS voxel had a higher proportion of white matter, one would expect the hCho level in the hippocampus voxel in the FAS/PFAS group to be higher than that in the control group, not lower. The FAS/PFAS group was not the only group with microcephaly. Two subjects in the SE/AE group had microcephaly. The mean hCho concentrations in the two subjects with microcephaly were identical to the mean hCho level in the remaining subjects with normocephaly in the SE/AE group. Thus, inclusion of adjacent tissue in the hippocampus voxel of these two subjects did not result in a lower hCho level. These results suggest, but do not confirm, that the lower hCho among the FAS/PFAS group is not solely an artifact of partial voluming.
3.3. Alcohol and metabolite concentrations (Secondary Hypothesis 1B)
Differences in prenatal alcohol exposure histories between the four study groups are presented in Part I [9]. Although all three FASD groups had comparably high levels of exposure, the proportion of subjects with exposure in all three trimesters increased significantly as one advanced across the four groups from controls to FAS/PFAS. Several measures of prenatal alcohol exposure (quantity, frequency, timing) correlated with metabolite concentrations. For example, the wCho decreased significantly with increasing number of days per week of drinking reported just prior to pregnancy (Pearson correlation coefficient −.300, P=.031, n=52). Of the 53 alcohol-exposed subjects with documented exposure by trimester, 11 were reportedly exposed only in the first trimester, 9 only through the second trimester and 33 through all three trimesters. The mean wCho concentration was identical between the 16 controls (mean 1.39, S.D. 0.14) and the nine subjects with first trimester-only exposure (mean 1.39, S.D. 0.18) (Fig. 4). The mean wCho concentration was significantly lower among the 42 subjects with exposure through the second or third trimesters (mean 1.29, S.D. 0.18) than the 26 subjects with no exposure or exposure only through the first trimester (mean 1.39, S.D. 0.15) (t=2.1, P=.48). A near-significant correlation was observed between hCho and alcohol exposure when average number of days of drinking was multiplied by average number of drinks per occasion just prior to pregnancy (Pearson correlation coefficient −.281, P=.07, n=41). No significant correlations were observed between alcohol exposure and NAA or Cre concentrations in either the hippocampus or white matter voxels.
Fig. 4.

The mean Cho concentration (millimolar) in the frontal/parietal white matter voxel was significantly lower among the 46 subjects with alcohol exposure through the second and third trimesters than the 26 subjects with no exposure or exposure only through the first trimester.
4. Discussion and conclusions
4.1. Primary MRS findings
The primary findings of this study include the following.
4.1.1. Frontal/parietal white matter voxel
A significant decrease (7–12%) was observed in the wCho concentration in the FAS/PFAS group relative to each of the other study groups. wCho in the frontal/parietal white matter voxel also decreased significantly with decreasing corpus callosum size, frontal lobe white matter volume and increasing level of alcohol exposure. The wNAA concentration also decreased with decreasing size of corpus callosum region 3. The white matter voxel was aligned lateral to corpus callosum regions 2 and 3.
4.1.2. Hippocampus voxel
A near significant 8% decrease was also observed in the hCho concentration in the FAS/PFAS group relative to all other groups combined. The hCho concentration in the left hippocampus voxel decreased significantly with decreasing size of several brain regions, most notably the left hippocampus and the frontal lobe. The frontal lobe is innervated by cholinergic projections from the nucleus basilis of Meynert (basal nucleus) [42]. Both the basal nucleus and hippocampus were captured in the hippocampus voxel.
4.2. What do the Cho, NAA and Cre metabolite levels reflect?
4.2.1. NAA (A neuronal or axonal marker)
NAA is an amino acid found only in neurons and is synthesized in the brain. The –CH3 group of NAA is visible as a large narrow peak at 2.02 ppm in 1H spectra obtained from human brain [14] (Fig. 5). The quantity of NAA varies regionally; some studies demonstrate it increases rostrally [41]. NAA is an indicator of neuronal development/degradation [43]. Reduced cranial NAA has been associated with axonal loss, active degradation of NAA, injured neurons, gliosis and/or dysfunctional or inhibited mitochondria.
Fig. 5.

Spectral frequency showing key metabolites: Cho, Cre and NAA.
4.2.2. Cre (A marker of metabolic activity)
The creatine signal, constituted of both creatine and phosphocreatine, reflects energy phosphate metabolism [13]. The Cre peak was thought to be relatively constant between individuals and in most brain areas [36]; therefore, it was often used as an internal reference. However, the accuracy of Cre as an internal standard is controversial, because Cre can vary under pathological conditions [44]. Cre is found in greater concentrations in gray matter than in white matter [45].
4.2.3. Cho (A marker of cell membrane integrity, myelination)
Cho is a precursor of two important molecules: phophatidylcholine (PtdCho) and acetylcholine (ACho). Cho is present in membranes of all cells, where it constitutes the polar subunit of PtdCho (i.e., lecithin), sphingomyelin and plasmalogens. Within cholinergic neurons, Cho is also the precursor for the synthesis of the neurotransmitter ACho [46]. The rate of ACho synthesis is regulated by the concentration of substrate Cho in cholinergic neurons. ACho is a neurotransmitter that is critical for many aspects of memory, cognition and mood [47]. The Cho peak at 3.22 ppm includes phosphorylcholine, glycerophosphocholine and a relatively negligible amount of free choline [14]. Phosphorylcholine and glycerophosphocholine constitute the precursors and degradation products of PtdCho. Thus, the Cho signal reflects the precursors and degradation products of PtdCho, not PtdCho itself. PtdCho is the membrane-bound form of Cho. An increase in the Cho peak is associated with an increase in membrane breakdown or turnover, myelination or inflammation, and has been observed in demyelinating diseases [48] and in brain tumors [49,50]. The major phospholipids in brain membranes are PtdCho, phosphatidylserine (PtdS) and phosphatidylethanolamine (PtdE). The phosphatides account for 85% of total brain phospholipids. Moreover, the choline in PtdCho represents about 80% of the total membrane-bound choline in the brain. PtdCho is a cellular phospholipid reservoir that provides free choline for ACho synthesis. When free extracellular Cho is absent, stimulated cells experience a decrease in PtdCho, PtdE and PtdS in the membranes. Addition of extracellular Cho protects the membranes from declines in PtdCho, PtdE and PtdS. The protective effect of exogenous Cho on the stimulus-induced depletion of membrane phosphatides depends on its concentration [51].
4.3. Regional variation of Cho, NAA and Cre in healthy individuals
Metabolite concentrations vary between white and gray matter tissue and between different regions of the brain in healthy individuals [39–41]. Wiederman et al. [41] reported that NAA in frontal gray matter is 15% lower than in frontal white matter and 14% lower than in parietal gray matter. Cho in frontal gray matter is 41% lower than in frontal white matter and 25% greater than in parietal gray matter. Cho in parietal gray matter is 53% lower than in parietal white matter. Cre in parietal gray matter is 13% higher than in parietal white matter. Deganonkar et al. [52] and Soher et al. [53] both found that Cho concentrations were higher in the genu than in the splenium of the corpus callosum of normal subjects. The cause of these regional variations is unclear, but it presumably reflects the cellular composition of the different brain regions, with glial cells believed to have higher Cho levels than neuronal cell types [54,55]. Their results were consistent with those of Pouwels and Frahm [40] who demonstrated an anterioRposterior concentration gradient in Cho along the midline, with the highest value in the frontal region among normal subjects.
4.4. Comparison to the nonhuman primate FASD MRS study
Consistent with the nonhuman primate FASD-MRS study [16], only the group with FAS/PFAS had significantly low wCho. In contrast to the nonhuman primate FASD MRS study, significant increases in Cho/Cre with increasing duration of alcohol exposure or functional impairment were not observed across the nondysmorphic control, ND/AE and SE/AE groups. It is important to note that advancements in design and technology afforded greater precision and accuracy in the current study. Although the scans from both studies were obtained in the same scanner and the white matter voxels were placed in the same region, advanced technology allowed the current voxel to be one-third the size of the voxel used in the primate study, and the absolute concentration of Cho (rather than the concentration relative to Cre) could now be accurately obtained. Most importantly, the human study included more severely affected individuals (20 with FAS/PFAS). The primate study had only one animal with facial dysmorphia and cognitive impairments consistent with the human equivalent of FAS. The remaining alcohol-exposed primates had outcomes commensurate with the SE/AE and ND/AE groups. No animal had microcephaly. In the primate study, it was speculated that the increased Cho/Cre signal in the primates may have been associated with membrane break-down, based on the mechanism of cholinergic membrane vulnerability postulated by Wurtman et al. [56]. Wurtman et al. [56] hypothesized that Cho-deprived cholinergic neurons catabolize their own membranes to free up Cho for acetylcholine synthesis. They suggested that this dual use of Cho for membrane and neurotransmitter synthesis could make acetylcholine-producing cells particularly vulnerable to alterations in Cho levels. If acetylcholine was deficient, as has been reported in several animal models of in utero alcohol exposure [57], breakdown of cholinergic neuron membranes could serve as a compensatory measure to free up Cho for acetylcholine synthesis. If cholinergic membranes were breaking down, one would expect to observe elevated Cho/Cre signals. The only animal that deviated from the pattern of increased Cho/Cre with increasing cognitive/behavioral impairment was the one animal with FAS. That animal had the lowest Cho/Cre. It was speculated at the time that that animal may have sustained a level of damage that was beyond that of the other animals, perhaps severe enough to result in depletion of cholinergic nuclei. In such case, compensatory measures such as membrane breakdown would be less successful in achieving adequate acetylcholine levels and would result in a lower Cho/Cre signal. Schambra et al. [23] confirmed that in utero ethanol exposure can cause severe depletion of cholinergic nuclei. In the mildly affected brains of fetal mice, fewer cells were immunoreactive for CAT in the medial septal nucleus and diagonal band of Broca. In the severely affected brains, cells immunoreactive to CAT were totally absent. The severely affected mice had craniofacial anomalies consistent with those in humans with FAS and the single primate with ‘FAS’. Schambra et al. [23] reported that without the projection of the cholinergic neurons of the medal septal nucleus and diagonal band of Broca to the hippocampus, hypoplasia of the hippocampus occurs and memory deficits as well as difficulty inhibiting unwanted behaviors could be expected, as is typically reported in FASD. As presented below, this is consistent with what was observed in the current study.
4.5. wCho concentration, frontal white matter volume and corpus callosum length
The volume of white matter in the frontal lobe and the length of the corpus callosum were significantly smaller in the FAS/PFAS group relative to all other groups (Fig. 6B and C). wCho in the voxel located in the right frontal/parietal white matter, lateral to Regions 2 and 3 of the corpus callosum, was also significantly lower in the FAS/PFAS group relative to all other groups (Fig. 6A). wCho levels decreased significantly with decreasing corpus callosum length and frontal white matter volume across all four study groups (Fig. 6D–F). And wNAA (a purported measure of neuronal or axon density) decreased with decreasing size of corpus callosum region 3. These findings suggest the decreased wCho levels among FAS/PFAS in this study may be reflective of white matter deficits among FAS/PFAS. Studies of the regional distribution of Cho in the normal brain show that Cho concentrations are higher in white matter than in gray matter due to the multiple phospholipid layers of myelin [40]. The main metabolites that contribute to the proton-detected Cho resonance in vivo are phosphocholine and glycerophosphocholine. These compounds are involved in the metabolism of the membrane lipids phosphatidylcholine (i.e., lecithin) and certain amidephosphocholines (i.e., sphingomyelin). Due to its high myelin content, white matter contains more lipids than gray matter (15.6% vs. 5.9% of total wet weight) and also shows a different lipid composition. Under normal physiologic conditions, both lecithin and sphingomyelin are subject to continuous breakdown and resynthesis. Cho concentrations in older children (5–18 years) are about 15% below the levels in infants and young children (0–5 years) [58]. This difference has been attributed to the fact that myelination during early childhood causes a pronounced turnover of membrane precursor molecules. Although there is also a continuous turnover of myelin in adults, the initial process of myelination requires a considerably larger amount of phosphocholine, which is both a key substrate for the glycerophospholipids in myelin and a major contributor to the proton MRS-detected Cho resonance.
Fig. 6.

The FAS/PFAS group had (A) significantly lower wCho concentration in the white matter voxel, (B) shorter corpus callosum lengths and (C) smaller frontal lobe volumes than controls. (D) The smaller the frontal lobe, the shorter the corpus callosum (Pearson correlation coefficient 0.64; P<.001). (E) The shorter the corpus callosum, the lower the wCho concentration (Pearson correlation coefficient 0.45; P<.001). (F) The smaller the frontal lobe, the lower the wCho concentration (Pearson correlation coefficient 0.24; P=.04). Four study groups: FAS/Partial FAS, SE/AE; ND/AE; healthy control with no alcohol exposure.
Volumetric neuroimaging studies in FASD have also shown that white matter structures have suffered larger losses than gray matter structures [20,59,60]. High-resolution 3D MRI and whole-brain surface-based image analysis procedures [60] have shown increased gray matter density and decreased white matter density bilaterally in posterior temporal and inferior parietal regions in alcohol-exposed subjects, suggestive of abnormal myelination. Myelin is made of the membranous processes from glial cells that wrap themselves around axons [61]. Animal studies have shown that astroglial cells, which are integral in the development of myelin, are particularly affected by alcohol exposure [62,63].
4.6. hCho and frontal lobe volume
The hippocampus voxel included the hippocampus and basal nuclear region (nucleus basilis of Meynert). During brain development, cholinergic neurons project from the nucleus basilis of Meynert to the frontal lobe [42]. Lauder and Schambra [64] reported that prenatal ethanol exposure in the mouse led to severely affected development of the forebrain CNS cholinergic system with deleterious effects on the synaptic targets of these cholinergic neurons, including reduced thickness of the cerebral cortex. The frontal lobe was significantly smaller (relative and absolute) in FAS/PFAS relative to all other groups (Fig. 7A). The hCho concentration in the voxel placed in the left hippocampus was near significantly lower in the FAS/PFAS (1.31±.23) group relative to all other groups combined (1.41±.21) (t=−1.7, P=.07) (Fig. 7B). hCho in the hippocampus/basal nuclear voxel decreased significantly with decreasing size of the frontal lobe (Fig. 7C).
Fig. 7.

Correlation between frontal lobe volume (cubic centimeter) and choline concentration (millimolar) in the hippocampus voxel containing the nucleus basilis of Meynert. The frontal lobe is innervated by cholinergic projections from the nucleus basilis of Meynert. (A) Frontal lobe volume was significantly smaller in FAS/PFAS relative to all other groups. (B) hCho in the hippocampus voxel was significantly lower in the FAS/PFAS group relative to all other groups. (C) Frontal lobe volume decreased significantly with decreasing hCho concentration in the hippocampus voxel.
4.6.1. hCho and hippocampus size
The hippocampal system plays a critical role in learning and memory. The absolute size of the left hippocampus became significantly smaller as one advanced across the four study groups from the control group to the FAS/PFAS group (Fig. 8A). hCho in the voxel placed in the left hippocampus was near significantly lower in the FAS/PFAS (mean±S.D. 1.31±.23) group relative to all other groups combined (mean±S.D. 1.41±.21) (t=−1.7, P=.07) (Fig. 8B). hCho decreased significantly with decreasing absolute volume of the left hippocampus (Pearson correlation coefficient .22, P=.049) (Fig. 8C). The volume of the left hippocampus decreased significantly with increasing impairment on measures of visual memory using the Rey Complex Figure Test [65], verbal memory using the California Verbal Learning Test [66] and working memory on an N-back task [67]. Memory performance can be correlated with cholinergic activity in the hippocampus, measured by high affinity Cho uptake or choline acetyltransferase activity. Moreover, mechanical disruption of the septal projections to the hippocampus or lesions of the medial septal nuclei disturb memory retention [68]. Gibson et al. [69] reported that chronic prenatal ethanol exposure produced hyperactivity, decreased the brain and hippocampal weights with no change in body weight and decreased the number of hippocampal CA1 pyramidal cells by 25–30% in the guinea pig.
Fig. 8.

Intercorrelations between hCho, hippocampus volume and cognition. (A) Hippocampus volume increased significantly as one advances across the four study groups from FAS/PFAS to controls. (B) hCho in the hippocampus voxel was lower in the FAS/PFAS group. (C) hCho decreased significantly with decreasing size of the hippocampus (Pearson correlation coefficient 0.22, P=.049.). (D) Performance on the California Verbal Learning Test decreased significantly with decreasing hippocampus volume (Pearson correlation coefficient 0.30, P=.007).
4.6.2. Morphogenetic roles of acetylcholine
Early work by Sulik and Johnston [70,71], Sulik [72], Schambra et al. [23] and Lauder and Schambra [64] illustrated the teratogenic impact of alcohol on the developing cholinergic system. As reported by Lauder and Schambra [64], in the adult nervous system, neurotransmitters mediate cellular communication within neuronal circuits. In developing tissues, neurotransmitters subserve growth regulatory and morphogenetic functions. Accumulated evidence suggests that ACho, released from growing axons, regulates growth, differentiation and plasticity of developing CNS neurons. In addition to intrinsic cholinergic neurons, the cerebral cortex and hippocampus receive extensive innervation from cholinergic neurons in the basal forebrain. Acute exposure to ethanol in early gestation (which prevents formation of basal forebrain cholinergic neurons) significantly compromises cortical development and produces persistent impairment of cognitive functions. The results of this study provide further evidence of the vulnerability of the cholinergic system in FASD and are particularly compelling considering recent promising intervention outcomes using neonatal and perinatal choline supplementation in FASD [73,74].
4.7. FASD MRS human literature
Very few MRS studies have been conducted to date in the field of FASD. Cortese et al. [22] conducted an MRI/MRS investigation of the caudate region in a very small population of children (seven FAS and two FAE by gestalt diagnosis, and four controls). The investigators reported that FAS and FAE were defined on prenatal alcohol exposure and facial dysmorphia, but did not report what facial dysmorphia distinguished their FAS and FAE groups. When the seven children with FAS were compared to the four controls, the FAS group (1) did not have significantly smaller total brain volumes; (2) did have significantly smaller absolute, but not relative caudate volumes; and (3) had significantly higher NAA/Cre and NAA levels in the caudate. No significant Cho or Cho/Cre differences were reported. The investigators used one-tailed P values for all tests of significance. In contrast to the FASD literature [75,76], FAS groups typically have significantly smaller brain volumes, by clinical definition. And in contrast to the general MRS literature [43], including the current FASD MRS study and the FASD MRS study conducted by Fagerlund et al. [21], neuronal dysfunction is typically associated with a decrease in absolute concentration of NAA, not an increase. Although Cortese et al. [22] reported comparisons between the two children with FAE and four controls, these samples were too small to provide clinically or statistically meaningful results.
Fagerlund et al. [21] conducted an MRS study on 10 adolescents/adults with FASD (three FAS, three PFAS and four ARND, using the Hoyme FASD diagnostic guidelines [77]) and 10 healthy controls. All subjects with FAS and PFAS had microcephaly. The controls were matched to the FASD group on head circumference. The FASD group had lower NAA/Cre and NAA/Cho ratios than the control group in several brain regions, but not in the regions that were the focus of this report (hippocampus and caudate). The authors noted, however, that the decreased NAA/Cre and NAA/Cho metabolite ratios appeared to be driven by higher Cho or Cre in the denominators, not by lower NAA in the numerators. Although their absolute metabolite intensities were subject to error, they noted that, on average, NAA was 7% higher and Cre and Cho were 14% higher in their FASD group relative to their control group. Separating numerator from denominator effects is problematic in studies reporting metabolite ratios. Prior to advancements in technology that now allow absolute metabolite levels to be computed, early studies, including the nonhuman primate study [16], had to assess Cho and NAA relative to Cre. The Cre was used as an internal standard with the hope that Cre reflected a stable metabolite across regions and individuals. But numerous studies [14,41,44,52,78] have since demonstrated that Cre varies by region and clinical status. The mean Cre concentration in the current study varied by as much as 9% between regions and study groups. The variability of these Cre concentrations had a marked impact on some of the metabolite ratios observed in the current study. For example, the mean absolute concentrations of wNAA and wCre were both 9% lower in the FAS/PFAS group than in the controls. But when these metabolites were presented as a ratio (wNAA/Cre), the mean wNAA/Cre level for the two groups was identical. Fagerlund et al. [21] did not observe significantly lower Cho/Cre in their FASD group relative to their control group. The current study would not have observed significantly lower wCho either if the three FASD groups (FAS/PFAS, SE/AE and ND/AE) had been combined and the Cho had been assessed as a ratio with Cre. The significantly low absolute concentration of wCho was unique to the FAS/PFAS group in the current study. Many factors differ between the two studies which likely contributed to the different outcomes. The Fagerlund et al. [21] study had a smaller sample size, used different FASD diagnostic criteria, matched their FASD and controls on a key diagnostic feature of FAS (microcephaly), combined their FASD groups and assessed metabolite ratios rather than absolute concentrations of the metabolites.
4.8. Limitations
A limitation of the current study is the use of a fixed-size voxel in brains that vary in size. A fixed-size voxel will include more surrounding tissue in a smaller brain than a larger brain. This, in turn, could influence the mean metabolite concentration within the voxel, since metabolite concentrations vary normally by region and tissue type. wCho levels did not vary significantly with total brain size. hCho levels were positively correlated with total brain size. While secondary analyses suggest the lower mean hCho among the FAS/PFAS group was unlikely to be due entirely to partial voluming, the impact of partial voluming needs to be addressed in future studies. One might consider matching controls to cases on total brain size to eliminate the partial voluming problem, but in so doing, the definition of a healthy, typically developing comparison group is compromised if the subjects in the comparison group have microcephaly.
4.9. Conclusion
This study demonstrated that the FAS/PFAS group has significantly low Cho levels that may reflect white matter deficits in this group. NAA and Cre were comparable between the FASD groups and the controls. This study provides further evidence of the vulnerability of the cholinergic system in FASD and is particularly compelling what with the growing FASD literature on positive outcomes associated with choline supplementation.
Acknowledgments
We would like to acknowledge Katherine Field, Olivia Liang, Winslow Johnson and Katherine Keller for their assistance in the measurement of MRI scans. A special thanks is extended to the children and their families who so kindly contributed time and effort to this study.
Footnotes
This research was supported by NIAAA grant R01-AA12915-01A1 to SJA. Support was also received from the Center on Human Development and Disability, University of Washington (National Institute of Child Health and Human Development grant P30 HD02274).
References
- 1.Smith DW. The fetal alcohol syndrome. Hosp Pract. 1979;14(10):121–128. doi: 10.1080/21548331.1979.11707631. [DOI] [PubMed] [Google Scholar]
- 2.Astley SJ, Clarren SK. Measuring the facial phenotype of individuals with prenatal alcohol exposure: correlations with brain dysfunction. Alcohol Alcohol. 2001;36:147–159. doi: 10.1093/alcalc/36.2.147. [DOI] [PubMed] [Google Scholar]
- 3.Astley S, Stachowiak J, Clarren S, Clausen C. Application of the fetal alcohol syndrome facial photographic screening tool in a foster care population. J Pediatr. 2002;141(5):712–717. doi: 10.1067/mpd.2002.129030. [DOI] [PubMed] [Google Scholar]
- 4.Aase JM, Jones KL, Clarren SK. Do we need the term “FAE”? Pediatrics. 1995;95:428–430. [PubMed] [Google Scholar]
- 5.Streissguth AP, Bookstein FL, Sampson PC, Barr HM. Ann Arbor (Mich) University of Michigan Press; 1993. The enduring effects of prenatal alcohol exposure on child development: Birth through seven years a partial least squares solution. [Google Scholar]
- 6.Stratton K, Howe C, Battaglia F. Institute of Medicine. Washington, DC: National Academy Press; 1996. Fetal Alcohol Syndrome: Diagnosis Epidemiology Prevention and Treatment. [Google Scholar]
- 7.Streissguth AP, Bookstein FL, Barr HM, Sampson PD, O’Malley K, Young JK. Risk factors for adverse life outcomes in fetal alcohol syndrome and fetal alcohol effects. J Dev Behav Pediatr. 2004;25(4):228–238. doi: 10.1097/00004703-200408000-00002. [DOI] [PubMed] [Google Scholar]
- 8.Kodituwakku PW. Defining the behavioral phenotype in children with fetal alcohol spectrum disorders: a review. Neurosci Biobehav Rev. 2007;31(2):192–201. doi: 10.1016/j.neubiorev.2006.06.020. [DOI] [PubMed] [Google Scholar]
- 9.Astley SJ, Olson HC, Kerns K, Brooks A, Aylward EH, Coggins TE, et al. Neuropsychological and behavioral outcomes from a comprehensive magnetic resonance study of children with fetal alcohol spectrum disorders. Can J Clin Pharmacol, FAR. 2008 [PMC free article] [PubMed] [Google Scholar]
- 10.Astley SJ, Aylward EH, Olson HC, Kerns K, Brooks A, Coggins TE, et al. Functional magnetic resonance imaging outcomes from a comprehensive magnetic resonance study of children with fetal alcohol spectrum disorders. J Neurodevelop Disord. 2008 doi: 10.1007/s11689-009-9004-0. [DOI] [PMC free article] [PubMed] [Google Scholar]
- 11.Jung RE, Yeo RA, Chiulli SJ, Sibbitt WL, Weers DC, Hart BL, et al. Biochemical markers of cognition: a proton MR spectroscopy study of normal human brain. Neuroreport. 1999;10:3327–3331. doi: 10.1097/00001756-199911080-00014. [DOI] [PubMed] [Google Scholar]
- 12.Miller BL, Chang L, Booth R, Ernst T, Cornford M, Nikas D, et al. In vivo H MRS choline: correlation with in vitro chemistry/histology. Life Sci. 1996;58:1929–1935. doi: 10.1016/0024-3205(96)00182-8. [DOI] [PubMed] [Google Scholar]
- 13.Ross B, Bluml S. Magnetic resonance spectroscopy of the human brain. Anat Rec. 2001;265:54–84. doi: 10.1002/ar.1058. [DOI] [PubMed] [Google Scholar]
- 14.Ross AJ, Sachdev PS. Magnetic resonance spectroscopy in cognitive research. Brain Res Brain Res Rev. 2004;44:83–102. doi: 10.1016/j.brainresrev.2003.11.001. [DOI] [PubMed] [Google Scholar]
- 15.Miller DH, Austin SJ, Connelly A, Youl BD, Gadian DG, McDonald WI. Proton magnetic resonance spectroscopy of an acute and chronic lesion in multiple sclerosis. Lancet. 1991;337:58–59. doi: 10.1016/0140-6736(91)93383-k. [DOI] [PubMed] [Google Scholar]
- 16.Astley SJ, Weinberger E, Shaw D, Richards T, Clarren SK. Magnetic resonance imaging and spectroscopy in fetal ethanol exposed Macaca nemestrina. Neurotoxicol Teratol. 1995;17:523–530. doi: 10.1016/0892-0362(95)00012-g. [DOI] [PubMed] [Google Scholar]
- 17.Clarren SK, Weinberger E, Clarren SGB, Shaw DWW, Richards T, Astley SJ. Cranial magnetic resonance imaging and proton spectroscopy of children with FAS correlates with cognitive and behavioral outcomes. Alcohol Clin Exp Res. 1994;18:437. [Google Scholar]
- 18.Meyeroff DJ, MacKay S, Constans JM, Norman D, Van Dyke C, Fein G, et al. Axonal injury and membrane alterations in Alzheimer’s disease suggested by in vivo proton magnetic resonance spectroscopic imaging. Ann Neurol. 1994;36:40–47. doi: 10.1002/ana.410360110. [DOI] [PubMed] [Google Scholar]
- 19.Richards T. Proton MR Spectroscopy in multiple sclerosis: value in establishing diagnosis monitoring progression and evaluating therapy. Am J Roentgenol. 1991;157:1073–1078. doi: 10.2214/ajr.157.5.1927795. [DOI] [PubMed] [Google Scholar]
- 20.Sowell ER, Thompson PM, Mattson SN, Tessner KD, Jernigan TL, Riley EP, et al. Voxel-based morphometric analyses of the brain in children and adolescents prenatally exposed to alcohol. Neuroreport. 2001;12:515–523. doi: 10.1097/00001756-200103050-00018. [DOI] [PubMed] [Google Scholar]
- 21.Fagerlund A, Heikkinen S, Autti-Ramo I, Korkman M, Timonen M, Juusi T, et al. Brain metabolic alterations in adolescents and young adults with fetal alcohol spectrum disorders. Alcohol Clin Exp Res. 2006;30:2097–2104. doi: 10.1111/j.1530-0277.2006.00257.x. [DOI] [PubMed] [Google Scholar]
- 22.Cortese BM, Moore GJ, Bailey BA, Jacobson SW, Delaney-Black V, Hannigan JH. Magnetic resonance and spectroscopic imaging in prenatal alcohol-exposed children: Preliminary findings in the caudate nucleus. Neurotoxicol Teratol. 2006;28:597–606. doi: 10.1016/j.ntt.2006.08.002. [DOI] [PubMed] [Google Scholar]
- 23.Schambra UB, Lauder JM, Perusz P, Sulik KK. Development of neurotransmitter systems in the mouse embryo following acute ethanol exposure: a histological and immunocytochemical study. Int J Dev Neurosci. 1990;8:507–522. doi: 10.1016/0736-5748(90)90043-2. [DOI] [PubMed] [Google Scholar]
- 24.Astley SJ. Diagnostic Guide for Fetal Alcohol Spectrum Disorders: The 4-Digit Diagnostic Code. 3rd ed. Seattle (Wash): University of Washington Publication Services; 2004. [Google Scholar]
- 25.Astley SJ, Clarren SK. Diagnosing the full spectrum of fetal alcohol exposed individuals: Introducing the 4-Digit Diagnostic Code. Alcohol Alcohol. 2000;35:400–410. doi: 10.1093/alcalc/35.4.400. [DOI] [PubMed] [Google Scholar]
- 26.Astley SJ, Clarren SK. A case definition and photographic screening tool for the facial phenotype of fetal alcohol syndrome. J Pediatr. 1996;129:33–41. doi: 10.1016/s0022-3476(96)70187-7. [DOI] [PubMed] [Google Scholar]
- 27.Astley SJ. In: Fetal Alcohol Syndrome Facial Photograph Analysis Software. 1.0 ed. Astley SJ, editor. Seattle: University of Washington; 2003. [Google Scholar]
- 28.Bertrand J, Floyd RL, Weber MK, O’Connor M, Riley EP, Johnson KA, et al. National Task Force on FAS/FAE Fetal Alcohol Syndrome: Guidelines for Referral and Diagnosis. Atlanta (Ga): Centers for Disease Control and Prevention; 2004. [Google Scholar]
- 29.Chudley AE, Conroy J, Cook JL, Loock C, Rosales T, LeBlanc N. Public Health Agency of Canada’s National Advisory Committee on Fetal Alcohol Spectrum Disorder Fetal Alcohol Spectrum Disorder: Canadian guidelines for diagnosis. Can Med Assoc J. 2005;172:S1–S21. doi: 10.1503/cmaj.1040302. [DOI] [PMC free article] [PubMed] [Google Scholar]
- 30.Mattson SN, Riley EP. A review of neurobehavioral deficits in children with FAS or prenatal exposure to alcohol. Alcohol Clin Exp Res. 1998;22:279–294. doi: 10.1111/j.1530-0277.1998.tb03651.x. [DOI] [PubMed] [Google Scholar]
- 31.Olson HC, Feldman J, Streissguth AP, Sampson PD, Bookstein FL. Neuropsychological deficits among adolescents with fetal alcohol syndrome: clinical findings. Alcohol Clin Exp Res. 1998;22:1998–2012. [PubMed] [Google Scholar]
- 32.Roebuck TM, Mattson SN, Riley EP. Behavioral and psychosocial profiles of alcohol-exposed children. Alcohol Clin Exp Res. 1999;23:1070–1076. [PubMed] [Google Scholar]
- 33.Webb PG, Sailasuta N, Kohler SJ, Raidy T, Moats RA, Hurd RE. Automated single-voxel proton MRS: technical development and multisite verification. Magn Reson Med. 1994;31:365–373. doi: 10.1002/mrm.1910310404. [DOI] [PubMed] [Google Scholar]
- 34.Provencher SW. [cited Accessed January 20, 2008];LcModel and LcMgui User’s Manual [website] 2000 Jan 19; Available at: http://s-provencher.com/pages/lcm-manual.shtml.
- 35.Provencher SW. Estimation of metabolite concentrations from localized in vivo proton NMR spectra. Magn Reson Med. 1993;30:672–679. doi: 10.1002/mrm.1910300604. [DOI] [PubMed] [Google Scholar]
- 36.Barker PT, Soher BJ, Blackband SJ, Chatham JC, Mathews VP, Bryan RN. Quantitation of proton NMR spectra of the human brain using tissue water as an internal concentration reference. NMR Biomed. 1994;6:89–94. doi: 10.1002/nbm.1940060114. [DOI] [PubMed] [Google Scholar]
- 37.Brooks WM, Friedman SD, Stidley CA. Reproducibility of H-MRS in vivo. Magn Reson Med. 1999;41:193–197. doi: 10.1002/(sici)1522-2594(199901)41:1<193::aid-mrm27>3.0.co;2-p. [DOI] [PubMed] [Google Scholar]
- 38.Friedman SD, Dager SR, Richards TL, Petropoulos H, Posse S. Modeling brain compartmental lactate response to metabolic challenge: a feasibility study. Psychiatry Res. 2000;98:55–66. doi: 10.1016/s0925-4927(99)00053-0. [DOI] [PubMed] [Google Scholar]
- 39.Keller MA, Venkatraman TN, Thomas A, Deveikis A, LoPresti C, Hayes J, et al. Altered neurometabolite development in HIV-infected children. Correlation with neuropsychological tests. Neurology. 2004;62:1810–1817. doi: 10.1212/01.wnl.0000125492.57419.25. [DOI] [PubMed] [Google Scholar]
- 40.Pouwels PJW, Frahm J. Regional metabolite concentrations in human brain as determined by quantitative localized proton MRS. Magn Reson Med. 1998;39:53–60. doi: 10.1002/mrm.1910390110. [DOI] [PubMed] [Google Scholar]
- 41.Wiedermann D, Schuff N, Matson GB, Soher BJ, Du AT, Maudsley AA, et al. Short echo time multislice proton magnetic resonance spectroscopic imaging in human brain: metabolite distributions and reliability. Magn Reson Imaging. 2001;19:1073–1080. doi: 10.1016/s0730-725x(01)00441-6. [DOI] [PubMed] [Google Scholar]
- 42.Selden NR, Gitelman DR, Salamon-Murayama N, Parrish TB, Mesulam MM. Trajectories of cholinergic pathways within the cerebral hemispheres of the human brain. Brain Res Bull. 1999;121:2249–2257. doi: 10.1093/brain/121.12.2249. [DOI] [PubMed] [Google Scholar]
- 43.Scarabino T, Popolizio T, Bertolino A, Salvolini U. Proton magnetic resonance spectroscopy of the brain in pediatric patients. Eur J Radiol. 1999;30:142–153. doi: 10.1016/s0720-048x(99)00055-8. [DOI] [PubMed] [Google Scholar]
- 44.Marshall I, Wardlaw J, Cannon J, Slattery J, Sellar RJ. Reproducibility of metabolite peak areas in 1H MRS of brain. Magn Reson Imaging. 1996;14:281–292. doi: 10.1016/0730-725x(95)02084-7. [DOI] [PubMed] [Google Scholar]
- 45.Chen W, Hu J. Mapping brain metabolites using a double echofilter metabolite imaging (DEFMI) technique. J Magn Reson. 1999;140:363–370. doi: 10.1006/jmre.1999.1842. [DOI] [PubMed] [Google Scholar]
- 46.Freeman JJ, Jenden DJ. The source of choline for acetylcholine synthesis in brain. Life Sci. 1976;19:949–962. doi: 10.1016/0024-3205(76)90285-x. [DOI] [PubMed] [Google Scholar]
- 47.Drachman DA. Memory and cognitive functions in man: does the cholinergic system have a specific role? Neurology. 1977;27:783–790. doi: 10.1212/wnl.27.8.783. [DOI] [PubMed] [Google Scholar]
- 48.Roser W, Hagberg G, Mader I, Brunnschweiler H, Radue EW, Seelig J, et al. Proton MRS of gadolinium-enhancing MS plaques and metabolic changes in normal-appearing white matter. Magn Reson Med. 1995;33:811–817. doi: 10.1002/mrm.1910330611. [DOI] [PubMed] [Google Scholar]
- 49.Falini A, Calabrese G, Origgi D, Lipari S, Triulzi F, Losa M, et al. Proton magnetic resonance spectroscopy and intracranial tumours: clinical perspectives. J Neurol. 1996;243:706–714. doi: 10.1007/BF00873976. [DOI] [PubMed] [Google Scholar]
- 50.Gill SS, Thomas DG, Bruggen NV, Gadian DG, Peden CJ, Bell JD, et al. Proton MR spectroscopy of intracranial tumours: in vivo and in vitro studies. J Comput Assist Tomogr. 1990;14:497–504. doi: 10.1097/00004728-199007000-00001. [DOI] [PubMed] [Google Scholar]
- 51.Ulus I, Wurtman R, Mauron C, Blusztajn J. Choline increases acetylcholine release and protects against the stimulation-induced decrease in phosphatide levels within membranes of rat corpus striatum. Brain Res. 1989;484:217–227. doi: 10.1016/0006-8993(89)90364-8. [DOI] [PubMed] [Google Scholar]
- 52.Deganonkar MN, Pomper MG, Barker PB. Quantitative proton magnetic resonance spectroscopic imaging: regional variations in the corpus callosum and cortical gray matter. J Magn Reson Imaging. 2005;22(2):175–179. doi: 10.1002/jmri.20353. [DOI] [PubMed] [Google Scholar]
- 53.Soher BJ, van Zijl PC, Duyn JH, Barker PB. Quantitative proton MR spectroscopic imaging of the human brain. Magn Reson Med. 1996;35:356–363. doi: 10.1002/mrm.1910350313. [DOI] [PubMed] [Google Scholar]
- 54.Brand A, Richter-Landsberg C, Leibfritz D. Multinuclear NMR studies on the energy metabolism of glial and neuronal cells. Dev Neurosci. 1993;15:289–298. doi: 10.1159/000111347. [DOI] [PubMed] [Google Scholar]
- 55.Urenjak J, Williams SR, Gadian DG, Noble M. Proton nuclear magnetic resonance spectroscopy unambiguously identifies different neural cell types. J Neurosci. 1993;13:981–989. doi: 10.1523/JNEUROSCI.13-03-00981.1993. [DOI] [PMC free article] [PubMed] [Google Scholar]
- 56.Wurtman RJ, Bluszajn JK, Maire JC. “Autocannibalism” of choline-containing membrane phospholipids in the pathogenesis of Alzheimer’s disease—a hypothesis. Neurochem Int. 1985;7:369–372. doi: 10.1016/0197-0186(85)90127-5. [DOI] [PubMed] [Google Scholar]
- 57.Rawat AK. Neurochemical consequences of ethanol on the nervous system. Int Rev Neurobiol. 1976;19:123–172. doi: 10.1016/s0074-7742(08)60703-5. [DOI] [PubMed] [Google Scholar]
- 58.Pouwels PJ, Brockmann K, Kruse B, Wilken B, Wick M, Hanefeld F, et al. Regional age dependence of human brain metabolites from infancy to adulthood as detected by quantitative localized proton MRS. Pediatr Res. 1996;46:474–485. doi: 10.1203/00006450-199910000-00019. [DOI] [PubMed] [Google Scholar]
- 59.Riikonen R, Salonen I, Partanen K, Verho S. Brain perfusion SPECT and MRI in foetal alcohol syndrome. Dev Med Child Neurol. 1999;41:652–659. doi: 10.1017/s0012162299001358. [DOI] [PubMed] [Google Scholar]
- 60.Sowell ER, Thompson PM, Peterson BS, Mattson SN, Welcome SE, Henkenius AL, et al. Mapping cortical gray matter asymmetry patterns in adolescents with heavy prenatal alcohol exposure. Neuroimage. 2002;17:1807–1903. doi: 10.1006/nimg.2002.1328. [DOI] [PubMed] [Google Scholar]
- 61.Friede RL. Gross and microscopic development of the central nervous system. In: Friede RL, editor. Developmental neuropathology. 2nd ed. Berlin: Springer; 1989. pp. 2–20. [Google Scholar]
- 62.Guerri C. Neroanatomical and neurophysiological mechanisms involved in central nervous system dysfunction induced by prenatal alcohol exposure. Alcohol Clin Exp Res. 1998;22:304–312. doi: 10.1111/j.1530-0277.1998.tb03653.x. [DOI] [PubMed] [Google Scholar]
- 63.Guerri C, Pacual M, Renau-Piqueras J. Gleal and fetal alcohol syndrome. Neurotoxicol Teratol. 2001;22:593–599. doi: 10.1016/s0161-813x(01)00037-7. [DOI] [PubMed] [Google Scholar]
- 64.Lauder JM, Schambra UB. Morphogenetic roles of acetylcholine. Environ Health Perspect. 1999;107:65–69. doi: 10.1289/ehp.99107s165. [DOI] [PMC free article] [PubMed] [Google Scholar]
- 65.Spreen O, Strauss E. A compendium of neuropsychological tests: administration norms and commentary. 2nd ed. New York (NY): Oxford University Press; 1998. [Google Scholar]
- 66.Delis DC, Kramer JH, Kaplan E, Ober BA. CVLT-C: California Verbal Learning Test—Children’s Version. San Antonio (Tex): Psychological Corporation; 1994. [Google Scholar]
- 67.Owen AM, McMillan KM, Laird AR, Bullmore E. N-Back working memory paradigm: a meta-analysis of normative functional neuroimaging studies. Hum Brain Mapp. 2005;25:46–59. doi: 10.1002/hbm.20131. [DOI] [PMC free article] [PubMed] [Google Scholar]
- 68.Van der Borght K, Mulder K, Keijser JN, Eggen BJ, Luiten PG, Van der Zee EA. Input from the medial septum regulates adult hippocampus neurogenesis. Brain Res Bull. 2005;67:117–125. doi: 10.1016/j.brainresbull.2005.06.018. [DOI] [PubMed] [Google Scholar]
- 69.Gibson MA, Butters NS, Reynolds JN, Brien JF. Effects of chronic prenatal ethanol exposure on locomotor activity and hippocampal weight neurons and nitric oxide synthase activity of the young postnatal guinea pig. Neurotoxicol Teratol. 2000;22:183–192. doi: 10.1016/s0892-0362(99)00074-4. [DOI] [PubMed] [Google Scholar]
- 70.Sulik KK, Johnston MC. Embryonic origin of holoprosencephaly: interrelationship of the developing brain and face. Scan Electron Microsc. 1982;1:309–322. [PubMed] [Google Scholar]
- 71.Sulik KK, Johnston MC. Sequence of developmental alterations following acute ethanol exposure in mice craniofacial features of the fetal alcohol syndrome. Am J Anat. 1983;166:257–269. doi: 10.1002/aja.1001660303. [DOI] [PubMed] [Google Scholar]
- 72.Sulik KK. Critical periods for alcohol teratogenesis in mice with special reference to the gastrulation stage of embryogenesis. Mechanisms of Alcohol Damage in Utero; London Pitman Ciba Foundation Symposium; 1984. pp. 124–141. [DOI] [PubMed] [Google Scholar]
- 73.Thomas JD, Fiette MHL, Quinn VRE, Riley EP. Neonatal choline supplementation ameliorates the effects of prenatal alcohol exposure on a discrimination learning task in rats. Neurotoxicol Teratol. 2000;22:703–711. doi: 10.1016/s0892-0362(00)00097-0. [DOI] [PubMed] [Google Scholar]
- 74.Thomas JD, Garrison M, O’Neill TM. Perinatal choline supplementation attenuates behavioral alteration associated with neonatal alcohol exposure in rats. Neurotoxicol Teratol. 2004;26:35–45. doi: 10.1016/j.ntt.2003.10.002. [DOI] [PubMed] [Google Scholar]
- 75.Archibald SL, Fennema-Notestine C, Ganst A, Riley EP, Mattson SN, Jernigan TL. Brain dysmorphology in individuals with severe prenatal alcohol exposure. Dev Med Child Neurol. 2001;43:148–154. [PubMed] [Google Scholar]
- 76.Riley EP, McGee CL, Sowell ER. A teratogenic effects of alcohol: a decade of brain imaging. Am J Med Genet. 2004;127C:35–41. doi: 10.1002/ajmg.c.30014. [DOI] [PubMed] [Google Scholar]
- 77.Hoyme HE, May PA, Kalberg WO, Kodituwakku P, Gossage JP, Trujillo PM, et al. A practical clinical approach to diagnosis of fetal alcohol spectrum disorders: clarification of the 1996 Institute of Medicine criteria. Pediatrics. 2005;115:39–47. doi: 10.1542/peds.2004-0259. [DOI] [PMC free article] [PubMed] [Google Scholar]
- 78.Brenner RE, MGMunro P, Barker GJ, Hawkins CP, Landon DN, McDonald WI. The proton NMR spectrum in acute EAE: the significance of the change in the Cho:Cr ratio. Magn Reson Med. 1993;29:737–745. doi: 10.1002/mrm.1910290605. [DOI] [PubMed] [Google Scholar]