Abstract
We conducted a systematic investigation of the reflectance diffuse optical tomography using continuous wave (CW) measurements and nonlinear reconstruction algorithms. We illustrated and suggested how to fine-tune the nonlinear reconstruction methods in order to optimize target localization with depth-adaptive regularizations, reduce boundary noises in the reconstructed images using a logarithm based objective function, improve reconstruction quantification using transport models, and resolve crosstalk problems between absorption and scattering contrasts with the CW reflectance measurements. The upgraded nonlinear reconstruction algorithms were evaluated with a series of numerical and experimental tests, which show the potentials of the proposed approaches for imaging both absorption and scattering contrasts in the deep targets with enhanced image quality.
OCIS codes: (170.5280) Photon migration, (170.3010) Image reconstruction techniques, (100.3190) Inverse problems, (170.6960) Tomography
1. Introduction
Due to the numerous advantages of low cost, portability, and non-ionizing radiation, near-infrared (NIR) diffuse optical tomography (DOT) is emerging as a potential tool for imaging biological tissues. To date, DOT has made a considerable advance and is beginning to move from the laboratory to the hospital. It has been primarily applied to imaging both structural and functional information of brain and breast tissues [1–5]. Recent clinical studies show that DOT can also provide quantitative optical images of hard tissues for early detection of bone and joint-related diseases [3]. DOT uses sophisticated image reconstruction techniques to generate images from multiple boundary measurements, which generally involves solving two problems: the forward modeling and the inverse problem. In the forward modeling, the transmitted or reflected light signals on the boundary are calculated when the NIR light is delivered to the tissue surface. With optimization algorithms and regularization techniques utilized in the inverse problem, the distribution of optical/physiological properties of tissues can be recovered quantitatively by minimizing the difference between the model predicted data and the measured data [6]. While both linear and non-linear reconstruction algorithms are available, considerable efforts have been made to develop various nonlinear algorithms [7]. So far the finite element (FE) and regularization-based nonlinear methods are very popular and robust in DOT community since they can achieve highly accurate and quantitative image reconstruction [7].
Compared with other diffuse optical imaging methods in DOT, the CW approach is more affordable, and easier to be implemented in practice. In most in vivo cases for small animal and human applications, transmission measurements cannot be obtained, so CW reflectance measurements are often adopted to retrieve information of biological tissues on optical contrast [8]. However, the particular challenge using CW reflectance measurements is that its sensitivity has been shown to drop off exponentially in the depth dimension in tissues deeper than several millimeters because the very few late photons are shadowed by the much larger number of first photons [9,10]. In addition, the ill-posedness of reflectance DOT will give rise to image reconstruction artifacts which is able to create ambiguity in image interpretation. In particular, a very important issue that has not been resolved for reflectance DOT using CW measurements, is that the absorption and scattering contrasts can’t be separated effectively even with the use of appropriate regularization techniques although it does very well in transmission DOT [7]. In addition, due to the computational complexity, the model used for describing photon migration in biological tissues has usually been limited to the diffusion approximation (DA) to the radiative transport equation (RTE). However, for cases in imaging small volumes including prostate cancers using CW reflectance measurements, the DA is not able to describe the photon migration precisely due to the small distance between sources and detectors and will introduce significant boundary artifacts in the recovered images [8,11]. In particular, the DA is not accurate enough to model light transport in some tissue regions including low scattering fluid-filled and high-absorption vascular tissues in human brains. To overcome this limitation, we have developed a 3D reconstruction method based on simplified spherical harmonics approximated-RTE [11]. Our previous studies have validated that the developed p3 approximated-RTE is able to provide solutions that are significantly more accurate than the DA for simulating photon migration in small volume tissues [12]. In this study, we will extend the reconstruction scheme based on p3 approximated-RTE to the CW reflectance DOT.
For the new investigation, we made the following four contributions to the CW reflectance DOT in order to address the above challenges for high quality images. At first, we use a new cost function to minimize the least square errors between the logarithm of the computed and measured photon density. Secondly, we applied a depth-adaptive regularization method to recover the deep targets efficiently. Compared with the previous schemes developed based on linear methods [9,13], our regularization method is novel and able to improve the deep target detection because it adopts a depth-adaptive regularization-based nonlinear reconstruction algorithm for CW reflectance DOT. Thirdly, to image small volume tissues with CW reflectance measurements, we introduced simplified spherical harmonics approximated RTE in the forward modeling and compared its performance with the DA. At last, to overcome the absorption-scattering crosstalk issue, we applied the absorption coefficient priors in the reflectance DOT reconstruction algorithms and its efficacy was validated.
2. Methods and materials
In the following sections, we implemented a systematic investigation of reflectance DOT based on the nonlinear reconstruction method and CW measurements. We illustrated how to fine-tune the reflectance DOT reconstruction algorithm using different strategies including the appropriate objective function, the utilization of transport model, the improvement of the inverse problem with depth-adaptive regularization, and the development of new scheme to resolve the absorption-scattering crosstalk problem using CW data.
2.1 Objective function
Our existing DOT reconstruction scheme is based on an iterative solution of the forward and inverse equations so that the following objective function is minimized:
| (1) |
in which , are observed and computed photon density for i = 1, 2…, M boundary locations. In particular, the forward problem is implemented via the solution of the following diffusion equation and type-III boundary conditions:
| (2) |
where is the photon density, D(r) the diffusion coefficient, is a coefficient related to the boundary, is the absorption coefficient, and S(r) is the source term. The inverse solution is obtained through the following equation:
| (3) |
in which expresses and/or D, and is the Jacobian matrix formed by ∂Φ/∂χ at the boundary measurement sites. λ is a scalar and I is the identity matrix and is the updating vector for the optical properties. The diffusion coefficient D can be written as and is the reduced scattering coefficient.
Well defined objective functional is the key to entail superior reconstructed images as compared to images recovered using the existing objective functional in Eq. (1). In this study a new objective function for DOT is proposed, which is to minimize the least square errors between the computed and measured logarithm of photon density:
| (4) |
in which is the logarithm of the measured photon density while is the computed one. Following the Taylor series expansion method, we obtain the approximated optical property (absorption and/or scattering coefficients) from nearby point (),
| (5) |
If the higher order terms are ignored and is assumed, Eq. (5) is rewritten,
| (6) |
The iterative format for Eq. (6) is specified as
| (7) |
Based on Eq. (4), we can solve for the first- and second-order derivatives of F as,
| (8) |
| (9) |
The contribution from the higher order derivative term in Eq. (9) is small and often discarded. Then inserting Eq. (9) into Eq. (6), we get
| (10) |
in which the first order derivative in Eq. (10) is written,
| (11) |
As such, the inverse solution is obtained through the following regularization equation:
| (12) |
in which J is the Jacobian matrix formed by ∂LnΦ/∂χ at the boundary measurement sites. Thus the absorption and/or scattering coefficients are reconstructed through the iterative procedures described by Eqs. (2) and (12).
2.2 Transport model
The migration of photons within the absorbing and scattering media can be described by the time- and energy-independent form of Boltzmana transport equation as,
| (13) |
in which r is the position vector of a photon propagation along the unit direction Ω, Φ(r,Ω) is the energy radiance, s(r Ω) is the source term, σt(r) is the total position-dependent macroscopic transport cross section (absorption + scattering) and σs(r,Ω'-Ω) is the differential macroscopic scattering cross section. The radiance using spherical harmonics at position r in the direction of unit vector Ω can be expanded as a series of the form,
| (14) |
where are associated Legendre polynomials of order l, m with and the coefficients of moments of the series and θ and the axial and azimuthal angles of Ω, respectively. Based on Eqs. (13) and (14), the following Eqs. (15)-(20) are the derived 3D p3 approximated-RTE [11],
| (15) |
| (16) |
| (17) |
| (18) |
| (19) |
| (20) |
in which where is the scattering coefficient. Here the Type III boundary conditions (BCs) are used for the first component while Type I BCs are assumed for the other five components, i.e.,
| (21) |
2.3 Depth adaptive regularization
When we use the general regularization scheme, the reconstruction sensitivity decreases markedly with the depth so that the signal in the deep range may be overwhelmed by unwanted signals in the shallow range in the CW reflectance measurements. Here we propose a depth-adaptive regularization based reconstruction algorithm, in which we assign a smaller regularization parameter with the depth. We demonstrate the improvement of the 3D reconstruction using the proposed scheme for the CW reflectance DOT. The regularization scheme is defined as,
| (22) |
in which expresses and/or is the Jacobian matrix formed by ∂LnΦ/∂χ at the boundary measurement sites. is a regularization diagonal matrix whose diagonal elements are chosen adaptively on the depth. As to the determination of regularization matrix that realizes uniform reconstruction sensitivity over the region of interest, we will take the heuristic way [9] and adopt the value of the diagonal elements of the regularization matrix simply proportional to the square-root values of corresponding diagonal elements of matrix .
2.4 Crosstalk in absorption and scattering with CW reflectance measurements
There is an increased interest in studying the absorption-scattering crosstalk problem based on measured photon density along the boundary domain e.g., localized variations in absorption appear as localized variations in scattering in the reconstructed image or vice versa. To attack the interparameter crosstalk problem in the CW reflectance DOT, we have developed a new normalizing scheme to resolve the crosstalk between absorption and scattering contrasts. Compared with our previous reconstructions scheme with transmission measurements [7], the CW reflectance DOT reconstruction method includes two unique characteristics: (1) the normalization and fast convergence schemes are combined together and used [7]; (2) the absorption coefficient, as a priori functional information is used as the initial guess for absorption coefficient in DOT reconstruction though a homogeneous one is used for optical scattering coefficient. The initial absorption contrast distribution can be estimated from other high resolution optical imaging method such as photoacoustic tomography [14].
3. Results and discussion
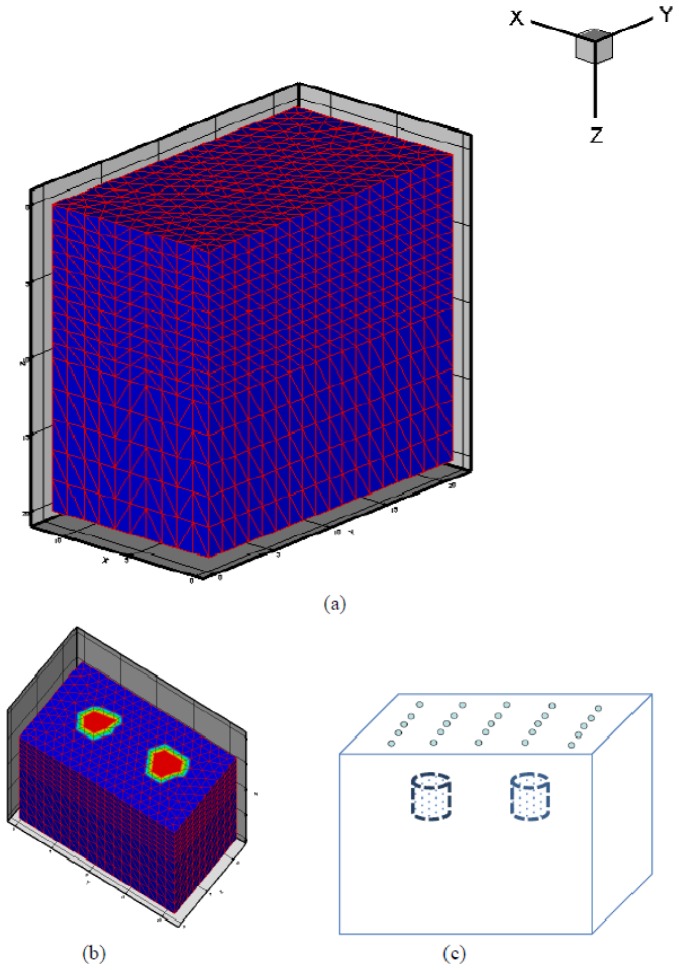
The geometry for the numerical simulation tests is shown in Fig. 1. In these tests, two small cylindrical targets (2 mm in radius each; centered at X = 6.5 mm, Y = 6 mm for left target 1; centered at X = 6.5 mm, Y = 15 mm for right target 2) are embedded in the cubic background medium (Height: 20 mm in Z direction; Width: 21.2 mm in Y direction; Length: 11.86 mm in X direction). The two targets are placed between Z = 2 and Z = 4 mm along the Z-axis direction for numerical simulation tests 1-3 and between Z = 6 and Z = 8 mm for numerical simulation test 4. The optical properties for the background are = 0.01 mm−1 and = 1.0 mm−1. The optical properties of targets for each test are listed in Table 1 in the columns of ground truth. Reconstructions were performed with a uniform mesh of 3872 nodes and 19170 tetrahedral elements. The 25 sources and 242 detectors are distributed uniformly on the top surface of the background medium and all the finite elements nodes on the top surface are utilized as detectors. The reflected mode “measurements” were generated using Eq. (2) for the numerical simulation tests besides the RTE case in which the “measurements” were generated based on Eqs. (15)-(20).
Fig. 1.
Profile (a) and half profile (b) of the simulation geometry. (c) A schematic demonstration of the distribution of laser sources on the top surface of the background medium.
Table 1. Recovered quantitative optical properties, sizes and locations of the targets for the four numerical simulations (S1-S4) and one phantom (P1) tests using improved (New) and existing (Old) algorithms. Note. GT: Ground truth; N/A: Not available. LT: Left target with Y = 6 in Fig. 1(c); RT: Right target with Y = 15 in Fig. 1(c). S1-S4: simulation tests 1-4; P1:Phantom test.
| Tests | (mm−1) | (mm−1) | Target diameter (mm) | Target center location in depth (mm) | |||||||||
|---|---|---|---|---|---|---|---|---|---|---|---|---|---|
| GT | Reconstructed | GT | Reconstructed | GT | Reconstructed | GT | Reconstructed | ||||||
| Old | New | Old | New | Old | New | Old | New | ||||||
| S1 | RT | 0.07 | 0.035 | 0.063 | 1.0 | N/A | N/A | 4.0 | 4.4 | 4.0 | 3.0 | 3.0 | 3.0 |
| LT | 0.07 | 0.035 | 0.067 | 1.0 | N/A | N/A | 4.0 | 3.2 | 3.7 | 3.0 | 3.0 | 3.0 | |
|
| |||||||||||||
| S2 | RT | 0.07 | 0.035 | 0.07 | 1.0 | N/A | N/A | 4.0 | 4.4 | 3.9 | 3.0 | 3.0 | 3.0 |
| LT | 0.07 | 0.035 | 0.07 | 1.0 | N/A | N/A | 4.0 | 3.2 | 3.5 | 3.0 | 3.0 | 3.0 | |
|
| |||||||||||||
| S3 | RT | 0.03 | N/A | 0.025 | 1.0 | N/A | 1.0 | 4.0 | N/A | 3.8 | 3.0 | N/A | 3.5 |
| LT | 0.01 | N/A | 0.01 | 1.5 | N/A | 1.4 | 4.0 | N/A | 4.2 | 3.0 | N/A | 4.0 | |
|
| |||||||||||||
| S4 | RT | 0.03 | N/A | 0.03 | 1.0 | N/A | N/A | 4.0 | N/A | 5.3 | 7.0 | N/A | 7.0 |
| LT | 0.03 | N/A | 0.025 | 1.0 | N/A | N/A | 4.0 | N/A | 4.6 | 7.0 | N/A | 7.0 | |
|
| |||||||||||||
| Phantom P1 | 0.03 | 0.018 | 0.028 | 1.5 | N/A | N/A | 3.0 | 2.2 | 3.0 | 5.0 | 4.0 | 5.0 | |
Without any improved methods, the reconstructed images are plotted in Fig. 2. For the numerical simulation case S1, the logarithm based objective function was applied and the reconstructed images are plotted in Fig. 3. We used the RTE based forward modeling in numerical simulation case S2 and the reconstructed images are plotted in Fig. 4. For the numerical simulation case S3, we applied the absorption prior to overcome the crosstalk issue and the reconstructed images are plotted in Fig. 5. And for the case S4, we used the depth adaptive regularization method and the reconstructed images are plotted in Fig. 6.
Fig. 2.

Reconstructed absorption images at selected planes (Z = 0-4 mm from left to right) using our old algorithm. The target and background optical properties for this test are the same as in the cases S1 and S2. The dotted circles represent the exact positions and sizes of the targets.
Fig. 3.

Reconstructed absorption images at selected planes (Z = 0-4 mm from left to right) for test S1 with the logarithm based objective function as in Eq. (4). The dotted circles represent the exact positions and sizes of the targets.
Fig. 4.

Reconstructed absorption images at selected planes (Z = 0-4 mm from left to right) for test S2 using the forward modeling based on Eqs. (15)-(20). The dotted circles represent the exact positions and sizes of the targets.
Fig. 5.
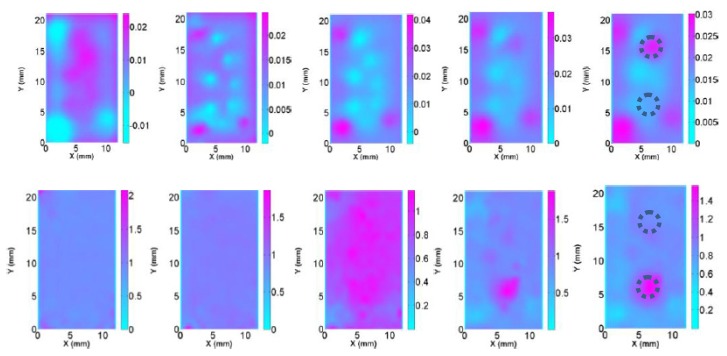
Reconstructed absorption (top row) and scattering images (bottom row) at selected planes (Z = 0-4 mm from left to right) for test S3 using absorption priors to resolve the crosstalk issue between absorption and scattering contrasts. The dotted circles represent the exact positions and sizes of the targets.
Fig. 6.
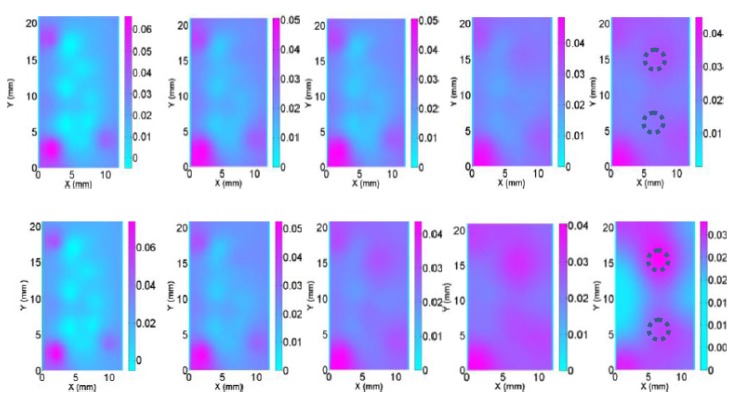
Reconstructed absorption images at selected planes (Z = 3-7 mm from left to right) for test S4 with depth adaptive regularization (bottom row) and with old algorithm (top row). The dotted circles represent the exact positions and sizes of the targets.
For the experimental test, a multispectral CW DOT system was utilized in this study as displayed in Fig. 7. Generally, filtered light at wavelengths 700 to 750 nm from a white light source were delivered through 2-axis open frame scanner heads to multiple source points sequentially on the top surface of phantoms. The screening site was imaged onto a CCD camera (CoolSNAP EZ, Photometrics) with a field of view of 12 mm by 12 mm with 1024 pixels. The measured CW data were then input into our new reconstruction software to generate 3D images of the phantom. 25 sources and 242 detectors were distributed uniformly on the top surface of the phantom. In the phantom experiment, a cylindrical target of 3 mm in diameter was embedded in a cubic background medium with height of 20 mm in Z direction, width of 8 mm in Y direction and length of 10.4 mm in X direction. The target was centered at X = 6.5 mm and Y = 4.5 mm, and its height was between Z = 4 and Z = 6 mm along the Z direction.
Fig. 7.
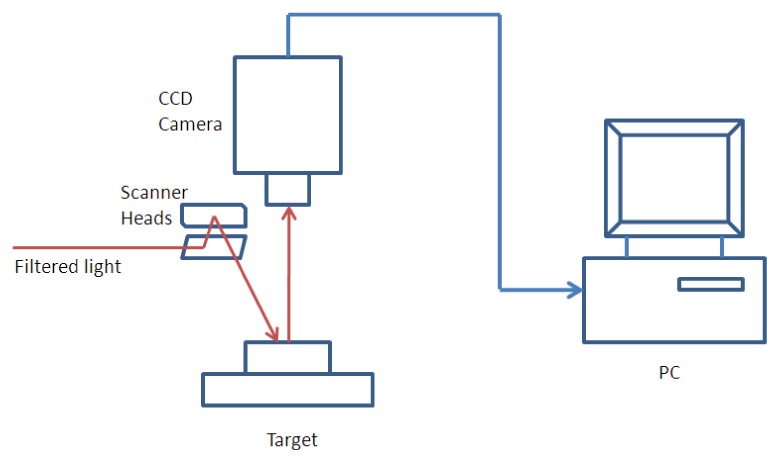
A schematic demonstration of the CCD-based CW experimental system.
The phantom was made of Intralipid as scatterer, India ink as absorber, and 1% Agar powder as solidifier of the phantom. For the experimental test, the optical properties of the background were = 0.01 mm−1 and = 1.0 mm−1 while the optical properties of the single target were = 0.03 mm−1 and = 1.5 mm−1. Reconstructions were performed with the same uniform finite element mesh as used for the numerical simulations though they have different geometries.
We have successfully implemented a new version of our image reconstruction algorithm which uses the logarithm of measured photon density in the objective function directly. From the recovered results in Fig. 3 and Table 1, we found the new objective function resulted in the reconstructed images with reduced boundary artifacts and improved qualification. Specifically, the reconstruction errors of the absorption coefficients for the right target and the left target are 10% and 4.3% with the new objective function and 50% and 50% with the old one, respectively. The target diameter obtained from the images with the new objective function is much closer to the ground truth than that with the old objective function. It is worth noting that the logarithm modification alters the convergence behavior of our nonlinear reconstruction algorithm, presumably due to changes in the objective function surface when the data transformation is applied [15].
In addition, as shown in Fig. 4, the quality of the reconstructed absorption images is enhanced when the transport model-based algorithm was used. For example, the absorption images are much better recovered and have more accurate recovery of optical absorption coefficient in the target areas. However, the diffuse model significantly underestimates the optical absorption coefficient of the targets. In particular, the difference in recovered quantitative optical properties between the two models (DA and RTE) can be as large as over 50% when the CW reflection measurements are used, as shown in Table 1. For example, the exact absorption coefficient for the target is 0.07mm−1 while the recovered one based on DA is 0.035mm−1. More interestingly, we found from Fig. 2 that DA is also able to lead to even more boundary artifacts in the reconstructed images.
Nonuniqueness in inverse problems is an interesting yet complex issue. The existence of a solution to an inverse problem depends on not only the uniqueness property but on other factors including the quality of the data and the statistical behaviors of the problems. In particular, even if a problem is non-unique, it may be possible to distinguish between two identical data sets if a priori information is available. For the crosstalk test, we assumed the right target in Fig. 1(c) had 3 times absorption contrast and the left target had 1.5 times scattering contrast. We found from Fig. 5 and Table 1 that the scheme with a priori functional information (initial absorption coefficient distribution is known) was able to successfully resolve the ill-posedness and crosstalk issues involved in the CW reflectance DOT.
It is observed from the reconstruction results on the bottom row of Fig. 6 and Table 1 that depth resolution of the CW reflectance DOT can be improved by using the depth-adaptive regularized method. The developed scheme was able to retrieve information of deep layers whereas the old method failed to do that, as plotted on the top row of Fig. 6.
For the phantom test, Fig. 8 and Table 1 indicate that the recovered images without using the new schemes are clearly biased in favor of the superficial layers. This indicates that the CW reflectance DOT based on old algorithm has poor performance in recovering the targets in depth resolution. The errors of the recovered absorption coefficient and the target diameter are 40% and 26.7% with the old method, 6.7% and 0% with the new schemes, respectively. The quantitative analysis indicates that the recovered images with the new methods including the logarithm objective function, the transport based forward modeling, and the depth adaptive regularization, can achieve a satisfactory image quality for deep objects without strong boundary artifacts
Fig. 8.
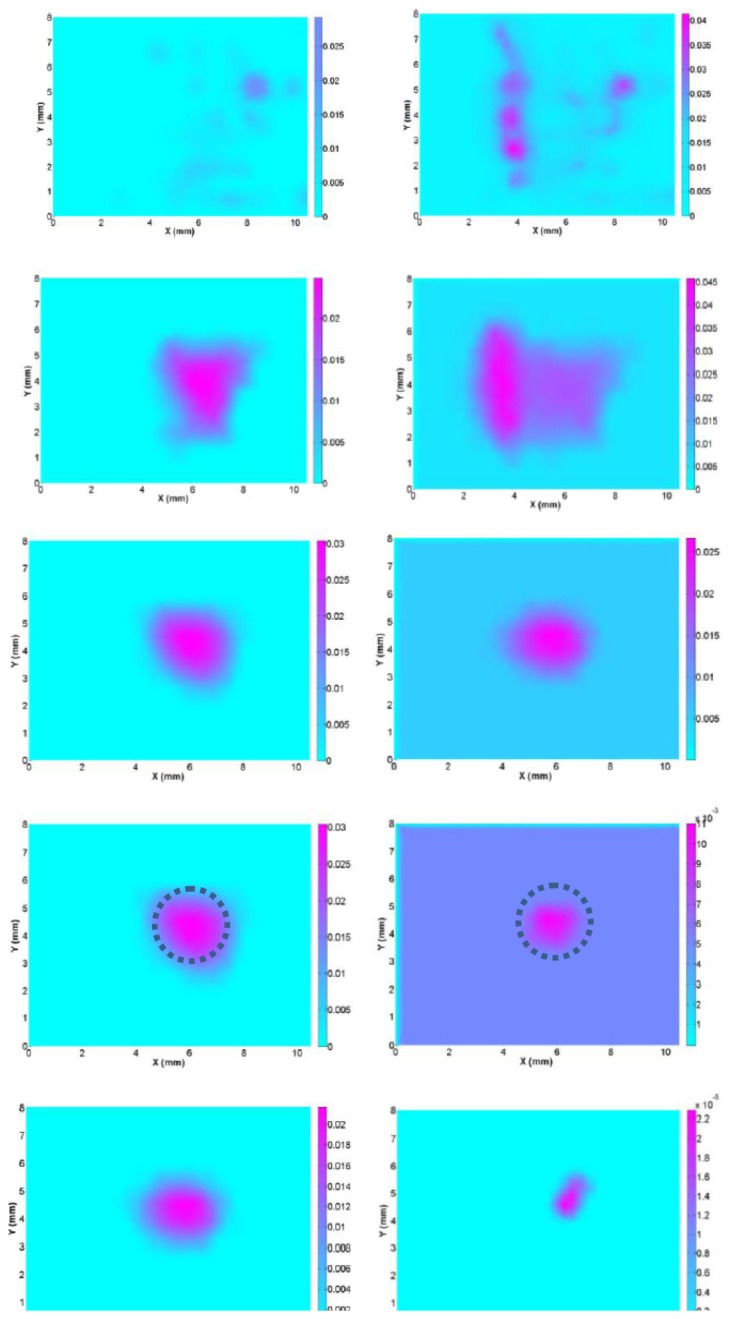
Reconstructed absorption images at selected planes (Z = 2-6 mm from top to bottom row) for experimental test using improved algorithm with logarithm objective function, transport forward modeling and depth adaptive regularization (left column) and previous algorithm (right column). The images on the 1st-5th rows are for the slices at Z = 2-6 mm, respectively. The dotted circles represent the exact positions and sizes of the target located in the central slice.
In summary, we have introduced four new schemes including the logarithm based objective function, the RTE based forward modeling, the depth adaptive regularization, and the absorption priors into the CW reflectance DOT and validated them one by one with numerical simulations. Our phantom experiments further proved that the new methods are able to outperform the old one. In the future, we will apply our methods in the clinical studies.
Acknowledgments
This research was also supported in part by the Natural Science Foundation of China (61273361) and the Key Technology R&D Program of Sichuan Province (2012SZ0159, Science & Technology Department of Sichuan Province). This research was supported by SRG2013-00035-FHS Grant and MYRG2014-00093-FHS Grant from University of Macau in Macau.
References and links
- 1.Yodh B., Chance B., “Spectroscopy and imaging with diffusing light,” Phys. Today 48(3), 34–40 (1995). 10.1063/1.881445 [DOI] [Google Scholar]
- 2.Jiang H., Iftimia N. V., Xu Y., Eggert J. A., Fajardo L. L., Klove K. L., “Near-infrared optical imaging of the breast with model-based reconstruction,” Acad. Radiol. 9(2), 186–194 (2002). 10.1016/S1076-6332(03)80169-1 [DOI] [PubMed] [Google Scholar]
- 3.Yuan Z., Zhang Q., Sobel E. S., Jiang H., “Image-guided optical spectroscopy in diagnosis of osteoarthritis: A clinical study,” Biomed. Opt. Express 1(1), 74–86 (2010). 10.1364/BOE.1.000074 [DOI] [PMC free article] [PubMed] [Google Scholar]
- 4.Yuan Z., “Combing independent component analysis and Granger causality to capture brain network dynamics with fNIRS measurements,” Biomed. Opt. Express 4(11), 2629–2643 (2013). 10.1364/BOE.4.002629 [DOI] [PMC free article] [PubMed] [Google Scholar]
- 5.Mesquita R. C., Franceschini M. A., Boas D. A., “Resting state functional connectivity of the whole head with near-infrared spectroscopy,” Biomed. Opt. Express 1(1), 324–336 (2010). 10.1364/BOE.1.000324 [DOI] [PMC free article] [PubMed] [Google Scholar]
- 6.Srinivasan S., Pogue B. W., Jiang S., Dehghani H., Kogel C., Soho S., Gibson J. J., Tosteson T. D., Poplack S. P., Paulsen K. D., “Interpreting hemoglobin and water concentration, oxygen saturation, and scattering measured in vivo by near-infrared breast tomography,” Proc. Natl. Acad. Sci. U.S.A. 100(21), 12349–12354 (2003). 10.1073/pnas.2032822100 [DOI] [PMC free article] [PubMed] [Google Scholar]
- 7.Yuan Z., Jiang H., “Image reconstruction scheme that combines modified Newton method and efficient initial guess estimation for optical tomography of finger joints,” Appl. Opt. 46(14), 2757–2768 (2007). 10.1364/AO.46.002757 [DOI] [PubMed] [Google Scholar]
- 8.Xu G., Piao D., “A geometric-differential-sensitivity based algorithm improves object depth-localization for diffuse optical tomography in a circular-array outward-imaging geometry,” Med. Phys. 40(1), 0131011 (2013). 10.1118/1.4771957 [DOI] [PubMed] [Google Scholar]
- 9.Endoh R., Fuji M., Nakayama K., “Depth-adaptive regularized reconstruction for reflection diffuse optical tomography,” Opt. Rev. 15(1), 51–56 (2008). 10.1007/s10043-008-0009-9 [DOI] [Google Scholar]
- 10.Puszka A., Hervé L., Planat-Chrétien A., Koenig A., Derouard J., Dinten J.-M., “Time-domain reflectance diffuse optical tomography with Mellin-Laplace transform for experimental detection and depth localization of a single absorbing inclusion,” Biomed. Opt. Express 4(4), 569–583 (2013). 10.1364/BOE.4.000569 [DOI] [PMC free article] [PubMed] [Google Scholar]
- 11.Yuan Z., Hu X. H., Jiang H., “A higher order diffusion model for three-dimensional photon migration and image reconstruction in optical tomography,” Phys. Med. Biol. 54(1), 67–88 (2009). 10.1088/0031-9155/54/1/005 [DOI] [PubMed] [Google Scholar]
- 12.Yuan Z., Zhang Q., Sobel E., Jiang H., “Comparison of diffusion approximation and higher order diffusion equation for optical tomography of osteoarthritis,” J. Biomed. Opt. 14(5), 0540131 (2009). 10.1117/1.3233655 [DOI] [PMC free article] [PubMed] [Google Scholar]
- 13.Kavuri V. C., Lin Z.-J., Tian F., Liu H., “Sparsity enhanced spatial resolution and depth localization in diffuse optical tomography,” Biomed. Opt. Express 3(5), 943–957 (2012). 10.1364/BOE.3.000943 [DOI] [PMC free article] [PubMed] [Google Scholar]
- 14.Yuan Z., Li X., Xi L., “Listening to light scattering in turbid media: quantitative optical scattering imaging using photoacoustic measurement with one-wavelength illumination,” J. Opt. 16(6), 0653011 (2014). 10.1088/2040-8978/16/6/065301 [DOI] [Google Scholar]
- 15.Meaney P., Fang Q., Rubaek T., Demidenko E., Paulsen K. D., “Log transformation benefits parameter estimation in microwave tomographic imaging,” Med. Phys. 34(6), 2013–2023 (2007). [DOI] [PubMed] [Google Scholar]


