Abstract
In this paper, we report the feasibility of integrating a novel low cost optical coherence tomography (OCT) system with a dermascope for point-of-care applications. The proposed OCT system is based on an enhanced time-domain optical coherence tomographic system, called multiple reference OCT (MR-OCT), which uses a single miniature voice coil actuator and a partial mirror for extending the axial scan range. The system can simultaneously register both the superficial dermascope image and the depth-resolved OCT sub-surface information by an interactive beam steering method. A practitioner is able to obtain the depth resolved information of the point of interest by simply using the mouse cursor. The proposed approach of combining a dermascope with a low cost OCT provides a unique powerful optical imaging modality for a range of dermatological applications. Hand-held dermascopic OCT devices would also enable point of care and remote health monitoring.
OCIS codes: (110.4500) Optical coherence tomography, (170.3880) Medical and biological imaging, (100.3175) Interferometric imaging, (100.2000) Digital image processing, (130.3120) Integrated optics devices
1. Introduction
Low cost point-of-care (POC) diagnosis technology is becoming increasingly important in addressing the challenges of remote health care and decentralized clinical care for a growing population. The rapidly advancing field of the mobile computing platform has produced an array of smartphones with capabilities to support next generation POC diagnostic tools. In addition, recent developments in sensor miniaturization and integration into intelligent systems have changed the way healthcare is delivered to the patient [1, 2]. There is a rapid development and commercial interest at the moment in creating low cost, compact and easy to use smartphone based add-ons such as otoscope, dermascope, microscope, ophthalmoscope, smartphone ultrasound, glucometer, blood pressure monitor, spirometer and breath analyser for personal and point of care applications [3].
The dermascope is a non-invasive and low cost diagnostic technique that is primarily used by dermatologists, plastic surgeons, and other medical professionals for early diagnosis of skin related diseases, such as melanoma, skin lesions, inflammatory skin diseases, psoriasis, dermatitis, and actinic keratosis [4–8]. Technological advances are fuelling the current trend in the miniaturization of these dermascope technologies with a view to integrating them into the popular smartphone platforms for personal and point-of-care applications. However, these dermascopes are limited in that they only provide superficial information from the skin surface. Combining them with other imaging modalities such as OCT can allow them to provide structural and functional information. OCT [9] is a non-invasive imaging system that provides cross-sectional, high resolution structural information of a biological tissue by analysing signals generated by interference of backscattered light and reference light.To date, OCT is widely used in many applications including ophthalmology, cardiology, oncology, neurology, dermatology, dentistry, etc. OCT can be implemented either in the time domain (TD) by scanning the reference arm length of the interferometer, or frequency domain (FD) involving use of either a high speed spectrometer [10] or a swept source (SS) [11].However, current OCT devices based on TD and FD are bulky and expensive which limit their applications as POC devices. Currently, there is an unmet need for the development of low cost OCT for POC and personal care applications. Among them, FD-OCT based on photonic integrated circuits (PIC) is an emerging technology which has the potential to provide a small form factor and promises to be more cost efficient [12, 13]. However, currently the insertion losses in a PIC are considerably larger and due to their complexity, are more costly to produce [14, 15] than fiber or micro-optics based systems. There are currently no low-cost TD or FD-OCT solutions commercially available. Integrated optics based array waveguide spectrometers are at the best in their infancy for spectral domain OCT (SD) applications. Based on supplier web-pages, a 10 year development cycle should be considered if thinking about developing a fully integrated optics based low cost SS-OCT system [16]. In this paper, we present a novel compact and low cost TD-OCT method called MR-OCT [17, 18], which uses a single miniature voice coil actuator and a partial mirror for extending the axial scan range. Several multiple path configurations have been already reported based on either oscillating multiple reference arm optical delays [19] or using a combination of multiple signal excitation of acousto-optic deflectors [20]. However, these methods use bulky, expensive and complex optical configurations. Table 1 shows how MR-OCT compares to integrated optics FD-OCT for main components that are currently available.
Table 1. Comparison MR-OCT vs. Integrated optics FD-OCT.
| Technology | Axial range at 10 dB roll off | Speed | Cost | ||||
|---|---|---|---|---|---|---|---|
| Detector | Spectrometer | Source | Electronics | ||||
| Integrated optics FD-OCT | SD-OCT [15] | ~200 µm | 50Hz to 80 kHz | Si | NOD* [21] ≈2 k$ Tornado 860Ϯ [22] | Fiber o/p SLD ≈3-12 k$ |
Image acquisition grabber card. High performance computing platform |
| InGaAS | Not yet commercially available | ||||||
| SS-OCT [12] | ~250 µm | 50 kHz | InGaAs Balanced photo-detector, Thorlabs, PDB450C ≈1.5 k$ |
- | Axsun swept source ≈18 k$ | High-spec digitizer. High performance computing platform |
|
| MR-OCT | ~650 µm | 400Hz to 1kHz | InGaAs Photo detector, Newport, 2053-Fs ≈1.5 k$ |
- | SLD/ LED ≈1-3 k$ | Low-spec digitizer. Moderate computing platform |
|
Not optimised for OCT yet.
Optimized for 800 nm range and not yet commercially available.
It is true that MR-OCT cannot compete against latest FD-OCT systems in terms of scan speed. However, the costs and development time needed to obtain a FD-OCT system integrated into PICs appears to be difficult to predict. A MR-OCT system on the other hand can be built right now, and the costs can easily be scaled based on currently available components. Furthermore, the moderate scan speeds of MR-OCT do not demand high specification computational platforms and mobile systems may be sufficient for its needs.
The similarity of the MR-OCT architecture to a typical CD/DVD ROM pick-up head (CD/DVD PUH) technology supports the notion of building the optical core system of a MR-OCT system with the same small form-factor. The Michelson interferometer required for the MR-OCT can easily be integrated into a PUH. Considering the availability of such PUHs for a purchase price down to about 10 USD, it can be envisioned to build the opto-mechanical core system for a MR-OCT system at a very competitive price [23]. All other required components are widely available and can be used to build a MR-OCT system with low acquisition costs. Furthermore, we demonstrate the feasibility of a MR-OCT system integrated with a dermascope for dermal imaging applications. This system can simultaneously register both the superficial dermascope image and the depth-resolved sub-surface information by an interactive beam steering method. Information about the depth structure combined with the camera image allows detailed evaluation of the subsurface skin morphology.
2. Methods
2.1 Dermascope integrated MR-OCT system
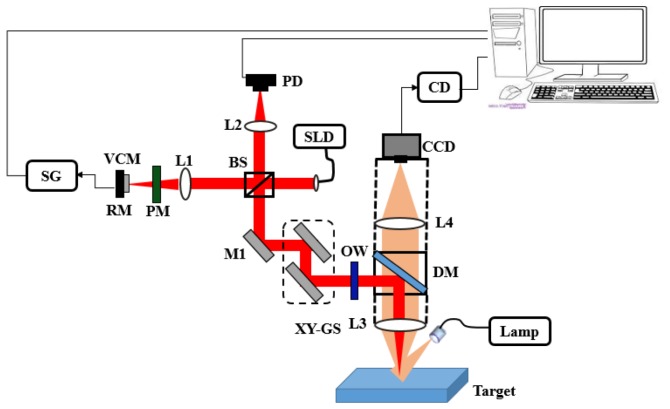
Figure 1 shows a schematic diagram of the integrated dermascope with MR-OCT system based on a free space Michelson interferometer with a voice coil based delay. A broadband 1310 nm superluminescent diode with bandwidth of 56 nm (SLD, DenseLight, Singapore) was coupled into the interferometer via an optical isolator. The measured axial imaging resolution of the system was:13 μm in air. The depth scanning is achieved by a miniature re-circulating optical delay based on a voice coil motor (VCM) actuator and a partial mirror. The VCM was extracted from a CD optical pick up head and was driven at a frequency of 400 Hz with a round trip delay of ~57 μm. A partial mirror (PM) with 20% transmission efficiency is placed very close to the reference mirror (separation distance ~90 μm), causing light to be reflected multiple times between the partial mirror and the reference mirror. At each reflection, a portion of light is transmitted through the partial mirror to the beam splitter and onto the detector to provide reference light corresponding to increasing depths.
Fig. 1.
Experimental setup of a dermascope integrated MR-OCT system based on bulk optics configuration. SLD-superluminescent diode, L1-L4 – Lenses, PM-partial mirror, RM-reference mirror, VCM-voice coil motor, SG-signal generator, PD-photodetector, XY-GS-galvo scanner, DM-dichroic mirror, OW-optical window, CD-camera driver, CCD-charge coupled device.
Each reflection between the partial and reference mirrors is delayed by the round trip time between the two mirrors. The center points of the interference or scan regions are separated by a distance equal to the distance between the PM and the RM. The region from which backscattered light will generate an interference signal with the first reflection of the reference mirror is the same as conventional TD-OCT system. Because of the double pass, the second scan covers a region that is two times larger than the region covered by the first reflection. Likewise, the third scan region, generated from reference light reflected three times, covers a region that is three times larger than that of the first region and so on (shown in Fig. 2(b)). Overlapping of the higher orders occurs when the scan range of a higher order is larger than the PM-RM separation. From the point that the scan regions begin to overlap, they provide data for a continuous scan of the target. There is a decrease in the intensity of the reference beam signal corresponding to higher orders. The amount of this decrease in intensity depends mainly on transmission efficiency of the PM. For example, if the PM reflects 80% and transmits 20% of the reference beam, then the reference beam signal from the PM will have a relative intensity of 80%; the reference beam signal from a single pass to the RM will have a relative intensity of approximately 4%. Similarly, the reference beam from the double pass to the RM will have a relative intensity ~3.2% and the corresponding higher order reference signal will have a gradually reducing relative intensity.
Fig. 2.
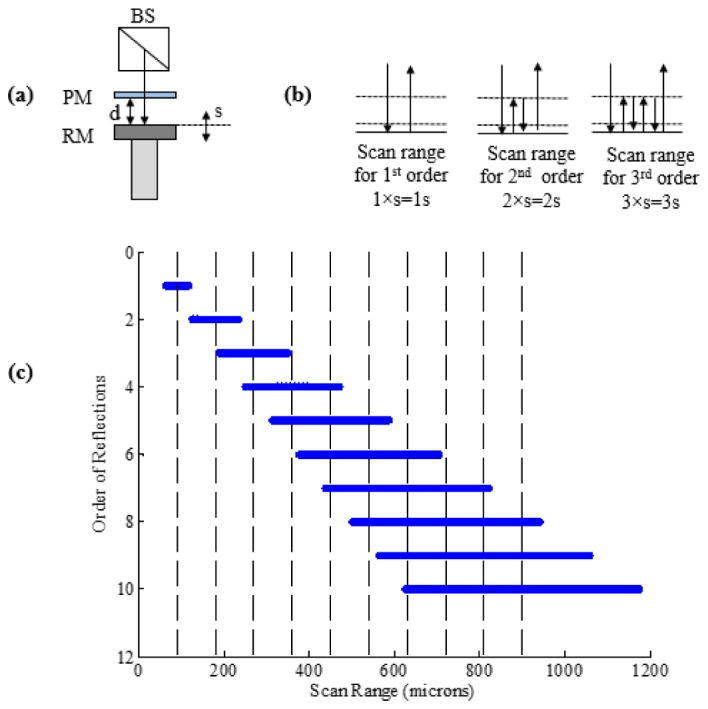
(a) Schematic representation of the systematic increases in the magnitude of each successive scan region associated with the increasing number of reflections of the reference light. “s”-scan range of VCM and “d”- separation distance between partial and reference mirror at the center of scan. (b) Reflection between PM and RM for the first three orders. (c) Calculated scan range measurement of VCM used in experiment with s = 55 μm and d = 90 μm resulting in a total scan range of 1mm.
Since the path length change occurs in the same time duration for the successive reflected reference signal, the corresponding beat frequency of the detected interferograms associated with the multiple references also increases systematically for higher order reference signals thus:
| (1) |
Here, is the maximum beat frequency at the center of the nth order, n is the order of reflection, s is the round trip optical delay of VCM, tVCM is the forward scan time (1/2fVCM) of the VCM and λ0 is the center wavelength of the light source used. The beat frequency is non-linear due to the sinusoidal excitation of the VCM.
The sample arm consists of an optical window (OW) to compensate for the dispersion caused by the PM, a pair of galvanometric driven mirrors, dichroic mirror (DM) and an objective lens with focal length of 50 mm which provided a lateral resolution of 26.9 μm. A DM was used to combine the light from MR-OCT and the dermascope system. The DM has a reflection above 98% for 1310 nm and a transmission of above 90% for visible light. A halogen lamp was used to illuminate the target. The light returning from the target is coupled to a CCD (Baumer, TXG14NIR) via DM and an objective lens. The returning light from the sample and reference arms is detected by an InGaAs photodetector at the output of the interferometer. Next, the output of the photodetector is low-pass filtered and then band-pass filtered based on the beat frequency of the first and nth order. The filtered MR-OCT signal is then digitized by a 12 bit A/D card (AlazarTech, ATS9440) and recorded on a workstation. A LabVIEW programming interface (National Instruments) was employed for data acquisition and hardware control. Based on a conventional TD-OCT, the MR-OCT signal at the output of an interferometer can be deduced. The detected signal signal Id(k)for TD-OCT [24] is stated in Eq. (2).
| (2) |
| (3) |
where Io represents the DC bias, A is the amplitude, G(ΔL) represents the Gaussian shape, and the cos(…) term represents the varying interference signal. For the MR-OCT, Eq. (2) changes as shown in Eq. (3):
where Is is the sample arm intensity, IPM is the reflected intensity from the partial mirror and represents the background signal, n is the order number, and k is the wave number. The term IR.n can be written as (T2 (1-T)n-1)IR where IR represents the input intensity to the reference arm and T represents the transmission ratio of the partial mirror and represents the reference arm intensity for each order n. For each order n a Gaussian gate function G(ΔLn) occurs and these are superimposed. The pathlength difference, ΔLn, depends on the time delay and is caused by PM-RM separation. In this experiment, we have used the first 10 orders to reconstruct the MR-OCT signal with a total scan range, D, of 1 mm.
The total scan range, D, can be expressed by Eq. (4):
| (4) |
where s is the effective scan range (55 μm), d is the PM to RM separation (90 μm) and n is the order of reflections (10 orders). In Eq. (4) it can be observed, that for order n = 1, the total scan range is just (s/2) + (s/2), basically showing the addition of the first half and second half of the first order. For higher orders the term (n-1)d accounts for the additional distance of the orders and finally half of the last order, (ns/2), is added, providing the total range D that all the orders cover together. The optical path length change due to the PM is compensated by OW, as explained above.
2.2 MR-OCT signal processing
Figure 3 depicts the flowchart for MR-OCT processing. As a first step of processing, any DC is removed from the raw interferogram y[n]. The inverse function of the scanner response can be calculated as a lookup table which compensates for the nonlinearity in the axial scans of the raw interferogram. To linearize the interference signal, the sample points of the signal are re-mapped according to a look-up table that relates to the actual movement of the scan mirror, representing a sinusoidal shape. A polyphase filter bank was created using the digital signal processing library in MATLAB from MathWorks. A Chebyshev type 2 (IIR) filter showed good results separating the frequencies of the different orders of reflection. The separated interference signals were then stored in different signal channels. The different channels were stored in MATLAB data structures indicating each order with the letter n. A generalized pseudo code Eq. (5) outputs the signal per order into a variable y:
| (5) |
The variable i designates a sample point, y[i] is the convoluted input signal, fn is a structure of frequency parameters defining a band-pass for an order n, H(fn) indicates the MATLAB filter generation and filter(...) indicates the actual call of the filter function in MATLAB. Subsequently different y signals are obtained for each order n and stored in yn[n, i]. Media 1 (3.9MB, MPG) shows the MR-OCT interferogram generated by scanning the sample arm mirror in the axial direction over a scan range of 2 mm. The different orders can be observed, with each higher order reduced in amplitude. Each frame required an average of one minute processing time.
Fig. 3.
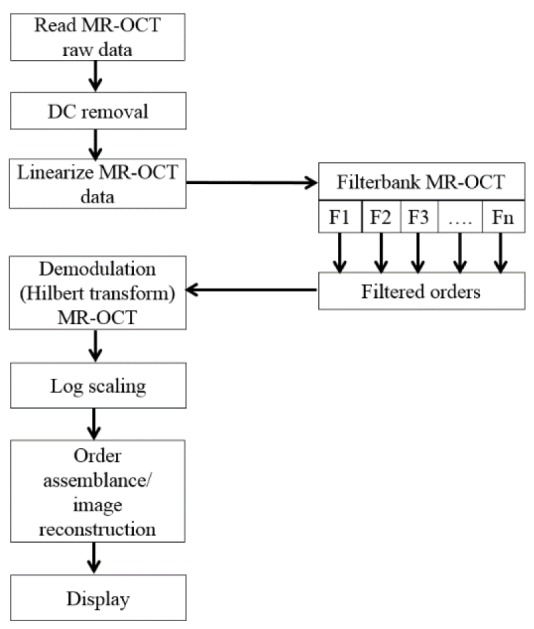
Flowchart of the MR-OCT processing scheme.
The interference data for each order are further processed by applying envelope detection, typically by calling the Hilbert function from MATLAB (hilbert(yn[n,i])). The envelope of the interference signal is the actual intensity level of an interface within the sample material representing the actual structural information and is further used to reconstruct an actual image. The A-lines are now arranged into an image array according to their fundamental lateral position. Finally, the scan segments corresponding to each of the MR-OCT orders are positioned according to the Eq. (6) at their actual depth positions within the image matrix. For each order n the distance from the top of the image matrix can be calculated as dx, and the overlapping regions are stitched together.
| (6) |
where Np denotes the number of pixels in the image matrix, d is the distance of the moving reference mirror to the partial mirror, s is the scan range and n corresponds to the orders. The time taken to record the data for one B-frame with LabVIEW and the Alazartech digitizer was 750 ms (300 raw A-lines). Further time was required to process the data toobtain real A-lines and real B-frames. This processing was performed with MATLAB, as described above, and produced about one B-frame per minute.
2.3 Co-registering MR-OCT beam with the dermascope image
Figure 4 depicts the flowchart for co-registering the MR-OCT beam with the dermascope image. This flowchart was implemented using a LABVIEW program. The program controls the camera, acquires the dermascope image in real time (20 fps) and positions the MR-OCT beam based on the mouse cursor coordinates, by means of the XY galvo scanner.
Fig. 4.
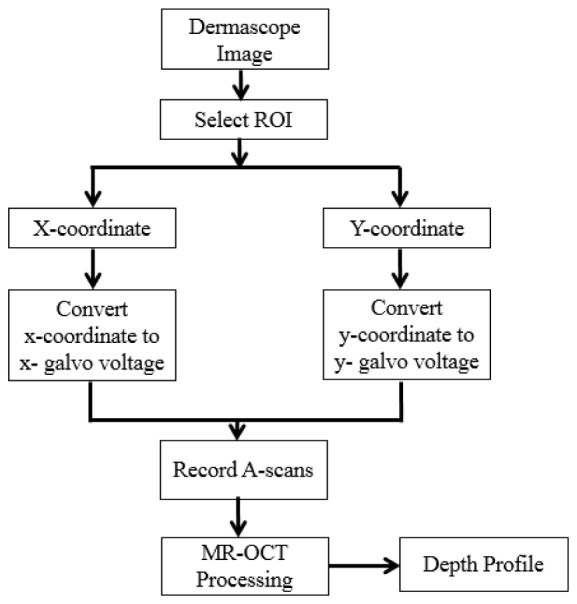
Flowchart for co- registering the MR-OCT beam with a dermascope image. ROI – region of interest.
The galvo voltage V(x,y) is defined by the following equation
| (7) |
where VR corresponds to the maximum voltage range of the galvo scanner, P(x,y) is the image pixel co-ordinate of the mouse cursor and L(x,y) is the total dimension of pixels (1300 × 1040) in x and y of the dermascope image. This allows the user to interactively investigate the depth resolved information of any position of interest on the target by pointing the mouse cursor within the image. Movie clips are provided supporting Fig. 4. (Media 2 (738KB, MPG) ) shows the conceptual design for co-registering the MR-OCT beam with a dermascope image and (Media 3 (3.7MB, MPG) ) shows the real-time implementation of co-registering the MR-OCT beam with a dermascope image based on the flowchart shown in Fig. 4.
3. Results and discussion
3.1 Mirror test for MR-OCT system
The sample mirror was aligned with the output coupler surface (where a low frequency signal is observed). Next the sample mirror was stepped away from the system over a depth of 2 mm in increments of 5 microns. A typical distance for the PM-RM spacing was 90 microns and the resulting set of data included the interference signals from the first ten reflections. The recorded scans are linearized and the scan segments associated with each of the 10 frequencies corresponding to the 10 orders are separated by filtering. The scan segments are then aligned with respect to each other based on the distance between the PM and VCM. Finally, the aligned scan segments are combined to give a single depth scan at each of the 400 positions of the reference mirror. These scans are shown in Fig. 5 as an image. When the alignment of the orders was perfect the line produced appeared straight and smooth, with no interruptions or discontinuities apart from the un-scanned region (where the first and second orders do not overlap).The filter performance was also assessed by looking for artefacts which would have appeared as background signals in this image.
Fig. 5.
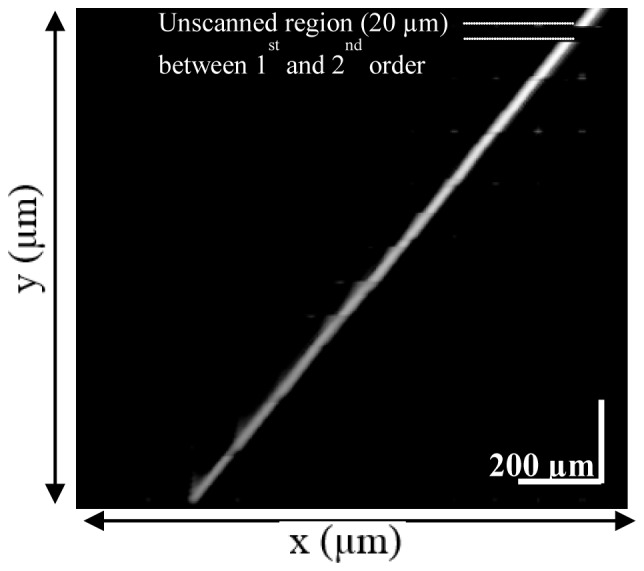
Reconstructed movement of sample mirror. The x-axis corresponds to actual sample mirror movement and the y-axis is the reconstructed image of the movement.
3.2 Sensitivity measurement of the MR-OCT system
Figure 6 shows the measured system sensitivity of various orders of the MR-OCT. The sensitivity of the system was measured by using a mirror as a test object. By placing an OD-3 (optical density-3) filter in the sample arm the signal light has a roundtrip attenuation of 60 dB. During measurement, the irradiation power on the sample surface was around 140 μW.
Fig. 6.
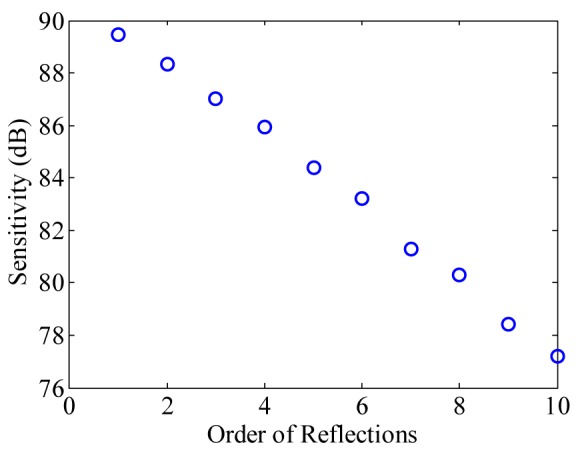
Measured sensitivity plot of the MR-OCT system with 10 successive reflection orders with 1.1 dB roll-off per order.
A variable attenuator was used in the reference arm to adjust the power for best detector efficiency. The measured sensitivity of the first order MR-OCT signal is ~89.44 dB above the noise floor and the tenth order is ~77.22 dB. However, with the MR-OCT configuration, we expect a theoretical sensitivity drop of 0.97dB for each successive MR-OCT order. This degradation is caused by the 80/20 partial mirror. Experimentally the sensitivity degradation was found to be 1.11 dB.
3.3 In-vivo imaging of fingertip with MR-OCT system
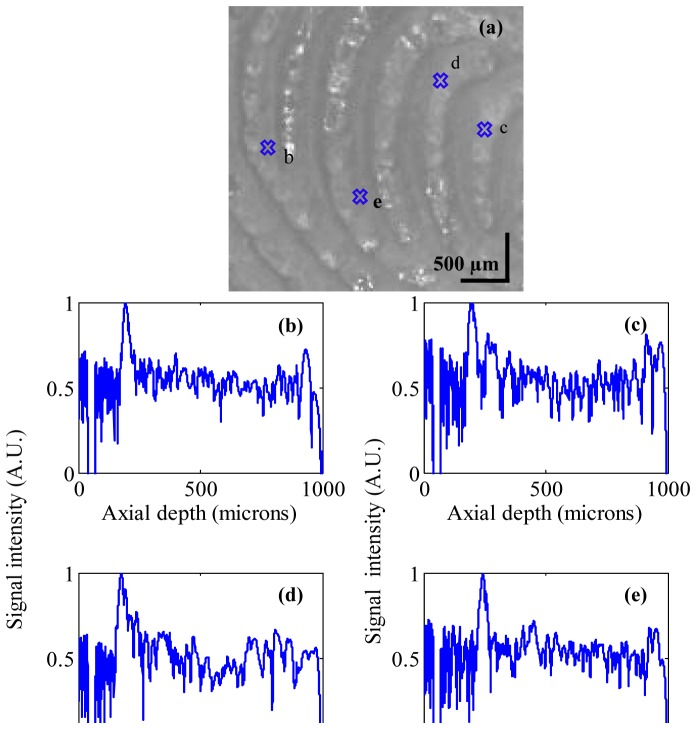
To test the feasibility of our proposed combined dermascope with MR-OCT system, the finger tip of a healthy human volunteer was imaged. Figure 7(a) shows the dermascope image of the fingertip area with dimensions of 3 × 3 mm. Figure 7(b)-7(e) shows the MR-OCT A-scan plot of the fingertip taken at different regions of interest marked as b-e in Fig. 7(a). In general the A-lines are previews taken before B-frame and they provide qualitative and quantitative information about the regions of interest.
Fig. 7.
(a) Dermascope image of a fingertip area. (b-e) shows the MR-OCT A-scans of a human fingertip recorded in vivo at different regions of interest marked as b-e in (a).The signal peaks indicate the (optical) positions of the reflecting interface. The measured dermal to epidermal junction thickness using the MR-OCT system was ~540μm.
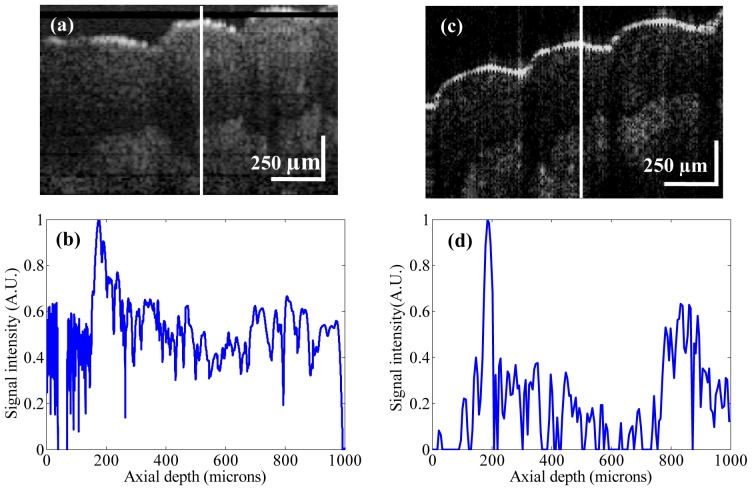
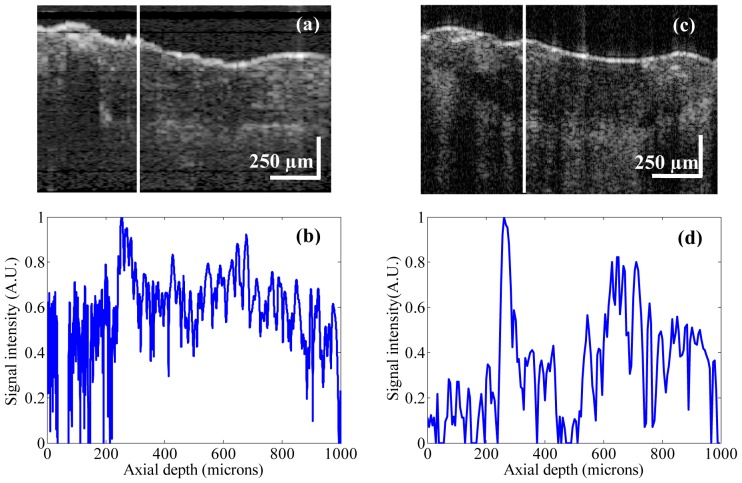
Figure 8(a) shows an MR-OCT image of a fingertip with dimension ~[1 mm (z) × 1.5 mm (x)]. The morphology of several layers like the stratum corneum, the epidermis and the dermis are clearly demarcated. Further, we imaged the fingertip with a commercial research grade SS-OCT system (model OCT1300SS, Thorlabs Inc. USA). This system operated at a center wavelength of 1325 nm and supported a maximum imaging depth range of about 3 mm. The axial scanning rate was 16 kHz, which provided a transverse and axial imaging resolution of ~10 μm and ~12 μm respectively, in air. In order to compare the results between these two systems, we took an A-scan plot of a fingertip (shown as a white line over the image in Fig. 8(a), 8(c)). Figure 8(b) shows the A-scan profile of a fingertip using the MR-OCT system and Fig. 8(d) depicts the A-scan profile of a fingertip using the SS-OCT system. The measured dermal to epidermal junction thickness using the MR-OCT system was ~540 μm, which compared well with the measurement by the SS-OCT system (~550 μm). It should be pointed out that the depicted B-frames had a slight variation in sample positions. The SS-OCT images had the background subtracted, while the MR-OCT frame shows an image without background subtraction. Also, the spatial resolution may be slightly different between the SS-OCT and MR-OCT images. However, even with such a coarse comparison the quality of the MR-OCT image enables measurements of dermal to epidermal thickness that match those of the SS-OCT system.
Fig. 8.
(a) MR-OCT cross section image of a fingertip with dimension ~[1 mm (z) × 1.5 mm (x)]. (b) Cross-sectional A-scan profile of a fingertip using the MR-OCT system. (c) SS-OCT cross section image of a fingertip with dimension ~[1 mm (z) × 1.5 mm (x)]. (d) Cross-sectional A-scan profile of a fingertip using the SS-OCT system. The measured dermal to epidermal junction thickness using MR-OCT system was ~540 μm, which compared well with the measurement by the SS-OCT system (~550 μm).
3.4 In-vivo imaging of a burn wound with the MR-OCT system
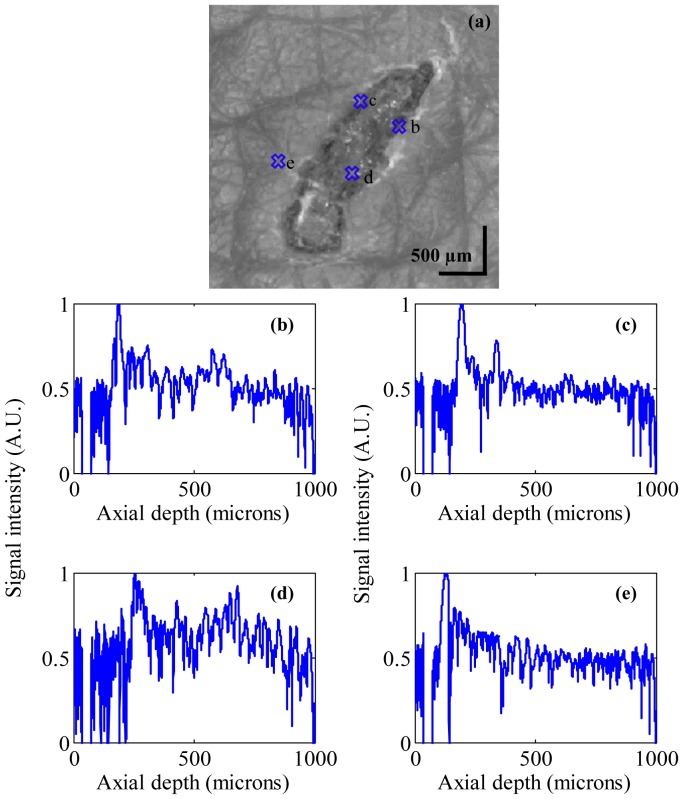
Burns are common injuries caused by heat, chemicals, electricity etc. The severity of these injuries can assessed using imaging technologies. Determination of accurate burn depth is a key parameter for a clinician to evaluate the burn wounds. Studies have shown detailed quantification of wound healing using OCT [e.g 25.]. We used the MR-OCT system to analyze a second degree burn caused by heat in the forearm region. Figure 9(a) shows the dermascope image of wound area with a dimension of 3 × 3 mm. Figure 9(b)-9(e) shows the MR-OCT A-scan plot of the wound site taken at different regions of interest marked as b-e in Fig. 9(a). Figure 9(e) show the A-scan plots taken from healthy tissue, while Figs. 9(b)-9(d) show the A-scan plots from the burn region.
Fig. 9.
(a) Dermascope image of a wound near forearm region. (b-e) shows the MR-OCT A-scans of a wound region recorded in vivo at different region of interest marked as b-e in (a). The signal peaks in (b-d) shows the optical reflections from wound area representing burnt region whereas (e) represents the reflection from a healthy region.
Figure 10(a) shows the MR-OCT image of a superficial burn with dimensions ~[1 mm (z) × 1.5 mm (x)]. The morphology of the wound was clearly demarcated with MR-OCT. In order to compare results between MR-OCT and SS-OCT systems, we took an A-scan plot of the wound (shown as line over image in Fig. 10(a), 10(c)). Figure 10(b) shows the A-scan profile of the wound using MR-OCT system and Fig. 10(c) depicts the A-scan profile of the wound using SS-OCT. The measured burn depth using the MR-OCT system was ~650 μm, which compared well with the measurement by the SS-OCT system.
Fig. 10.
(a) MR-OCT cross section image of a wound near the forearm region with dimensions ~[1 mm (z) × 1.5 mm (x)]. (b) A-scan profile of a wound using the MR-OCT system. (c) SS-OCT cross section image of a wound with dimension ~[1 mm (z) × 1.5 mm (x)]. (d) A-scan profile of a wound using the SS-OCT system. The measured burn depth using the MR-OCT system was ~650 μm, which compared well with the measurement by the SS-OCT system.
4. Conclusion
We have developed and demonstrated the feasibility of our MR-OCT system for dermal imaging applications by incorporating a dermascope, which provides simultaneous imaging of the dermis and also acts as an interactive tool for beam steering and for the registration of the OCT imaging beam at the dermis area. This allows the user to interactively investigate the depth resolved information of any target position of interest on the dermis by pointing the mouse cursor within the dermis image.
The feasibility of the system was demonstrated using in vivo imaging of a fingertip and burn wound clearly showing the ability to distinguish between the differing structures. The measured thickness using the MR-OCT system was in good agreement with the measurement taken by a commercially available SS-OCT system. These results indicated that MR-OCT could become a powerful new tool for clinical applications. The optical interferometric part of the MR-OCT system described herein could be implemented as a very small device (comparable in size and complexity to the optical pick up unit of a DVD player) at a small fraction of the cost of conventional OCT systems with moderate axial scan rate and performance.
Acknowledgments
We would like to thank Sean O’Gorman for his generous help with the experiment. This work was supported by Galway University Foundation, the University of Limerick Foundation, the National Biophotonics Imaging Platform (NBIP) Ireland funded under the Higher Education Authority PRTLI Cycle 4, co-funded by the Irish Government and the European Union – Investing in your future, and Compact Imaging, Inc. All authors have a financial interest in Compact Imaging, Inc.
References and links
- 1.Feng S., Caire R., Cortazar B., Turan M., Wong A., Ozcan A., “Immunochromatographic diagnostic test analysis using Google Glass,” ACS Nano 8(3), 3069–3079 (2014). 10.1021/nn500614k [DOI] [PMC free article] [PubMed] [Google Scholar]
- 2.Jonathan E., Leahy M. J., “Investigating a smartphone imaging unit for photoplethysmography,” Physiol. Meas. 31(11), N79–N83 (2010). 10.1088/0967-3334/31/11/N01 [DOI] [PubMed] [Google Scholar]
- 3.Bennett J., “Top Ten Medical Uses of the iPhone”, http://internetmedicine.com/2012/12/14/top-ten-medical-uses-of-the-iphone/, Accessed: 12th December (2013).
- 4.Braun R. P., Saurat J. H., French L. E., “Dermoscopy of pigmented lesions: a valuable tool in the diagnosis of melanoma,” Swiss Med. Wkly. 134(7-8), 83–90 (2004). [DOI] [PubMed] [Google Scholar]
- 5.Braun R. P., Rabinovitz H. S., Oliviero M., Kopf A. W., Saurat J. H., “Dermoscopy of pigmented skin lesions,” J. Am. Acad. Dermatol. 52(1), 109–121 (2005). 10.1016/j.jaad.2001.11.001 [DOI] [PubMed] [Google Scholar]
- 6.Lallas A., Argenziano G., Apalla Z., Gourhant J. Y., Zaballos P., Di Lernia V., Moscarella E., Longo C., Zalaudek I., “Dermoscopic patterns of common facial inflammatory skin diseases,” J. Eur. Acad. Dermatol. Venereol. 28(5), 609–614 (2014). 10.1111/jdv.12146 [DOI] [PubMed] [Google Scholar]
- 7.Lallas A., Kyrgidis A., Tzellos T. G., Apalla Z., Karakyriou E., Karatolias A., Lefaki I., Sotiriou E., Ioannides D., Argenziano G., Zalaudek I., “Accuracy of dermoscopic criteria for the diagnosis of psoriasis, dermatitis, lichen planus and pityriasis rosea,” Br. J. Dermatol. 166(6), 1198–1205 (2012). 10.1111/j.1365-2133.2012.10868.x [DOI] [PubMed] [Google Scholar]
- 8.Peris K., Micantonio T., Piccolo D., Fargnoli M. C., “Dermoscopic features of actinic keratosis,” J. Dtsch. Dermatol. Ges. 5(11), 970–975 (2007). 10.1111/j.1610-0387.2007.06318.x [DOI] [PubMed] [Google Scholar]
- 9.Fercher A. F., Drexler W., Hitzenberger C. K., Lasser T., “Optical coherence tomography - principles and applications,” Rep. Prog. Phys. 66(2), 239–303 (2003). 10.1088/0034-4885/66/2/204 [DOI] [Google Scholar]
- 10.Leitgeb R., Hitzenberger C., Fercher A., “Performance of fourier domain vs. time domain optical coherence tomography,” Opt. Express 11(8), 889–894 (2003). 10.1364/OE.11.000889 [DOI] [PubMed] [Google Scholar]
- 11.Choma M., Sarunic M., Yang C., Izatt J., “Sensitivity advantage of swept source and Fourier domain optical coherence tomography,” Opt. Express 11(18), 2183–2189 (2003). 10.1364/OE.11.002183 [DOI] [PubMed] [Google Scholar]
- 12.Nguyen V. D., Weiss N., Beeker W., Hoekman M., Leinse A., Heideman R. G., van Leeuwen T. G., Kalkman J., “Integrated-optics-based swept-source optical coherence tomography,” Opt. Lett. 37(23), 4820–4822 (2012). 10.1364/OL.37.004820 [DOI] [PubMed] [Google Scholar]
- 13.Akca B. I., Považay B., Alex A., Wörhoff K., de Ridder R. M., Drexler W., Pollnau M., “Miniature spectrometer and beam splitter for an optical coherence tomography on a silicon chip,” Opt. Express 21(14), 16648–16656 (2013). 10.1364/OE.21.016648 [DOI] [PubMed] [Google Scholar]
- 14.Pennings E., Khoe G. D., Smit M. K., Staring T., “Integrated-optic versus microoptic devices for fiber-optic telecommunications systems: A comparison,” IEEE J. Sel. Top. Quantum Electron. 2(2), 151–164 (1996). 10.1109/2944.577349 [DOI] [Google Scholar]
- 15.Nguyen V. D., Akca B. I., Wörhoff K., de Ridder R. M., Pollnau M., van Leeuwen T. G., Kalkman J., “Spectral domain optical coherence tomography imaging with an integrated optics spectrometer,” Opt. Lett. 36(7), 1293–1295 (2011). 10.1364/OL.36.001293 [DOI] [PubMed] [Google Scholar]
- 16.Insight, “Small (and shrinking) Form Factor”, http://sweptlaser.com/small-form-factor/, Accessed: 10th July (2014).
- 17.Hogan J., “Multiple-Reference Non-Invasive Analysis System,” U. S. Patent 7,526,329 (28th April2009).
- 18.Hogan J., “Frequency Resolved Imaging System”, U.S. Patent 7,751,862 (6th July2010).
- 19.Podoleanu A. G., Dobre G. M., Webb D. J., Jackson D. A., “Simultaneous en-face imaging of two layers in the human retina by low-coherence reflectometry,” Opt. Lett. 22(13), 1039–1041 (1997). 10.1364/OL.22.001039 [DOI] [PubMed] [Google Scholar]
- 20.Zurauskas M., Rogers J., Podoleanu A. G., “Simultaneous multiple-depths en-face optical coherence tomography using multiple signal excitation of acousto-optic deflectors,” Opt. Express 21(2), 1925–1936 (2013). 10.1364/OE.21.001925 [DOI] [PubMed] [Google Scholar]
- 21.Nano optic devices, “Expanding light possibilities”, http://www.nanoopticdevices.com/, Accessed: 11th July (2014).
- 22.Tornado spectral systems, “Spectrometer-on-chip for OCT”,http://tornado-spectral.com/solutions/spectrometer-on-chip-oct, Accessed: 11th July (2014).
- 23.Kasukurti A., Potcoava M., Desai S. A., Eggleton C., Marr D. W. M., “Single-cell isolation using a DVD optical pickup,” Opt. Express 19(11), 10377–10386 (2011). 10.1364/OE.19.010377 [DOI] [PMC free article] [PubMed] [Google Scholar]
- 24.Popescu D. P., Choo-Smith L.-P., Flueraru C., Mao Y., Chang S., Disano J., Sherif S., Sowa M. G., “Optical coherence tomography: fundamental principles, instrumental designs and biomedical applications,” Biophys. Rev. 3(3), 155–169 (2011). 10.1007/s12551-011-0054-7 [DOI] [PMC free article] [PubMed] [Google Scholar]
- 25.Kim K. H., Pierce M. C., Maguluri G., Park B. H., Yoon S. J., Lydon M., Sheridan R., de Boer J. F., “In vivo imaging of human burn injuries with polarization-sensitive optical coherence tomography,” J. Biomed. Opt. 17(6), 066012 (2012). 10.1117/1.JBO.17.6.066012 [DOI] [PubMed] [Google Scholar]


