Abstract
We developed a multimodal nonlinear optical microscopy imaging (e.g., third-harmonic generation (THG) and two-photon excited fluorescence (TPEF)) platform based on a femtosecond laser pumped photonic crystal fiber to investigate the acetowhitening phenomenon induced by acetic acid in live mammalian cells without labeling. After treated by acetic acid with concentrations of higher than 0.2%, THG images show that light scattering is remarkably increased inside the nucleus and cytoplasm in cells. Co-localized TPEF and THG imaging on tryptophan and NADH in cells indicates that the change of scattering property is largely originating from the morphological change of metabolic proteins induced by acetic acids. Further TPEF imaging on NADH and FAD in cells confirms that this change is irreversible when acetic acid concentration is higher than 1.2%. These subcellular-level THG/TPEF imaging results reveal that the acetowhitening phenomenon is highly related with proteins involved in metabolic pathways in the nucleus and cytoplasm in live cells.
OCIS codes: (190.0190) Nonlinear optics, (180.0180) Microscopy
1. Introduction
Tissue acetowhitening effect in acetic acid instillation procedure is a simple and economic method for neoplasia detection and has been clinically utilized since 1925 [1]. The acetowhitening effect is widely utilized during colposcopy for enhancing disparities of the optical property (e.g. scattering) between the intraepithelial neoplastic lesion and the non-neoplastic tissues [2]. In recent years, the acetowhitening effect has been applied for preneoplasia and early neoplasia detection during gastroscopic inspection in the upper gastrointestinal tract, and has achieved promising diagnostic sensitivity and specificity of approximate 95.0% and 100.0%, respectively [3, 4]. Some research work has been carried out to study the tissue acetowhitening process [5–8]; however, the fundamental epithelium kinetic mechanism involved in the acetowhitening process at the subcellular level remains largely elusive. Hence, it is highly desirable to develop an advanced optical imaging technique for investigating acetowhitening effect in tissue and cells with high spatial resolution without labeling.
Nonlinear optical microscopy is a label-free imaging technique that has attracted much attention for biomedical imaging due to its biochemical selectivity and optical sectioning ability at sub-micron resolution. For example, third-harmonic generation (THG) signal can only be generated in regions with optical heterogeneities (i.e., third-order nonlinear susceptibility, refractive index and dispersion) inside biological samples [9] that is suited for mapping the subcellular origin of light scattering in cells and tissue; Two-photon excited fluorescence (TPEF) imaging of tryptophan excels in providing protein information [10]; while TPEF microscopy of NADH can effectively probe proteins (enzymes) associated with metabolic activities [10]. Concomitant TPEF imaging of these endogenous biochemicals can elucidate proteostasis in cells (i.e., transient aggregation of ubiquitinated proteins and etc.) [11]. Although the optical properties (e.g., scattering) change was assumed to be related to the coagulation of intracellular proteins during acetowhitening process in cells [12], no experimental proofs have been reported yet. To reveal the exact cellular components responsible for the acetowhitening effect at the sub-cellular level, in this study, we develop a multimodal nonlinear optical microscopy platform based on a femtosecond laser pumped photonic crystal fiber to systematically investigate the mechanistic details of acetowhitening phenomenon at the sub-cellular and molecular levels in living mammalian cells using THG and TPEF imaging without labeling. Human cervical squamous carcinoma cell lines (SiHa) were specifically employed as the mammalian cellular model for studying the acetic acid induced epithelial tissue acetowhitening effect.
2. Materials and methods
2.1. Multimodal nonlinear optical microscopy imaging system
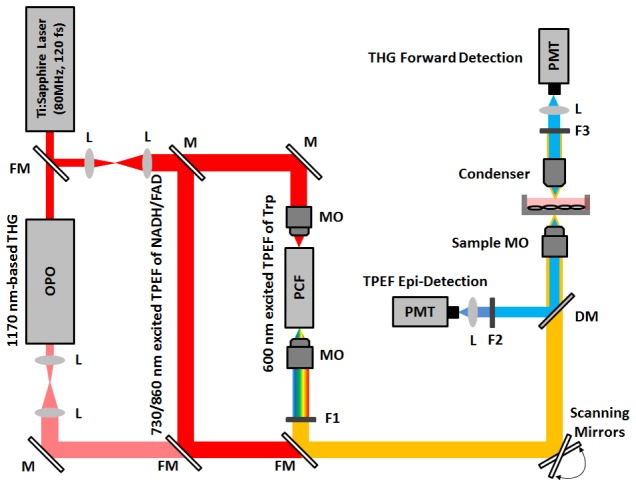
Figure 1 shows the schematic of the multimodal nonlinear optical microscopy imaging (e.g., THG/TPEF) system developed for label-free imaging of live cells. A 120-femtosecond (fs) Ti:sapphire laser (Mira 900, Coherent Inc.) was tuned to 730 and 860 nm to correspondingly excite TPEF of NADH and FAD, and adjusted to 800 and 835 nm to act as a pump source for photonic crystal fiber (PCF) (Femtowhite CARS, Newport) and optical parametric oscillator (OPO, Mira, Coherent Inc.), respectively. The supercontinuum generated from the PCF was filtered (FF01-600/37, Semrock) for optimal TPEF excitation of tryptophan; while the output at 1170 nm from the OPO was employed for THG imaging. With the use of flip mirrors, different excitation wavelengths can be separately generated and uniquely delivered to a pair of galvanometer scanning mirrors, and subsequently focused onto the sample through a water immersion microscope objective (UPlanSApo 60x, N.A. 1.2, Olympus) for high contrast cellular THG/TPEF imaging. The generated TPEF signal at the backward (epi-) direction was reflected by a dichroic mirror (FF580-FDi01, Semrock) and filtered by different filters for different excitation wavelengths (730 nm excitation: FF01-650SP and FF01-460/60, Semrock; 860 nm excitation; FF01-750SP and FF01-540/40, Semrock; 600 nm excitation: SP01-532RU and FF01-355/40, Semrock), and then detected by a photomultiplier tube (PMT) (R3896, Hamamatsu). The forward propagating THG signal was collected by a condenser (U-TLD, NA 0.9, Olympus) and filtered (FF01-650SP FF01-390/40, Semrock) before being detected by a PMT (R3896, Hamamatsu). Note the maximum powers used on the biological samples for TPEF of NADH, FAD, tryptophan, and THG were 3, 4, 2, and 15 mW, respectively.
Fig. 1.
Schematic diagram of the multimodal nonlinear optical imaging (TPEF/THG) platform for label-free imaging of live cells. FM, flip mirror; L, lens; M, mirrors; OPO, optical parametric oscillator; MO, microscope objective; PCF, photonic crystal fiber; F1, filter set 1 (600 ± 20nm bandpass filter); F2, filter set 2 (730 nm excitation: 650 nm shortpass, 460 ± 30nm bandpass filter; 860 nm excitation: 750 nm shortpass, 540 ± 20nm bandpass filter; 600 nm excitation: 532 nm shortpass, 355 ± 20nm bandpass filter); F3, filter set 3 (650 nm shortpass filter, 390 ± 20nm bandpass filter); DM, dichroic mirror; PMT, photomultiplier tube.
2.2 Sample preparation
Human cervical squamous cell carcinoma (SiHa) cells (American Type Cell Collection, VA) were brought up from cryopreservation and cultured at 37°C in a 5% CO2 humidified incubator. Before the experiment, the cells at density of approximately 1 x 10⁶ cells were placed in lysine coated petri dishes with cover glass bottom (size, 35 mm; P35G-0-41-C, MatTek, Ashland, MA), and immersed in Dulbecco’s modified Eagle’s medium (Gibco, Invitrogen) supplemented with 10% fetal bovine serum (Gibco, Invitrogen) and 1% penicillin/streptomycin (Gibco, Invitrogen).
2.3. Acetic acid-perturbation study
To investigate cellular acetowhitening process, acetic acid treatment and washout procedures on the 35 mm-diameter size petri dishes were carried out. For the acetic acid treatment procedure, the original growth medium was replaced with the growth medium containing acetic acid with seven different concentrations varying from 0.0% to 3.0% with pH values from 7.52 to 3.22. THG/TPEF microscopy imaging of cells was carried out after 5 minutes of acetic acid-growth medium immersion [6]. In the acetic acid washout procedure, before the THG/TPEF imaging, cells were immersed in the acetic acid-growth medium for 5 minutes, and then immersed in a fresh growth medium for another 5 minutes. We measured cells cultured in 35 petri dishes.
3. Results and discussions
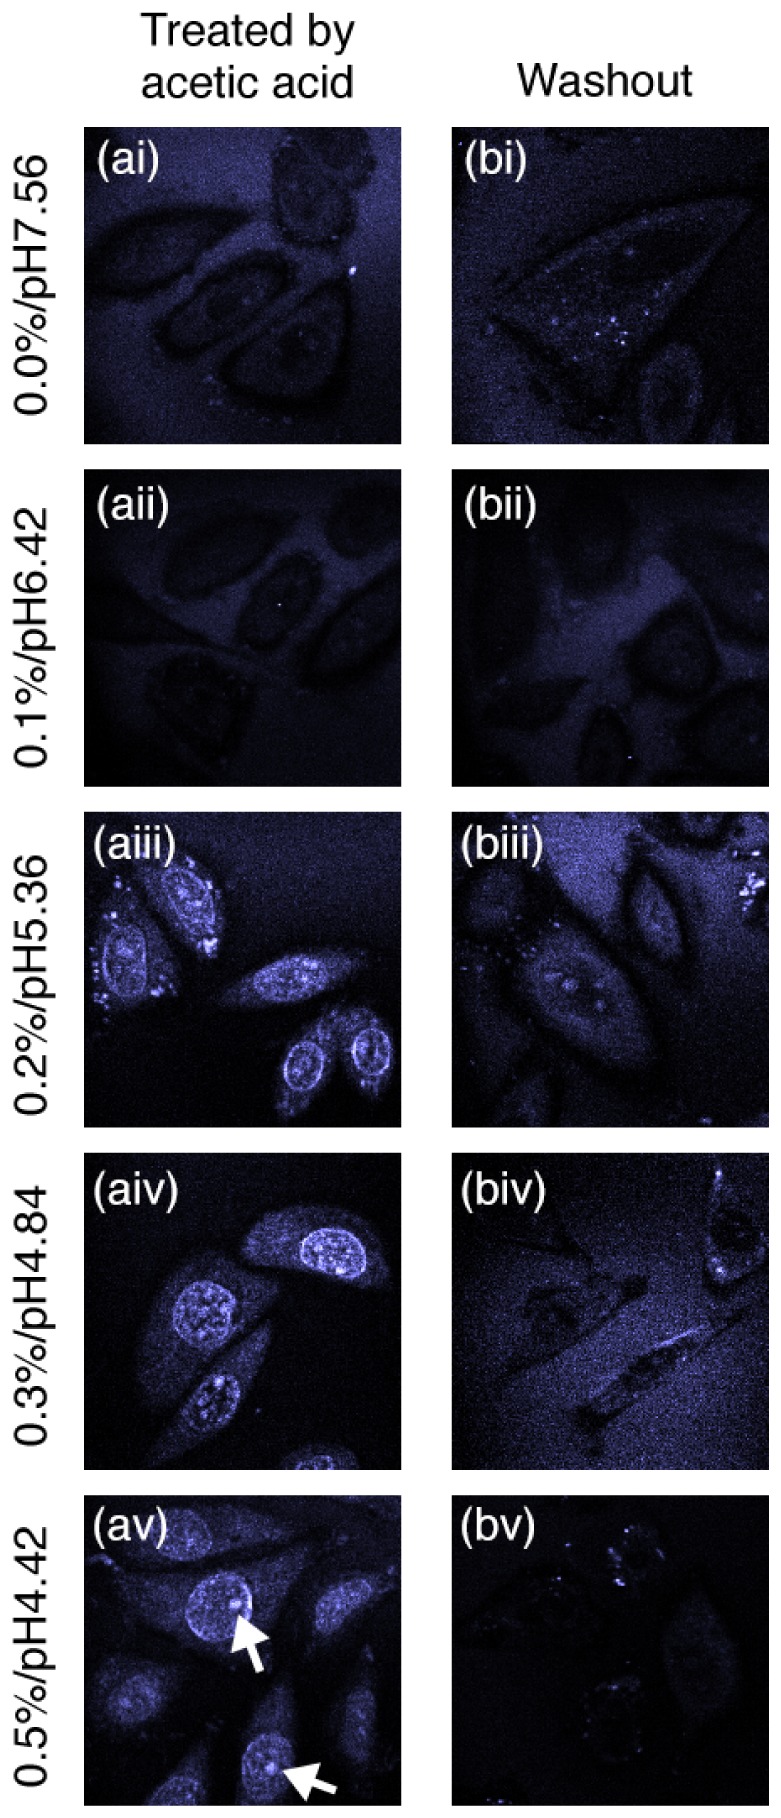
Figure 2 compares the THG images between live mammalian cells treated by acetic acid with different concentrations and those under washout conditions. The mammalian cells under 0.0 and 0.1% acetic acid treatment (Fig. 2(ai), 2(aii)) and washout condition (Fig. 2(bi), 2(bii)) have similar homogenous optical properties indicated by the weak THG signals. Cells treated by acetic acid with 0.2% or higher concentrations show strong THG signals from the nucleus as well as some weak signals from the cytoplasm (Fig. 2(aiii)-2(av)). It is also observed that the signal from nucleolus is most prominent (indicated by arrows in Fig. 2(av)). The enhanced THG signals due to acetic acid treatment disappear in the cells under washout conditions (Fig. 2(biii)-2(bv)). The results indicate that acetic acid with 0.2% or higher concentrations induces significant optical scatterings within the nucleus and especially in the nucleolus, which could be due to the result of refractive index increase in these regions [13, 14]; and the change of cell scattering properties is reversible by the wash of fresh culture medium. The observed concentration threshold is in agreement with other’s report on light reflectance and scattering spectroscopy of cells in acetowhitening effect [6, 7], and also consistent with the clinical observation of epithelial tissue acetowhitening phenomenon [1–5].
Fig. 2.

Exemplary label-free images based on third-harmonic generation (THG) signals arising from live mammalian cells in monolayer culture after (a) 5-minutes acetic acid treatment, and (b) 5-minute acetic acid treatment followed by 5-minute washout using fresh culture medium. Images labeled with (i) to (v) are taken at different acetic acid concentrations from 0% to 0.5% (pH values from 7.56 to 4.42) for treatment and washout conditions. All images are reconstructed from raw data without any processing, and image sizes are 60 μm × 60 μm.
To identify which kind of biochemicals is affected by acetic acid and contributes to the scattering property change in cells, we compare co-localized THG and TPEF images of tryptophan and NADH in cells between the untreated and 0.3% acetic acid treated conditions (Fig. 3). It can be seen that with 0.3% acetic acid treatment, the cell nuclei show a stronger THG signal (Fig. 3(aii)) as compared to the untreated cells (Fig. 3(ai)); while tryptophan and NADH TPEF signals are also stronger inside the nuclei (Figs. 3(bii) and 3(cii)) compared with those of untreated cells (Figs. 3(bi) and 3(ci)). Moreover, the images of all three modalities become strikingly similar. As TPEF imaging of tryptophan excels in providing proteins information [10]; while TPEF imaging of NADH can effectively probe proteins (enzymes) associated with metabolic activity [10], the TPEF images indicate that acetic acid induces coagulation of metabolic proteins inside cells, especially inside the nuclei; and the high resemblance of tryptophan and NADH images to the THG image after acetic acid treatment indicates that the metabolic proteins are responsible for the scattering property changes of cells in the acetowhitening process.
Fig. 3.
THG image (a), TPEF of tryptophan (b) and NADH (c) images taken from live mammalian cells before and after 5-minute treatment by acetic acid with 0.3% (pH value 4.84) concentration. Image sizes are 100 μm × 100 μm.
To study the relationship between spatial distribution changes of metabolic proteins with respect to the concentration of acetic acid used to treat cells, TPEF images of NADH and FAD were taken at different acetic acid concentrations. Figure 4 shows the representative TPEF images of NADH and FAD in live mammalian cells treated by acetic acid with different concentrations and also in those under washout conditions. Obviously, the TPEF images demonstrate significant spatial distribution changes of metabolic proteins in cells treated by acetic acid with 0.3 and 1.2% concentrations (Figs. 4(aii), 4(bii), 4(aiii), and 4(biii)) compared with those in untreated cells (Figs. 4(ai) and 4(bi)). On the other hand, the images under washout conditions show that the spatial distribution changes of metabolic proteins are reversible in cells treated by acetic acid with 0.3% concentration (Fig. 4(cii), 4(dii)) but not in cells treated by acetic acid with 1.2% concentration (Fig. 4(ciii), 4(diii)). The TPEF imaging result indicates that cellular changes induced by acetic acid become permanent at high acetic acid concentrations from approximately 1.2%, which is consistent with other’s report [6].
Fig. 4.

Representative normalized cellular TPEF images of NADH and FAD taken (a, b) after 5-minute acetic acid treatments, and (c, d) after 5-minute acetic acid treatment followed by 5-minute washout. Images labeled with (i) to (iii) are taken at different acetic acid concentrations from 0% to 1.2% (pH 7.56 - 3.86) for treatment and washout conditions, respectively. Note the excitation power used on the samples was less than 5 mW, and a total integration time of 60s per image was used. Image sizes are 50 μm x 50 μm.
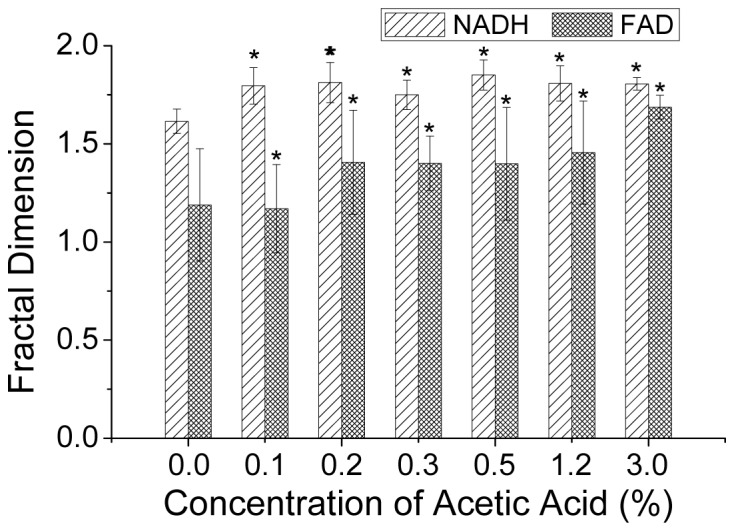
To quantify the spatial distribution changes of metabolic proteins in cells treated by acetic acid with different concentrations, NADH and FAD TPEF images are analyzed using fractal dimension analysis [15]. The analysis data are shown in Fig. 5. It can be observed that after cells being treated by acetic acid with 0.2% or higher concentrations, the fractal dimensions significantly increases (p<0.05, Wilcoxon matched pairs test), especially for FAD. The fractal dimensional analysis result affirms that the spatial distributions of metabolic proteins are considerably perturbed during the cellular acetowhitening process.
Fig. 5.

Fractal dimensional analysis results of co-localized NADH and FAD TPEF images at baseline and 5-minute acetic acid treatment conditions. Note: Values are presented as mean ± 1 standard deviation (SD); 5 replicates are used during each acetic acid concentration testing; * denotes p<0.05 according to Wilcoxon matched pairs test.
5. Conclusion
In this work, we developed a multimodal nonlinear optical microscopy (THG/TPEF) platform to study the acetowhitening process induced by acetic acid in live mammalian cells at the subcellular level without labeling. THG microscopy elucidated the threshold effect of approximately 0.2% acetic acid concentration to induce acetowhitening process in the cytoplasm and nucleus. Additionally, the integrated THG/TPEF imaging of tryptophan and NADH in mammalian cell reveals that the increased light scattering property during the acetowhitening process in cells is highly associated with metabolic proteins coagulation induced by the acetic acid. TPEF imaging on NADH and FAD confirms that the resulting morphological change becomes permanent when the concentration of acetic acid is higher than 1.2%. Further fractal dimension quantitative analysis of TPEF images on NADH and FAD affirms that the significant light scattering changes are due to proteins perturbations involved with metabolism by acetic acid with 0.2% and higher concentrations. This study suggests that the acetowhitening phenomenon is highly related with proteins involved in metabolic pathways in the nucleus and cytoplasm in live cells.
Acknowledgment
This work was supported by the National Research Foundation–Proof-of-Concept (NRF-POC), the Academic Research Fund (AcRF)-Tier2 from the Ministry of Education (MOE), and the National Medical Research Council (NMRC), Singapore.
References and links
- 1.Hinselmann H., Verbesserung der Inspektions-moeglichkeiten von Vulva, and Vagina und Portio, (Munch. Med. Wschr., 1925). [Google Scholar]
- 2.Balas C. J., Themelis G. C., Prokopakis E. P., Orfanudaki I., Koumantakis E., Helidonis E. S., “In vivo detection and staging of epithelial dysplasias and malignancies based on the quantitative assessment of acetic acid-tissue interaction kinetics,” J. Photochem. Photobiol. B 53(1-3), 153–157 (1999). 10.1016/S1011-1344(99)00133-5 [DOI] [PubMed] [Google Scholar]
- 3.Guelrud M., Herrera I., “Acetic acid improves identification of remnant islands of Barrett’s epithelium after endoscopic therapy,” Gastrointest. Endosc. 47(6), 512–515 (1998). 10.1016/S0016-5107(98)70253-6 [DOI] [PubMed] [Google Scholar]
- 4.Yagi K., Aruga Y., Nakamura A., Sekine A., Umezu H., “The study of dynamic chemical magnifying endoscopy in gastric neoplasia,” Gastrointest. Endosc. 62(6), 963–969 (2005). 10.1016/j.gie.2005.08.050 [DOI] [PubMed] [Google Scholar]
- 5.Lambert R., Rey J. F., Sankaranarayanan R., “Magnification and chromoscopy with the acetic acid test,” Endoscopy 35(5), 437–445 (2003). 10.1055/s-2003-38766 [DOI] [PubMed] [Google Scholar]
- 6.Wu T. T., Qu J., Cheung T. H., Yim S. F., Wong Y. F., “Study of dynamic process of acetic acid induced-whitening in epithelial tissues at cellular level,” Opt. Express 13(13), 4963–4973 (2005). 10.1364/OPEX.13.004963 [DOI] [PubMed] [Google Scholar]
- 7.Wu T. T., Qu J. Y., “Assessment of the relative contribution of cellular components to the acetowhitening effect in cell cultures and suspensions using elastic light-scattering spectroscopy,” Appl. Opt. 46(21), 4834–4842 (2007). 10.1364/AO.46.004834 [DOI] [PubMed] [Google Scholar]
- 8.Wu T. T., Cheung T. H., Yim S. F., Qu J. Y., “Clinical study of quantitative diagnosis of early cervical cancer based on the classification of acetowhitening kinetics,” J. Biomed. Opt. 15(2), 026001 (2010). 10.1117/1.3365940 [DOI] [PubMed] [Google Scholar]
- 9.Débarre D., Beaurepaire E., “Quantitative characterization of biological liquids for third-harmonic generation microscopy,” Biophys. J. 92(2), 603–612 (2007). 10.1529/biophysj.106.094946 [DOI] [PMC free article] [PubMed] [Google Scholar]
- 10.Teh S. K., Zheng W., Li S., Li D., Zeng Y., Yang Y., Qu J. Y., “Multimodal nonlinear optical microscopy improves the accuracy of early diagnosis of squamous intraepithelial neoplasia,” J. Biomed. Opt. 18(3), 036001 (2013). 10.1117/1.JBO.18.3.036001 [DOI] [PubMed] [Google Scholar]
- 11.Liu X. D., Ko S., Xu Y., Fattah E. A., Xiang Q., Jagannath C., Ishii T., Komatsu M., Eissa N. T., “Transient aggregation of ubiquitinated proteins is a cytosolic unfolded protein response to inflammation and endoplasmic reticulum stress,” J. Biol. Chem. 287(23), 19687–19698 (2012). 10.1074/jbc.M112.350934 [DOI] [PMC free article] [PubMed] [Google Scholar]
- 12.Denny L., Quinn M., Sankaranarayanan R., “Chapter 8: Screening for cervical cancer in developing countries,” Vaccine 24(Suppl 3), 71–77 (2006). 10.1016/j.vaccine.2006.05.121 [DOI] [PubMed] [Google Scholar]
- 13.Choi W., Fang-Yen C., Badizadegan K., Oh S., Lue N., Dasari R. R., Feld M. S., “Tomographic phase microscopy,” Nat. Methods 4(9), 717–719 (2007). 10.1038/nmeth1078 [DOI] [PubMed] [Google Scholar]
- 14.Collier T., Shen P., de Pradier B., Sung K. B., Richards-Kortum R., Follen M., Malpica A., “Near real time confocal microscopy of amelanotic tissue: dynamics of aceto-whitening enable nuclear segmentation,” Opt. Express 6(2), 40–48 (2000). 10.1364/OE.6.000040 [DOI] [PubMed] [Google Scholar]
- 15.West G. B., Brown J. H., Enquist B. J., “The fourth dimension of life: fractal geometry and allometric scaling of organisms,” Science 284(5420), 1677–1679 (1999). 10.1126/science.284.5420.1677 [DOI] [PubMed] [Google Scholar]


