Abstract
The mechanisms by which physical forces regulate endothelial cells to determine the complexities of vascular structure and function are enigmatic1-5. Studies of sensory neurons have suggested Piezo proteins as subunits of Ca2+-permeable non-selective cationic channels for detection of noxious mechanical impact6-8. Here we show Piezo1 (FAM38A) channels as sensors of frictional force (shear stress) and determinants of vascular structure in both development and adult physiology. Global or endothelial-specific disruption of mouse Piezo1 profoundly disturbed the developing vasculature and was embryonic lethal within days of the heart beating. Haploinsufficiency was not lethal but endothelial abnormality was detected in mature vessels. Importance of Piezo1 channels as sensors of blood flow was shown by Piezo1 dependence of shear stress-evoked ionic current and calcium influx in endothelial cells and the ability of exogenous Piezo1 to confer sensitivity to shear stress on otherwise resistant cells. Downstream of this calcium influx was protease activity and spatial organization of endothelial cells to the polarity of the applied force. The data suggest Piezo1 channels as pivotal integrators in vascular biology.
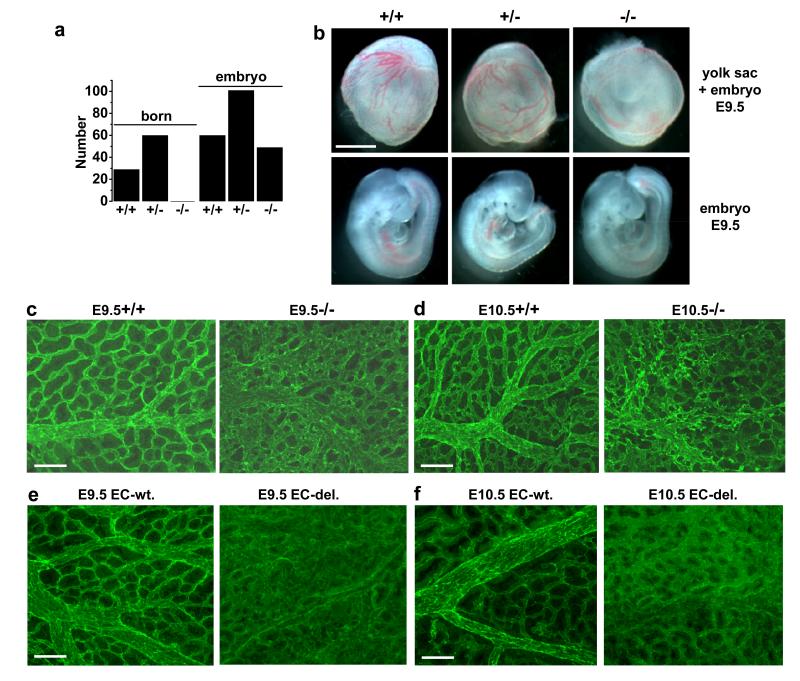
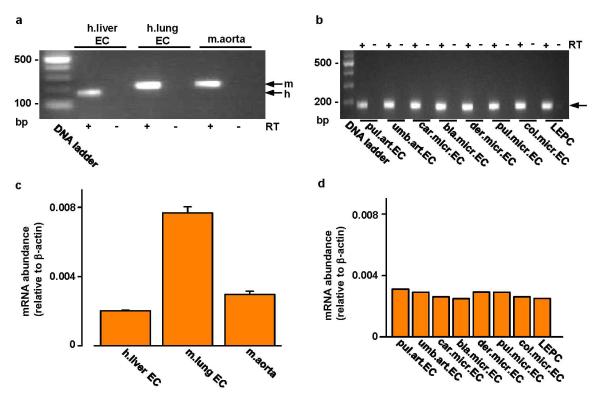
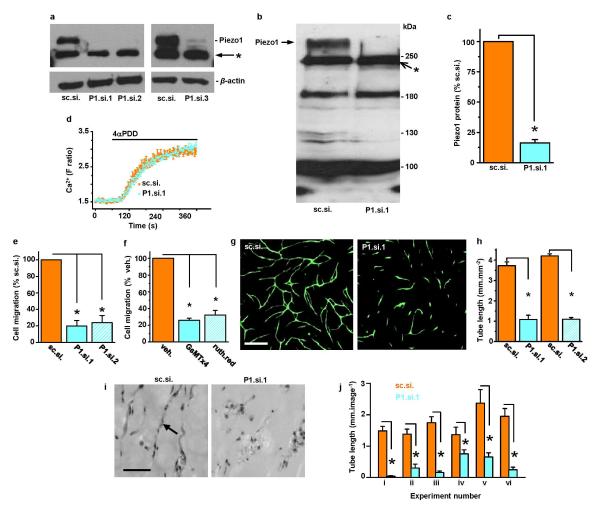
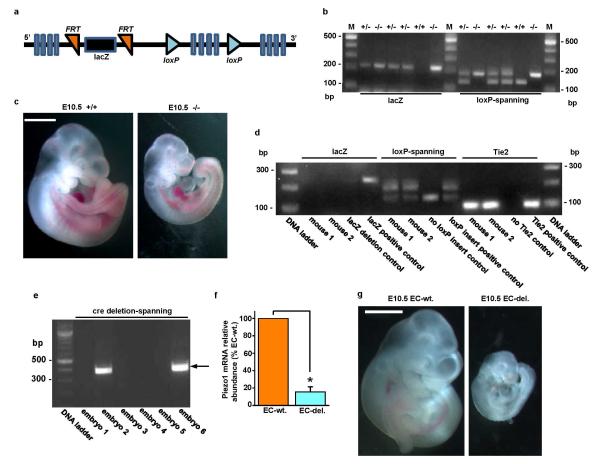
Messenger RNA encoding Piezo1 was readily detected in mouse aorta and a variety of human endothelial cells (Extended Data Fig. 1). To gain insight into its significance we first investigated cultured human umbilical vein endothelial cells (HUVECs). Depletion of Piezo1 by either of two short interfering RNAs (siRNAs) strongly suppressed migration of these cells towards vascular endothelial growth factor (VEGF) (Extended Data Fig. 2a-e), a key stimulant of angiogenesis in vivo9. There was similar inhibitory effect of a spider toxin blocker of Piezo1 channels, GsMTx410, and a non-specific small-molecule blocker, ruthenium red6 (Extended Data Fig. 2f). Consistent with a relationship to endothelial cell migration, HUVEC tube formations in vitro and in vivo were suppressed by Piezo1 depletion (Extended Data Fig. 2g-j). We therefore generated mice with disrupted endogenous Piezo1 gene (Extended Data Fig. 3a, b). Piezo1+/− progeny appeared normal but Piezo1−/− was embryonic lethal (Fig 1a). Of 49 Piezo1−/− embryos the longest survival time was E16.5 and most were only E9.5-11.5, which is a critical time for vascular development9. At E10.5, growth retardation was commonly observed (Extended Data Fig. 3c). At E9.5, embryos were often normal in size but yolk sac vasculature was less prominent (Fig 1b). While endothelial cells were present in yolk sacs of Piezo1+/+ and Piezo1−/− embryos the structures were different, with greater disorganization and fewer defined large vessels in Piezo1−/− (Fig 1c). Similar observations were made at E10.5 (Fig 1d). The data suggest Piezo1 as a protein of critical importance in the control of vascular architecture and embryonic development.
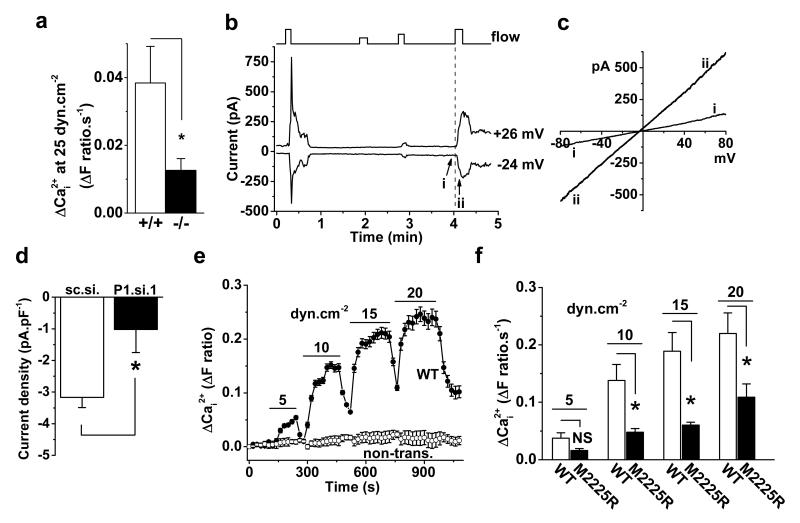
Figure 2. Piezo1 in shear stress sensing.
a, Ca2+ elevation evoked in endothelial cells from Piezo1+/+ (n=6) and Piezo1−/− (n=5) E9.5 embryos. b, Whole-cell current in a HUVEC exposed to 12, 5, 8, and 12 μL.s−1 super-fusion (flow). c, I-Vs for i and ii as indicated in (b). d, Paired comparison of 12 μL.s−1 responses at −24 mV as in (b): control siRNA (sc.si.) n=6, P1.si.1 n=7. e, Ca2+ in HEK 293 cells without transfection (non-trans., 5 cells) or transfected with wild-type (WT) Piezo1-GFP (7 cells) (n=1). f, Mean data of the type in (e) and for M2225R mutant (n=6 each). Error bars are s.e.m.
Figure 1. Piezo1 in murine embryos.
a, Numbers born or detected as embryos with Piezo1+/+, Piezo1+/− or Piezo1−/− genotypes. b, Images of sibling yolk sacs (containing embryos) and embryos at E9.5. Scale bar, 1 mm. (c, d) Dissected Piezo1+/+ and Piezo1−/−yolk sacs stained for CD31. (c) E9.5. Typical of n=11 (+/+) and n=8 (−/−). d, E10.5. Typical of n=9 (+/+) and n=11 (−/−). e, f, As for (c, d) except wild-type (EC-wt.) and endothelial-specific Piezo1-modified (EC-del.) embryos. e, E9.5. Typical of n=6 (EC-wt.) and n=9 (EC-del.). f, E10.5. Typical of n=5 (EC-wt.) and n=11 (EC-del.). Scale bars, 100 μm.
Vascular phenotype in mice with global disruption of Piezo1 could arise indirectly because of requirement for Piezo1 in non-endothelial cells. Therefore we generated endothelial-specific disruption of Piezo1 using cre recombinase expressed under the Tie2 promoter (Extended Data Fig. 3d-f). This disruption of Piezo1 also caused retardation of growth (Extended Data Fig. 3g) and prevented development of normal yolk sac vasculature (Fig 1e, f) without stopping the heart beat (Video S1 and Video S2). The data suggest requirement specifically for endothelial Piezo1.
We considered if a mechanical stimulus relevant to endothelial biology impacts on Piezo1 channels and speculated about shear stress, a frictional force arising from fluid flow. The force is sensed by endothelial cells to enable vascular development and maintain an efficient and healthy vasculature2,4,5,11,12. Seminal studies have revealed multiple participating proteins and suggested sensing via a Ca2+-permeable non-selective cation channel1-3,13-19 but the nature of the sensor itself and the molecular basis of the channel have remained controversial and elusive1,3.
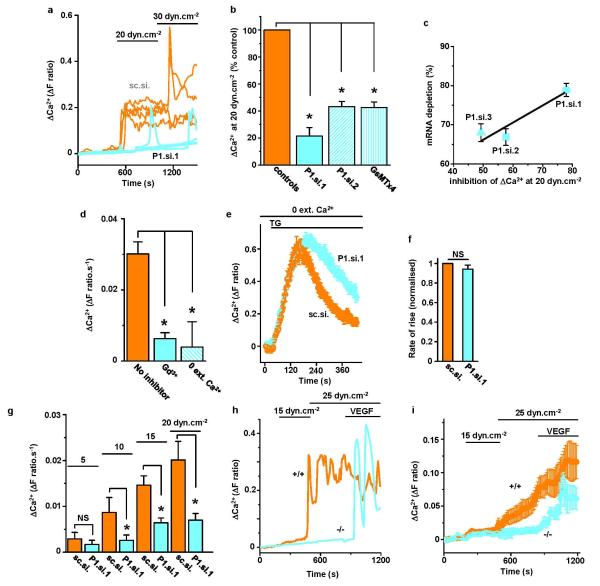
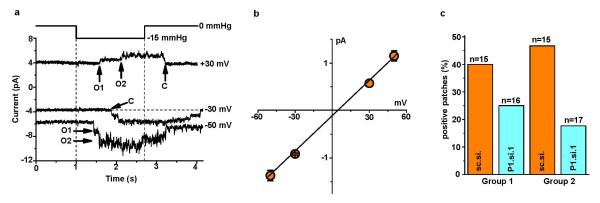
Piezo1 depletion and GsMTx4 were found to suppress shear stress-evoked Ca2+ entry in HUVECs (Extended Data Fig. 4a-f). Hepatic endothelial cells from patients undergoing surgical liver resection were also investigated and had similar dependency on Piezo1 (Extended Data Fig. 4g). Moreover, Piezo1−/− embryonic endothelial cells had less shear stress-evoked Ca2+ entry (Fig 2a) (Extended Data Fig. 4h, i). Furthermore, ionic current reversibly induced by shear stress had a current-voltage relationship (I-V) that was linear and reversed near 0 mV, as expected for Piezo1 channels6, and Piezo1 depletion suppressed the current (Fig 2b-d). In cell-attached membrane patches, negative pressure used to deliver physical force evoked unitary single channel events within less than 1 s. The unitary conductance of these channels was 25.2±1.7 pS, consistent with Piezo1 channels6, and Piezo1 depletion depleted the channels (Extended Data Fig. 5). The data suggest importance of Piezo1 channels in shear stress-sensing and the associated Ca2+ entry of endothelial cells.
To investigate if Piezo1 is sufficient for detecting shear stress we took advantage of human embryonic kidney (HEK) 293 cells which lack endogenous Piezo16. These cells had little or no shear stress response unless exogenous wild-type (WT) human Piezo1 was expressed (Fig 2e). A natural Piezo1 mutant M2225R20 which exhibits a slower response to stretch in cell-attached patches21 poorly reconstituted shear stress-evoked Ca2+ entry (Fig 2f). The data suggest that Piezo1 is sufficient to confer shear stress-evoked Ca2+ entry.
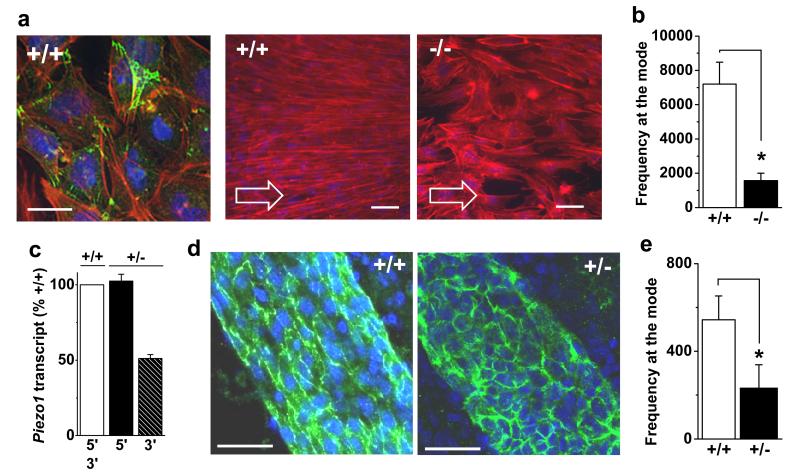
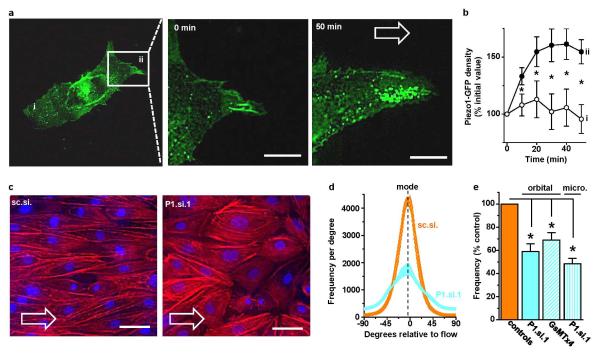
To shed light on the functional significance of shear stress-activated Piezo1 channels we first tracked the sub cellular localization of Piezo1 tagged with green fluorescent protein (GFP). In static conditions it was broadly distributed but in response to shear stress there was accumulation at the leading apical lamellipodia (Extended Data Fig. 6a, b). Such apical processes22 are characteristic of early-stage alignment of endothelial cells in the direction of shear stress, a process occurring physiologically in blood vessels2,23. We therefore measured alignment of HUVECs and found it to be suppressed by Piezo1 depletion or GsMTx4 (Extended Data Fig. 6c-e). Endothelial cells isolated from Piezo1−/− embryos also showed less alignment (Fig 3a, b). To investigate alignment in the adult animal we took advantage of haploinsufficiency in Piezo1+/− mice (Fig 3c). Imaging of CD31-positive cells in arteries of these mice at 6-8 weeks revealed striking difference in the organization of the endothelial cells: a cobblestone-like appearance in Piezo1+/− and linear appearance in the direction of flow in Piezo1+/+ litter-mate controls (Fig 3d, e). The data suggest Piezo1 channels as shear stress sensors that promote endothelial cell organization and alignment in the direction of flow.
Figure 3. Piezo1 in endothelial cell alignment.
a, Endothelial cells from E9.5 Piezo1+/+ and Piezo1−/− embryos with no shear stress (left) or 15 dyn.cm−2 as indicated by arrows. CD31 (green, left only), F-actin (red), nuclei (blue). Scale bars, 50 μm. b, Mean data for experiments as in (a) (n=4 +/+, n=5 −/−). c, Cerebral artery Piezo1 mRNA abundance detected 5′ and 3′ of Piezo1-disruption (n=2 each for Piezo1+/+ and Piezo1+/−). d, Cerebral arteries labeled for CD31 (green) and nuclei (blue). Scale bar, 40 μm. e, Quantification of in vivo CD31 orientation as shown in (d) (n=4 each). Error bars are s.e.m.
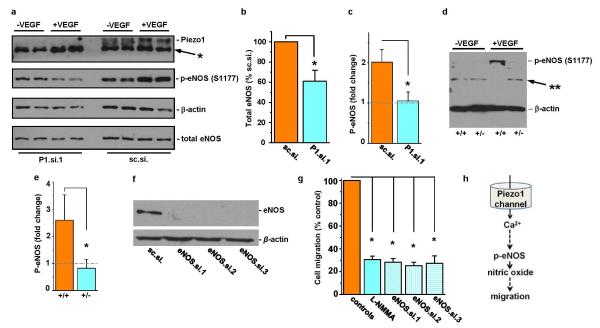
We next sought insight into downstream mechanisms. Account was taken of the fact that Piezo1 channel activity was stimulated by shear stress but also important for endothelial cell migration in the absence of shear stress. In nine membrane-patch recordings we had observed occasional 25-pS channel openings in the absence of mechanical strain, consistent with low-frequency Piezo1 channel activity without exogenous force. Therefore unbiased insight into downstream pathways was sought through titanium dioxide-trapping coupled with mass spectrometry to identify regulated proteins affected by Piezo1 depletion in static and shear stress conditions. Linked to Piezo1 under both conditions was endothelial nitric oxide synthase (eNOS) (Table S1), a protein with major roles in vascular biology24. Follow-up experiments confirmed reduction in total eNOS but more strikingly revealed abolition of VEGF-evoked phosphorylation of eNOS at serine 1177, a key enhancer of eNOS activity24, in static HUVECs depleted of Piezo1 and Piezo1+/− aorta in the absence of flow (Extended Data Fig. 7a-e). Consistent with functional relevance of coupling to eNOS, endothelial cell migration was similarly suppressed by Piezo1 depletion, eNOS depletion, and NOS inhibition (Extended Data Figures 2e and 7f, g). The data suggest that in the absence of shear stress Piezo1 activity drives endothelial cell migration through eNOS (Extended Data Fig. 7h).
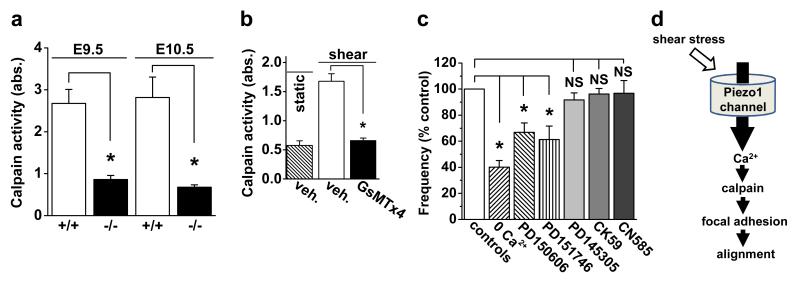
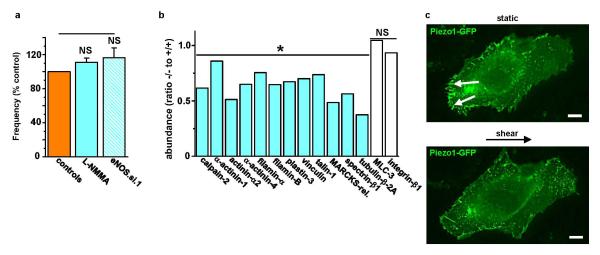
Nitric oxide and eNOS played no role in endothelial cell alignment to shear stress (Extended Data Fig. 8a) but in silico pathway analysis of proteomic data from endothelial cells under shear stress highlighted clusters of proteins from actin cytoskeleton (14 proteins, P=0.018) and focal adhesions (16 proteins, P=0.002). Relevance of these proteins was also indicated by denser actin structure in Piezo1-depleted cells (Extended Data Fig. 6c) and accumulation of Piezo1-GFP at the leading apical lamellipodia (Extended Data Fig. 6a, b) where focal adhesion turn-over becomes important as the endothelial cell adjusts to achieve alignment22. Moreover, detailed inspection of HUVEC and embryo proteomic data showed significant effects on calpain-2 and many of its known substrates (Extended Data Fig. 8b) (Table S2) which are important in the structure of actin cytoskeleton and focal adhesions25. We hypothesized, therefore, that a calpain-2 system is co-regulated with Piezo1 because it is integrated as a downstream mechanism. The hypothesis is consistent with calpain-2 as a Ca2+-activated proteolytic enzyme, previous association of calpain with Piezo126 and suggested roles of calpains in focal adhesion turn-over25 and endothelial cell alignment to shear stress27. Moreover, disruption of a critical regulatory protein of calpain-2 (calpain small subunit 1) disturbs vascular development in the yolk sac at E10.528. Consistent with this calpain hypothesis, calpain activity was significantly less in Piezo1−/− compared with Piezo1+/+ embryos (Fig 4a), increase in calpain activity in response to shear stress was abolished by GsMTx4 (Fig 4b), and Piezo1-GFP localized to dissolving focal adhesions at the trailing edge of the cell as shear stress was applied (Extended Data Fig. 8c). Importance of Piezo1-mediated Ca2+-entry and downstream Ca2+-activation of calpain-2 was further indicated by sensitivity of alignment to the absence of extracellular Ca2+ and presence of calpain inhibitors (Fig 4c). Inhibitors of two other Ca2+ activated mechanisms, calcineurin and Ca2+/calmodulin-dependent protein kinase II (CaMKII), had no effect (Fig 4c). The data suggest importance of calpain activation in coupling shear stress-enhanced Ca2+ entry through Piezo1 channels to endothelial cell organization and alignment via proteolytic cleavage of actin cytoskeletal and focal adhesion proteins (Fig 4d).
Figure 4. Piezo1 coupling to calpain.
a, Calpain activity indicated as absorbance (abs.) in embryos at E9.5 (n=3 Piezo1+/+, n=3 Piezo1−/−) and E10.5 (n=3 Piezo1+/+, n=3 Piezo1−/−). b, Calpain activity in HUVECs without or with shear stress (orbital shaker) for 15 min (n=3). GsMTx4 (2.5 μM). c, HUVEC alignment analysis as in Extended Data Fig. 6d, e. Test conditions: nominally Ca2+-free Krebs solution (0 Ca2+) (n=3); 3 μM PD150606 (calpain inhibitor) (n=3); 20 μM PD151746 (calpain inhibitor) (n=3); 20 μM PD145305 (negative control) (n=3); 25 μM CK59 (CaMKII inhibitor) (n=3); and 6 μM CN585 (calcineurin inhibitor) (n=3). d, Data interpretation. Error bars are s.e.m.
The findings of this study have important implications for understanding vascular physiology and potentially also prevalent disease processes such as atherosclerosis and cancer where profound alterations in shear stress and other mechanical forces are common2,12,29,30.
METHODS
Piezo1-modified mice
All animal use was authorized by both the University of Leeds Animal Ethics Committee and by The Home Office, UK. Project licenses used in this work were 40/3557 and 40/2946. All animals were maintained in Optimice individually ventilated cages (Animal Care Systems) at 21 °C 50-70 % humidity, light/dark cycle 12 h/12 h on RM1 diet (Special Diet Services, Witham, UK) ad libitum and bedding of Pure‘o Cell (Datesand, Manchester, UK) with enrichment of Sizzlenest (International Product Supplies, London, UK). Piezo1 Knockout First (with conditional potential) embryonic stem cells (Piezotm1(KOMPWtsi, clone ID EPD0500_5_F12)) were obtained from the KOMP Repository (www.komp.org) and injected into C57BL/6J blastocysts. The injected blastocysts were transplanted into pseudopregnant CD-1 recipient females. Chimaeric offspring were crossed to C57BL/6J mice to obtain germline transmission. Offspring were a minimum of N3 on a C57BL/6J background before being intercrossed to generate Piezo1 homozygotes. To generate endothelial-specific disruption of Piezo1 we first crossed mice carrying global disruption of Piezo1 with mice expressing FLP1 recombinase (B6.SJLTg(ACTFLPe)9205Dym/J mice from the Jackson Laboratory) to delete the lacZ insertion flanked by FRT sites (Extended Data Fig. 3a). Deletion of lacZ was confirmed (Extended Data Fig. 3d) and FLP1 recombinase gene was bred out. The mice were crossed with mice expressing Cre recombinase under the Tie2 (Tek) promoter (B6.Cg-Tg(Tek-cre)12Flv/J from the Jackson Laboratory). Males carrying Tie2-Cre were used to transmit Tie2-Cre to progeny and obtain endothelial deletion in embryos. Successful Cre-driven deletion and depletion of Piezo1 mRNA was confirmed by PCR (Extended Data Fig. 3e, f).
Genotyping and tissue isolation
Germ line transmission and all genotyping were determined by PCR analysis of DNA in ear-notches (see Extended Data Fig. 3 for example data and Table S3 for primer sequences). Embryos and yolk sacs were harvested from timed pregnancies at the indicated day post-coitus; embryonic (E) day 0.5 was the time when a vaginal plug was observed. Thoracic aorta was obtained from 6-8 week male mice after killing by CO2 asphyxiation and cervical dislocation in accordance with Schedule 1 Code of Practice, UK Animals Scientific Procedures Act 1986.
Ultrasound
Mice were anaesthetized with isoflurane and each embryo was observed using a Vevo® 2100 Imaging System (VisualSonics). The anatomical position of each embryo was recorded. After humane sacrifice by Schedule 1 procedure embryos were dissected and genotyped.
Mouse embryonic endothelial cells
E9.5 embryos were individually transferred to an eppendorf tube containing 1 mL of a solution containing collagenase (1.5 mg.mL−1) and DNase (25 μg.mL−1) in Hanks balanced salt solution and incubated at 37 °C for 60 min with occasional gentle agitation by pipetting. The obtained cell suspension was pelleted by centrifugation for 3-5 min at 3000 rpm and the cell pellet washed with 1 mL PBS. Cells were seeded in Ibidi slides with EGM-2 medium containing 5 % serum and used for experiments after 24 h. Cells staining positively for CD31 (Fig 3a) or responding to VEGF (Extended Data Fig. 4h, i) were classed as endothelial cells and used for analysis.
Fresh mouse artery and cultured mouse lung microvascular endothelial cells
Thoracic aorta was obtained from 6-8 week male C57BL/6J mice after killing by CO2 asphyxiation and cervical dislocation in accordance with Schedule 1 Code of Practice, UK Animals Scientific Procedures Act 1986. The mice were also used for endothelial cell isolation from lungs by immunoselection with CD146 antibody–coated magnetic beads (Miltenyi Biotech, UK). Lungs were harvested in ice-cold Hanks’ balanced salt solution (HBSS), finely minced, and digested in HBSS containing 0.18 units.mL−1 collagenase (10 mg.mL−1; Worthington, USA) for 45 min at 37 °C. The digested tissue was filtered through a 70-μm cell strainer and centrifuged at 1000 rpm for 10 min. The cell pellet was washed with PBS/0.05% BSA, centrifuged, resuspended in 90 μL PBS/0.05% BSA, and incubated with 15 μL CD146 antibody-coated beads at 4 °C for 20 min. Bead-bound cells were separated from non-bead-bound cells using a magnet. Bead-bound cells (CD146 positive) were resuspended in 2 mL Endothelial Cell Medium MV2 (PromoCell), with manufacturer’s supplement, gentamicin, amphotericin-B, and 10 % FCS, and seeded onto fibronectin coated plates with a full media change at 2 and 24 h post-isolation. The cell population tested positive for the endothelial markers eNOS, Tie2, and CD102.
Human endothelial cells
Human umbilical vein endothelial cells (HUVECs) were validated by positive staining with anti-CD31 antibody, VEGF responsiveness, and alignment to shear stress. Human nucleotide sequences were detected in the cells, confirming their human origin. No mycoplasma infection was detected. The HUVECs were cultured in EGM-2 growth medium supplemented with EGM-2 bullet kit (Lonza). Cells were maintained at 37 °C in a humidified atmosphere containing 5 % CO2. For human liver endothelial cells, participants undergoing liver resection for colorectal metastases at St James’s University Hospital, Leeds Teaching Hospitals NHS Trust, provided fully-informed written consent. The work was carried out under approval granted by the local ethics committee (Ref 10/H1306/82) and the study adopted into the United Kingdom Clinical Research Network portfolio (ID 9442). Tissue was collected immediately following resection. A section of normal liver tissue was immediately taken from a macroscopically normal area of the surgical specimen, > 2.5 cm from any tumours, and with subsequent microscopic confirmation. The samples were stored and transported in cold EGM-2 growth medium supplemented with EGM-2 bullet kit (Lonza) on ice. Endothelial cells were prepared using a protocol adopted from a previous study31. Briefly, 1 g of tissue was weighed and minced in a petri dish. The tissue was re-suspended in 9 mL 0.1 % collagenase and 1 mL 2.5 U.mL−1 dispase solution and incubated for 45 min at 37 °C in a water bath under continuous agitation. At the end of enzymatic digestion the sample was passed through 100-μm then 40-μm cell strainers to remove major debris and then washed twice in MACS buffer consisting of phosphate-buffered saline (PBS), EDTA 2 mM, and serum 0.1 %. The pellet was resuspended in 20 mL of red blood cell lysis buffer (TRIS base 17 mM, NH4Cl 140 mM) for 10 min at room temperature. Following a final wash in MACS buffer the cells were incubated with 100 μL of dead cell removal paramagnetic microbeads per 1 ×10⁷ cells (Miltenyi Biotec) in buffer at room temperature for 15 min. The suspension was then passed through a MACS cell separation column in a magnetic field to retain apoptotic cells, dead cells and debris. The live cell fraction was eluted and incubated with 20 μL FcR blocking reagent and 20 μL anti-CD31-conjugated paramagnetic microbeads per 1 × 10⁷ cells at 4 °C for 15 min. This suspension was then passed through a column in a magnetic field and the unbound cells eluted with buffer. Once removed from the magnetic field the column was washed with buffer to elute CD31-positive cells. The approach was validated by flow cytometry and immunostaining. Cells were incubated at 37 °C in 5 % CO2 and used up to passage 3.
Human dermal (juvenile foreskin), bladder, cardiac, colonic, and pulmonary microvascular and pulmonary artery and umbilical artery endothelial cells were from PromoCell. Cells were maintained at 37 °C in a humidified atmosphere containing 5 % CO2. For late outgrowth endothelial progenitor cells (LEPCs) venous blood samples were drawn from healthy volunteers into EDTA-coated tubes and processed immediately. Ethical approval and consent were obtained. Blood was mixed with an equal volume of PBS and layered onto Ficoll Paque PLUS (GE Healthcare) prior to density gradient centrifugation. Peripheral blood mononuclear cells were aspirated from the buffy layer and washed twice with PBS. Mononuclear cells (5×10⁶ per mL) were then suspended in EGM-2 growth medium supplemented with EGM-2 bullet kit (Lonza) with 10 % fetal calf serum (FCS) and 2 mL of cell suspension was added to a fibronectin-coated 6-well plate (Becton Dickinson). The cells were incubated at 37 °C in 5 % CO2 and culture medium was changed every day for the first week, then on alternate days. After 2-3 weeks colonies of LEPCs were observed; on day 28, cells were detached using trypsin/EDTA 0.025 % solution (Gibco BRL) and placed into large fibronectin coated vessels. The cells exhibited contact inhibition and were capable of serial passage. Flow cytometry revealed that 89 % of cells co-expressed vascular endothelial growth factor (VEGF) receptor-2 and CD31.
Cell migration and tube formation assays
Migration assays were performed using a modified Boyden chamber (8-μm pores; BD Biosciences, UK). HUVECs transfected with siRNA were serum-starved in EGM-2 for 4 h, resuspended at 5 × 10⁴ cells.mL−1 in EGM-2 containing 0.4 % FCS and loaded in the upper chamber. The lower chamber contained 0.4 % FCS supplemented with the chemo-attractant 20 ng.mL−1 VEGF (Sigma). After incubation for 4 h at 37 °C in a 5 % CO2 incubator, the inserts were fixed with 70 % ethanol for 2 min. Cells on duplicate membranes were scraped from the upper surface and migrating cells underneath were stained with haematoxylin and eosin and evaluated by counting cells in 6 randomly chosen fields under light microscopy. For fibroblast-endothelial cell co-culture tube-formation assays, Normal Human Dermal Fibroblasts (NHDFs) were plated at 2 ×10³ cells.well−1 with fibroblast growth medium (FGM) in 96-well plates (Greiner bio-one) and incubated at 37 °C in 5 % CO2. The medium was removed from NHDFs on day 4 and transfected HUVECs were loaded on top at 5.4 ×10⁴ cells.well−1 in endothelial cell growth medium supplemented with 2 % serum and 3 ng.mL−1 VEGF. Co-cultures were incubated for a further 7 days at 37 °C in 5 % CO2. Tubes were analysed following fixing and staining of endothelial cells with anti-CD31 antibody. Quantification of tube formation was conducted by using IncuCyte angiogenesis v2.0 image analysis (Essen Bioscience). For in vivo tube-formation studies, ice-cold Matrigel (0.5 mL.plug−1; BD Biosciences) was mixed with VEGF (100 ng.mL−1), EGM-2 and 5 × 10⁵ HUVECs transfected with P1.si.1 or sc.si. and then subcutaneously injected into the flanks of 6 to 8-week-old male immuno-deficient CD1 nude mice (Charles River Labs, Boston, MA). After 7 days, mice were anaesthetised and Matrigel plugs were carefully dissected away from the surrounding adherent tissue, washed with PBS and fixed in 4 % paraformaldehyde, embedded in paraffin, sectioned, and stained with hematoxylin and eosin. Digital images were obtained by bright-field light microscopy. Blood vessels in the plug were quantified by ImageJ software (NIH). All animal experiments were performed in accordance with ethical approval under UK Home Office licence.
DNA constructs and transfection
Human Piezo1 IRES GFP (from J Wood) was used as a PCR template to create Piezo1-GFP using inverse primers (Forward: 5′ GAGGGTGGAGGTGGAACAACCATGGTGAGCAAGGGCGCC; Reverse: 5′ TCCACCTCCACCCTCCTTCTCACGAGTCCAC) and pHUSION (NEB, Herts, UK) to delete the IRES cDNA and insert a linker of four glycine residues. The PCR product was recombined using Clontech In-Fusion HD cloning kit (Takara Bio Europe, France). A Kozak sequence was inserted into the Piezo-GFP 5′ region using mutagenic primers (Forward: 5′TCCCACCATGGAGCCGCACGTGCT; Reverse 5′ AGCACGTGCGGCTCCATGGTGGGA) and pHUSION. M2225R Piezo1-GFP mutagenesis was performed using mutagenic primers (M2225R Forward: ATGAGCCGCTGTTCACCAGGAGCGCCC; M2225R Reverse: GGGCGCTCCTGGTGAACAGCGGCTCAT) and pHUSION. All clones were sequenced to confirm accuracy and identity. HUVECs and HEK 293 cells (GripTite™ 293 cells) were transfected with FuGENE® HD (Promega) using 1 and 0.3 μg of plasmid and measurements were made after 48 and 72 h respectively.
RNA interference and RT-PCR
Endothelial cells at 90 % confluence were transfected with 20 nM siRNA using Lipofectamine 2000 in OptiMEM as per the manufacturer’s instructions (Invitrogen). Sequences of siRNA probes are given in Table S3. The control siRNA was from Ambion or Dharmacon depending on the source of the test siRNA (Extended Data Fig. 2a). Fresh EGM-2 growth medium was added after 3-4 h and the cells were analyzed 48 h after transfection. To validate effectiveness of siRNA probes, mRNA was isolated and quantified by real-time RT-PCR: Total RNA was extracted using a Tri-reagent protocol followed by DNase I (Ambion) treatment. 1 μg of total RNA was used for reverse transcription (RT) based on oligo-dT primers and AMV RT enzyme. The specificity of PCR was verified by reactions without RT (-RT) and melt-curve analysis. Sequences of PCR primers are given in Table S3. PCR products were electrophoresed on 2 % agarose gels containing ethidium bromide and sequenced to confirm identity. Real-time PCR was carried out using a Lightcycler (Roche). For RNA isolation from cerebral arteries, vessels were dissected from the brain and surrounding connective tissue, snap frozen, and RNA extracted as indicated above.
Proteomics
Cells were processed 2 days after transfection or embryos were snap-frozen after dissection from the animal. Samples for label-free phosphoproteomic analysis were processed by modified Filter-Aided Sample Preparation (FASP) method32. Briefly, 1.3 mg protein lysate for each sample was diluted in 8 M urea, 20 mM DTT in 100 mM Tris/HCL pH 8.5 (FASP1 buffer) and concentrated using Vivacon 500, 30k MWCO HY filter vials (Sartorius Stedim Biotech, VN01H22). After several exchanges in the FASP1 buffer, samples were diluted in 100 mM Tris/HCl pH 8.5 and reduced by 50 mM iodoacetamide. Excess iodoacetamide was removed by centrifugation and after buffer exchange into 100 mM triethyl ammonium bicarbonate, trypsin digest was performed overnight followed by second digestion for 5 h. Resulting peptide mixture was washed with 0.5 M NaCl, acidified with 10 % TFA and desalted33. Phosphopeptides in the mixture were enriched by incubation with TiO2 beads equilibrated in 1M glycolic Acid, 80 % ACN, 5 % TFA, washed and eluted by 0.5 % NH4OH. Acidified eluates were dried under vacuum and re-suspended in 1 % FA. Peptides were separated using an Ultimate 3000 RSLC (Thermo Scientific) nanoflow LC system. Triplicates of each sample were loaded onto an Acclaim PepMap100 nanoViper C18 trap column (100 μm inner-diameter, 2 cm; Thermo Scientific) for trap enrichment, then peptides were eluted onto an Acclaim PepMap RSLC nanoViper, C18 column (75 μm, 15 cm; ThermoScientific) and subjected to a 65 min linear gradient of 2–40 % solvent B (80 % acetonitrile with 0.08 % formic acid) with a constant flow of 300 nl.min−1. The HPLC system was coupled to a linear ion trap Orbitrap hybrid mass spectrometer (LTQ-Orbitrap Velos, Thermo Scientific) via a nanoelectrospray ion source (Thermo Scientific), with the spray voltage set to 1.2 kV, and the temperature of the heated capillary at 250 °C. Spectra acquisition was performed essentially as described previously34 using the Xcalibur software (Thermo Scientific).
Label-free quantification of the acquired spectra was performed by the Progenesis LC-MS software, which uses wavelet-based filtering to smooth the peak envelopes and screen noisy areas and transforms the profile data of the MS scans to peak lists comprising m/z (mass-to-charge ratio) and abundance. One sample run was selected as a reference and the automatic Alignment Algorithm was applied to enable alignment of all the LC-MS runs to the reference run. Features with only one charge or more than seven charges were excluded from further analyses, while all remaining features were used for normalisation. The database search was performed with MASCOT (version 2.3.2, Matrix Science, London, UK), using trypsin as the enzyme and allowing for cleavage N-terminal to proline residues and between aspartic acid and proline residues. Any peptides with conflicting assignments were resolved, either by assignment to one of identical proteins or by assignment to proteins with the largest number of peptides already present, following Occam’s Razor principle. For protein quantification, all peptides of an identified protein were included and the total cumulative abundance was calculated by summing the abundance of all peptides allocated to the respective protein. Calculation of the protein p value by one-way ANOVA was then performed on the sum of the normalized abundance across all runs. In silico pathway analysis was performed by the Database for Annotation, Visualization and Integrated Discovery35 (http://david.abcc.ncifcrf.gov/).
Western blotting
Cells were transfected and harvested in lysis buffer containing 10 mM Tris, pH 7.5, 150 mM NaCl, 0.5 mM EDTA, 0.5 % NP-40, MiniComplete protease inhibitors (Roche), and PhosSTOP phosphatase inhibitors (Roche). Equal protein amounts were loaded on 8 % gels and resolved by electrophoresis. Samples were transferred to PVDF membranes and labeled overnight with primary antibody: anti-β-actin (0.2 μg.mL−1, Santa Cruz); anti-total-eNOS (0.2 μg.mL−1, BD Biosciences); anti-p(S1177)-eNOS (0.2 μg.mL−1, BD Biosciences); or anti-Piezo1 (0.3 μg.mL−1, Proteintech). Horse radish peroxidase-conjugated donkey anti-mouse or anti-rabbit secondary antibody (Jackson ImmunoResearch) and SuperSignal Femto detection reagent (Perbio Science) were used for visualization. Densities of protein bands were quantified by ImageJ software. Catalogue information for antibodies: Anti-β-actin (0.2 μg.mL−1, Clone C4, sc-47778; Santa Cruz); anti-total-eNOS (0.2 μg.mL−1, Clone 3/eNOS/NOS Type III, Cat. #610297; BD Biosciences); anti-p(S1177)-eNOS (0.2 μg.mL−1, Cat. #612392; BD Biosciences); or anti-Piezo1 (0.3 μg.mL−1, Proteintech).
Immunofluorescence and live-cell imaging
Cells were fixed with 2 % paraformaldehyde for 10 min and permeabilised with 0.1 % TritonX-100 for 10 min at room temperature. Non-specific sites were blocked using 10 % donkey serum in PBS for 1 h at room temperature. Cells were then incubated in 2 % donkey serum in PBS containing mouse anti-human CD31/PECAM-1 (Dako, clone JC70A) at 1:500 dilution for 1 h at room temperature. After washing with PBS, cells were incubated with DyLight 649-conjugated Affinipure Donkey anti Mouse IgG (Jackson Immuno Research Laboratories) for 30 min at room temperature. Cells were mounted with Prolong Gold Antifade Reagent (Invitrogen) and visualized using a DeltaVision deconvolution system (Applied Precision Instruments, Seattle, WA) on an Olympus IX-70 inverted microscope fitted with x60 UPLAN objective (NA 1.35). For F-actin staining, cells were incubated with 1:250 Rhodamine Phalloidin (Cytoskeleton Inc.) for 30 min at room temperature. Cell nuclei were labeled with DAPI (4′,6-diamidino-2-phenylindole) with the excitation wavelength of 350 nm. Piezo1-GFP was observed at the excitation wavelength of 488nm. For tracking Piezo1-GFP in live HUVECs, cells were seeded in an Ibidi μ-Slide VI 0.4 and imaged 2 days after transfection using the DeltaVision deconvolution system and an excitation wavelength of 488 nm. Images were sampled every 15 s for 10 min before 15 dyn.cm−2 was applied and imaging continued for 50 min. To quantify the GFP fluorescence its intensity in multiple squares (5 or 9 μm2 depending on the shape of the apex) was measured using ImageJ software for each region of the cell indicated in Extended Data Fig 6a. The number of squares for each region was between 3 and 5 and the average intensity for all squares in each region was used. Yolk sacs and mouse cerebral arteries were dissected in cold PBS and fixed in 4% paraformaldehyde overnight at 4 °C or 1 h at room temperature and permeabilised with 0.1-0.3 % TritonX-100 for 1 h, blocked in 2 % BSA and 0.1 % Triton-X-100 for 2 h at room temperature, followed by labeling with anti-CD31/PECAM-1 antibody (ab28364 Abcam) overnight at 4 °C. Yolk sacs or cerebral arteries were then incubated with DyLight 488-conjugated Affinipure Donkey anti rabbit IgG for 1 h at room temperature and mounted with Prolong Gold Antifade Reagent. Images were captured using a confocal microscope (Zeiss LSM 700).
Electrophysiology
Borosilicate glass capillaries with an outside diameter of 1 mm and an inside diameter of 0.58 mm (Harvard Apparatus, Holliston, MA, USA) were used as the basis for patch pipettes. Pipettes were pulled using a PP-830 vertical 2-stage pipette-puller (Narishige, Tokyo, Japan). Pipette resistances after fire-polishing and filling with pipette solution were 3-5 MΩ. Pipettes were mounted on a CV-4 head-stage (Molecular Devices, Sunnyvale, CA, USA) connected to a 3-way coarse manipulator and micromanipulator (Mitutoyo, Japan). The electrode was a Ag/AgCl wire. Electrical signals were amplified and recorded using an Axopatch 1D amplifier and pCLAMP 10 software (Molecular Devices). Data were filtered at 1 kHz and sampled digitally at 3 kHz via a Digidata 1322A analogue to digital converter (Molecular Devices). Analysis was performed off-line using Clampfit 10.2 (Molecular Devices) and Origin 7.5 software (OriginLab, Northampton, MA). Recordings were made at room temperature. Recordings in cell-attached patch mode used a bath solution containing (mM): 140 KCl, 10 D-glucose, 10 Hepes, 1 MgCl2, titrated to pH 7.4 with KOH. The patch pipette solution contained (mM): 130 NaCl, 5 KCl, 10 TEA (tetraethylammonium) Cl, 8 D-glucose, 10 Hepes, 1.2 MgCl2, 1.5 CaCl2, titrated to pH 7.4 with NaOH. Negative pressure was applied to the inside of the patch pipette via a valve and syringe coupled to a calibrated pressure transducer. For whole-cell recording the patch pipette solution contained (mM): 95 Na-aspartate, 40 CsCl, 10 Hepes, 1 MgCl2, 1 CaCl2, 5 EGTA, 10 TEACl, titrated to pH 7.2 with CsOH; the bath solution contained (mM): 130 NaCl, 5 KCl, 8 D-glucose, 10 Hepes, 1.2 MgCl2, 1.5 CaCl2, titrated to pH 7.4 with NaOH. Correction was made for a calculated −9 mV liquid-liquid junction potential. The Cl− equilibrium potential was at −24 mV. The superfusion pipette had a diameter of ~350 μm.
Intracellular Ca2+ measurement
Cells were incubated with fura-2AM for 1 h at 37 °C followed by a 0.5 h wash at room temperature (21± 2 °C) on Ibidi μ-Slide VI 0.4. Measurements were made at room temperature on a Zeiss Axiovert fluorescent microscope equipped with x20 (NA 0.75) or x40 (NA 1.3, oil) Fluar objective and excitation light from a xenon lamp selected by a monochromator (Till photonics, Germany). Emitted light was collected via an emission filter and images captured by an Orca-ER digital camera (Hamamatsu, Japan). The extracellular (superfusion) recording solution contained (mM): 130 NaCl, 5 KCl, 8 D-glucose, 10 Hepes, 1.2 MgCl2, 1.5 CaCl2, titrated to pH 7.4 with NaOH. For the experiment of Extended Data Fig 4a-b, 2 ng.mL−1 VEGF was included. The change (Δ) in intracellular calcium (Ca2+) concentration above baseline is shown by the ratio of fura-2 fluorescence (F) emission intensities for 340 and 380 nm excitation (ΔF ratio). For statistical comparisons, the total ΔF ratio above baseline was calculated for each shear stress and divided by the time period over which the ΔF ratio was measured (ΔF ratio.s−1).
Calpain activity
The assay detected cleavage of calpain substrate Ac-LLY-AFC (Abcam). Cells were counted, pelleted by centrifugation, and re-suspended in 100 μL of extraction buffer and incubated on ice for 20 min. Gentle mixing was achieved by tapping several times during the incubation. Centrifugaton was applied for 1 min in a microcentrifuge (10000 × g) and the cell lysate was diluted in 85 μL of extraction buffer and transferred to wells in a 96-well plate. Embryos were homogenized prior to dilution in extraction buffer. All inputs were standardized according to total protein content. 10 μL of 10x reaction buffer and 5 μL of calpain substrate were added to each assay well. Incubation occurred at 37 °C for 1 h in the dark, after which measurements were made on a plate-reader equipped with a 400 nm excitation filter and 505 nm emission filter. Absorbance values in arbitrary units are presented after subtraction of background.
Shear stress
Shear stress was achieved in microfluidic chambers (http://ibidi.com/) or on an orbital shaker (210 rpm) that generated swirling motion of medium around the edges of the wells producing tangential shear stress, which results in cell elongation and alignment along the edges36. Shear stress is specified in dyn.cm−2, where 1 dyn.cm−2 is 0.1 Pa or 0.1 N.m−2. For the orbital shaker experiments, cells 2 days after transfection were re-plated at 70 % confluency onto 6-well plates. After 4 h, cells were subjected to shear stress for up to 60 h. In experiments of Fig 4c where extracellular Ca2+ was omitted, Krebs solution was used and it contained (mM): NaCl, 125; KCl, 3.8; NaHCO3, 25; MgSO4, 1.5; KH2PO4, 1.2; D-glucose, 8; CaCl2, 0 or 1.2; EDTA, 0.02.
Reagents
GsMTx4, a toxin from the tarantula Grammostola spatulata, was from Peptide Institute Inc. PD145305 (3-phenyl-2-sulfanylpropanoic acid) and PD151746 (3-(5-fluoro-3-indolyl)-2-mercapto-(Z)-2-propenoic acid) were from Santa Cruz Biotechnology. PD150606 (3-(4-iodophenyl)-2-mercapto-(Z)-2-propenoic acid), CK59 (2-(2-hydroxyethylamino)-6-aminohexylcarbamic acid tert-butyl ester-9-isopropylpurine) and CN585 (6-(3,4-dichlorophenyl)-4-(N,N-dimethylaminoethylthio)-2-phenyl-pyrimidine) were from EMD Millipore. L-NMMA (N-methyl-L-arginine) and ruthenium red were from Sigma-Aldrich. The solvent for each stock solution was dimethylsulphoxide except in the cases of GsMTx4, ruthenium red and L-NMMA when it was water. Inhibitors were pre-incubated with cells for 1 h prior to evoking cell activity.
Cell orientation analysis
Using ImageJ software, images were rotated to the direction of applied shear stress or blood flow. For analysis of intact arteries, images were analysed only within the outer arterial wall. Images were processed using a Difference of Gaussian plugin to define cell edges (http://www.sussex.ac.uk/gdsc/intranet/microscopy/imagej/utility). Automated quantification of cell orientation relative to the direction of shear stress was determined using OrientationJ software, also an ImageJ plugin37 (http://bigwww.epfl.ch/demo/orientation/). OrientationJ produced a histogram of all local angles in each image. A Gaussian distribution curve was fitted to each arising histogram. The baseline-subtracted frequency maximum at the mode of the distribution was determined.
Statistical analysis
All averaged data are presented as mean±s.e.mean (SEM). Data were produced in pairs (test and control) and the raw data pairs were compared statistically using a one-tailed t test for the hypothesis that the test condition decreased the response and a two-tailed t test for the hypothesis that the response changed in either direction (i.e. decrease or increase). Normal distribution of data was assumed but equal variance was not. For one data set we used one-way ANOVA followed by Tukey posthoc test (Extended Data Figure 4d). In all cases, statistically significant difference is indicated by * (P<0.05) and no significant difference is indicated by NS (P>0.05). Statistical tests were performed using OriginPro 8.6 software. Analysis of proteomic data was an exception where ANOVA was used as indicated in the specific section for this work. The letter n is used to denote the number of independent biological experiments and does not denote replicates within one such experiment (the number of replicates was always >2). Randomization of samples was not applied. Blinding was applied to Ca2+ measurement and cell alignment studies of embryonic endothelial cells and patch-clamp studies of HUVECs after transfection with siRNA. The Source Data file contains the raw data underlying graphical presentations.
Extended Data
Extended Data Figure 1. Piezo1 mRNA in aorta and endothelial cells.
a, End-point PCR products obtained with Piezo1 primers for human (h.) liver and mouse (m.) lung endothelial cell (EC) and freshly-dissected mouse aorta mRNA after reverse transcriptase reaction (RT) to generate cDNA. b, As for (a) but for: human late outgrowth endothelial progenitor cells (LEPC) and 7 types of human endothelial cell (art., arterial; micr., microvascular; pul., pulmonary; umb., umbilical; car., cardiac; bla., bladder; der., dermal; col., colonic). Results are shown with (+ RT) and without (-RT) reverse transcription. c, Quantitative real-time PCR data for experiments of the type shown in (a) (n=2 each in duplicate). d, Quantitative real-time PCR data for experiments of the type shown in (b) (n=1 each in duplicate).
Extended Data Figure 2. Role of Piezo1 channels in HUVEC migration and tube formation.
a, Western blot for HUVEC lysate probed with anti-Piezo1 antibody after transfection with the control siRNA (sc.si.), 2 different single Piezo1 siRNAs (P1.si.1 or P1.si.2), or a pooled set of Piezo1 siRNAs (P1.si.3). The upper band in the upper blot represents Piezo1 with a predicted mass of 286 kDa. The band immediately below is unknown protein labeled non-specifically by anti-Piezo1 antibody (*). The lower blot shows β-actin included as a protein-loading control. b, Another western blot for HUVEC lysate probed with anti-Piezo1 antibody after transfection with control siRNA (sc.si.) or Piezo1 siRNA (P1.si.1). The arrow points to Piezo1 protein. Apparent depletion of an additional protein by P1.si.1 is evident at about 130 kDa but this effect was not reproducible in other experiments. Other proteins (e.g. at about 250 (*), 190, and 100 kDa) were non-specifically labeled by the anti-Piezo1 antibody and not affected by Piezo1 siRNA. More specific anti-Piezo1 antibody could not be found. c, Normalized quantitative densitometry analysis for Piezo1 band of the type shown in (b) (n=3). d, Specificity of depletion by Piezo1 siRNA. The effect of the TRPV4 channel activator 10 μM 4α-phorbol 12,13-didecanoate (4-αPDD) is shown on intracellular Ca2+ in HUVECs in multiple wells of a 96-well plate on a fluorescence plate-reader (representative of n=3). HUVECs were transfected with sc.si. or P1.si.1. The data show that P1.si.1 did not affect TRPV4. e, Cell migration after transfection with sc.si compared with P1.si.1 or sc.si. compared with P1.si.2 (n=4 each). f, As for (e) but comparing vehicle controls with 5 μM GsMTx4 or 30 μM ruthenium red (n=3 each). g, Example images of in vitro tube formations in co-culture with fibroblasts. HUVECs were transfected with sc.si or P1.si.1 and labeled with anti-CD31 antibody (green). Scale bar, 400 μm. h, Analysis of tube length in images of the type shown in (g) and similarly for P1.si.2 (n=3 for all groups). i, Example sections from in vivo Matrigel plugs in which HUVECs were transfected with sc.si. or P1.si.1. The arrow points to a typical tube structure. Scale bar, 50 μm. j, Mean data from tubes exemplified by (i) for 6 independent experiments (i-vi) (5-17 tissue sections each). Error bars are s.e.m.
Extended Data Figure 3. Global and endothelial-specific Piezo1 modification and embryonic growth retardation in mice.
a, Simplified diagram of the Piezo1 Knockout First (conditional) construct provided in ES cells by the KOMP Repository (http://www.komp.org). Piezo1 is indicated containing insertion of lacZ sequence flanked by flippase recognition target (FRT) sites and downstream loxP sites. Further details of the construct can be obtained at http://www.komp.org. b-c, Global modification. b, Example genotyping results with lacZ or loxP-spanning PCR primers. M indicates the DNA marker ladder. On the left are results for 6 mice analysed by the lacZ PCR primers (expected product: 225 bp). On the right are the results for the same 6 mice analysed by primers targeted to endogenous Piezo1 sequence either side of the 3′ terminal loxP site (expected products: 155 bp without the loxP site; 189 bp with the loxP site). In the gel shown, 3 mice were heterozygous for the construct (+/−), 2 homozygous (−/−), and 1 wild-type (+/+). c, Images of example sibling E10.5 embryos. The embryo on the left was Piezo1+/+ and the embryo on the right was Piezo1−/−. The scale bar is 1 mm. d-g, Endothelial-specific modification. d, Example genotyping results for two mice (mouse 1 and mouse 2) both with deletion of the lacZ insert and transmission of Tie2-cre. Controls for the absence and presence of lacZ, the loxP insert, and Tie2-cre are included. Successful deletion of the lacZ insert was confirmed by lack of β-galactosidase staining (data not shown). e, Example genotyping results for six sibling embryos analysed with PCR primers spanning the deletion predicted to result from cre recombinase activity at the loxP sites. The forward primer was 5′ of the 5′ FRT site illustrated in (a) and the reverse primer was 3′ of the 3′ loxP site. The PCR product size after deletion was expected to be 379 bp. The product was detected in embryos 2 and 6. The PCR product was not generated in embryos without the deletion because it was too long to be amplified (4208 bp). Embryos exhibiting the 379 bp product were designated “EC-del.” to indicate disruptive deletion in Piezo1 of endothelial cells (ECs). Embryos designated as wild-type (wt.) exhibited no 379 bp product and only the 155 bp loxP product (as shown for the “no loxP insert control” in d). Out of a total of 142 embryos, 57 were EC-del. f, RT-PCR products detecting Piezo1 mRNA in total RNA from sibling embryos (Piezo1 3′ PCR primers) (n=3, each in duplicate). Piezo1 mRNA was significantly depleted in embryos displaying the 379 bp product described and shown in (e). g, Images of example sibling E10.5 embryos. The embryo on the left was wild-type and the embryo on the right contained endothelial-specific Piezo1 deletion (EC-del.). Retarded growth was apparent in EC-del. embryos and none of the other embryos. The scale bar is 1 mm. Error bars are s.e.m.
Extended Data Figure 4. Piezo1-dependence of shear stress-evoked Ca2+ events in human endothelial cells and mouse embryonic endothelial cells.
a, Example intracellular Ca2+ events evoked by microfluidic shear stress in HUVECs transfected with control siRNA (sc.si.) or Piezo1.si.1 (P1.si.1). Each trace is for 1 cell. In one P1.si.1 cell, transient Ca2+ elevation remained. Such residual events may reflect insufficient Piezo1 depletion in some cells or non-Piezo1 mechanisms. b, Mean data for experiments of the type in (a) and expanded to paired comparisons of sc.si. and P1.si.1 (n=5 each), sc.si. and P1.si.2 (n=4 each), vehicle and 2.5 μM GsMTx4 (n=3 each). Data were normalized to their respective controls. c, Quantification of Piezo1 mRNA depletion (n=4 each) plotted against the inhibition of the intracellular Ca2+ elevations evoked by 20 dyn.cm−2. Three different Piezo1 siRNAs were compared with their control siRNAs. The Ca2+ data are from the experiments described in (b). Sequence details of the siRNAs are provided in Table S3. d, Mean Ca2+ signals evoked by 20 dyn.cm−2 in non-transfected HUVECs. Measurements were made in standard bath solution without the addition of an inhibitor (no inhibitor) (n=8), 10 μM gadolinium chloride (Gd3+) (n=3), or with Ca2+ omitted from the bath solution (0 Ca2+) (n=3). e, Ca2+ release evoked by 2 μM thapsigargin (TG) in the absence of extracellular Ca2+ and after transfection with sc.si. or P1.si.1 (20 wells of a 96-well plate each). f, Mean data normalized to sc.si. for experiments of the type shown in (e) and analysed for the rate of rise of the Ca2+ event evoked by TG (n=3 each). g, Similar to (b) but endothelial cells were from patient liver samples, data were not normalized, and only P1.si.1 was used (n=3, 4, 10 and 5 for shear stresses of 5, 10, 15 and 20 dyn.cm−2). h, i, Intracellular Ca2+ measurements from mouse embryonic endothelial cells in microfluidic chambers. h, Superimposition of example intracellular Ca2+ events in 2 single cells on different coverslips from Piezo1+/+ and Piezo1−/− sibling embryos. Shear stress was applied at 15 and 25 dyn.cm−2 and then 30 ng.mL−1 VEGF was introduced while maintaining shear stress at 25 dyn.cm−2. i, Mean±s.e.mean data for all VEGF-responsive cells studied as exemplified in (h) (n=6 +/+, 54 cells; n=5 −/−, 42 cells). The same data are summarized in simplified form in Fig 2a. Error bars are s.e.m.
Extended Data Figure 5. Piezo1-dependence of mechanically-activated single channels in HUVECs.
a, Example single channel currents in a cell-attached patch at three voltages without subtraction of holding current. Application of −15 mmHg pressure steps to the patch pipette evoked open channel unitary currents that summated to two levels marked as O1 and O2. Closed channel current is indicated by C. b, Mean amplitudes of unitary events as exemplified in (a) and fitted with a straight line (3 patches for −50, −30 and −50 mV; 1 patch for +30 mV). c, Paired comparisons of the percentage of patches containing channel events exemplified in (a) for cells transfected with sc.si. or P1.si.1 in two independent experiment groups (n values for each group are in parentheses). In Group 2 cell-attached patch recordings cells were exposed for 10 min to 0.4 mM EGTA to chelate contaminating Ca2+ prior to recording so that sc.si.- and P1.si.1-treated cells rounded up similarly; without this treatment (Group 1), P1.si.1 but not sc.si. cells tended to round up in response to the high-K+ bath solution used to null the membrane potential of cells in cell-attached patch recordings (the reason for this effect is unknown but it may relate to changes in cytoskeleton and adhesion as discussed in relation to Fig 4). Error bars are s.e.m.
Extended Data Figure 6. Shear stress-evoked redistribution of Piezo1 and the role of Piezo1 in alignment of endothelial cells to the direction of shear stress.
The application and direction of shear stress is indicated by open arrows and the cells were HUVECs. a, The left-hand image is of Piezo1-GFP in a single cell with a box indicating the region expanded in the middle and right-hand images after 0 and 50 min 15 dyn.cm−2 in the microfluidic chamber. In the left image i indicates the part of the cell that became trailing after application of shear stress and ii that which became leading. Scale bars, 10 μm. b, Analysis of experiments of the type shown in (a) (n=8 per data point except for n=7 at 50 min) where i and ii indicate the trailing and leading edges of the cell as shown in (a). c, Example cells after 24 h shear stress caused by the orbital shaker. Rhodamine phalloidin labeled F-actin (red) and DAPI labeled cell nuclei (blue). A paired comparison was made of cells transfected with control siRNA (sc.si.) or Piezo1 siRNA (P1.si.1). Scale bars, 50 μm. d, Example orientation analysis for pairs of images of the type shown in (c). e, As for (d) but normalized mean data for the frequency (number of angles) at the mode in experiments comparing mock with P1.si.1 transfected cells (n=5 each) and 2.5 μM GsMTx4 with its vehicle control (n=4 each). There is also comparison of cells transfected with sc.si. or P1.si.1 after 15 h of 15 dyn.cm−2 in the microfluidic chamber (n=3). Error bars are s.e.m.
Extended Data Figure 7. Coupling to endothelial nitric oxide synthase.
a, Western blot for HUVEC lysates probed with anti-Piezo1 antibody after transfection with Piezo1 siRNA P1.si.1 (on the left) or the control siRNA sc.si. (on the right). Prior to collection of cell lysates, HUVECs were treated with 30 ng.mL−1 VEGF (+) or no VEGF (-) for 10 min. The lysate was probed with anti-Piezo1 antibody, antibody to phosphorylated S1177 in eNOS, anti-β-actin antibody, and antibody to total eNOS protein. Positions of the expected proteins are indicated by the text on the right. The non-specific band at 250 kDa in the anti-Piezo1 blot is highlighted with *, as in Extended Data Figure 2a, b. b, Quantitative data for the down-regulation of total eNOS after transfection of HUVECs with P1.si.1 (n=6). c, Fold-change in S1177 eNOS phosphorylation (p-eNOS) evoked by VEGF (30 ng.mL−1) in HUVECs transfected with control siRNA (sc.si). or Piezo1 siRNA (P1.si.1) (n=3 each). The grey dashed line highlights 1-fold (i.e. no change). d, Western blot for VEGF (30 ng.mL−1) evoked S1177 eNOS phosphorylation (arrow) in aorta. Aorta was dissected from Piezo1+/+ or Piezo1+/− litter-mates and allowed to equilibrate at 37 oC in culture medium without shear stress for 3 h. Aorta was then exposed to VEGF (30 ng.mL−1) (+VEGF) or not (-VEGF) for 10 min, after which lysates were generated. Proteins were probed with antibody to phosphorylation at S1177 in eNOS. The band labeled with ** was not included in the analysis. The blot was also probed with anti-β-actin antibody to test for equal protein loading. e, Mean data for the type of experiment exemplified in (d) (n=5 for each genotype) and presented as in (c). f, Western blotting for HUVEC lysates after transfection with control siRNA (sc.si.) or eNOS siRNAs. The blot was probed with anti-eNOS (total) antibody. g, HUVEC migration to VEGF after incubation with vehicle control, 0.3 mM L-NMMA for 0.5 h, or 48 h after transfection with sc.si. or one of three siRNAs targeted to eNOS (n=3 each; each paired to its own control). h, Data interpretation. Error bars are s.e.m.
Extended Data Figure 8. Endothelial cell alignment to shear stress lacks dependency on nitric oxide but is coupled to calpain.
a, Frequency of HUVEC alignment induced on the orbital shaker. Data for each test condition were normalized to their own control. Test conditions were 0.3 mM L-NMMA (n=3) and transfection with eNOS siRNA (eNOS.si.1) compared with mock transfection (n=4). b, Protein abundances from mass spectrometry analysis for the indicated proteins in 3 Piezo1−/− relative to 3 Piezo1+/+ E10.5 embryos. Calpain-2 and its substrates were less in Piezo1−/− embryos. The effects were relatively specific because more than 1300 of the detected proteins were unchanged by Piezo1 depletion; data for 2 examples (myosin light chain-3 and integrin-β1) are shown. c, Fluorescence images of Piezo1-GFP in a HUVEC before (upper image) and after (lower image) 15 dyn.cm−2 for 50 min. The small solid arrows point to focal adhesion structures at the trailing edge of the cell. Scale bar, 10 μm. Representative of n=4. Error bars are s.e.m.
Supplementary Material
Acknowledgements
The research was supported by research grants from the Wellcome Trust, the Medical Research Council, the Leeds Teaching Hospitals Trust Charitable Foundation, and the British Heart Foundation. BH was supported by a Scholarship from the University of Leeds and the China Scholarship Council. AJH was supported by a BBSRC PhD Studentship. RSY was supported by a Cancer Research UK Clinical Fellowship. LAW was supported by a BBSRC-AstraZeneca PhD Studentship. MAB was supported by a British Heart Foundation Fellowship.
Footnotes
The authors have no competing financial interests.
Reprints and permissions information is available at www.nature.com/reprints.
The mass spectrometry proteomics data have been deposited to the ProteomeXchange Consortium via the PRIDE partner repository (dataset identifier: PXD001099 and DOI 10.6019/PXD001099).
References
- 1.Conway D, Schwartz MA. Lessons from the endothelial junctional mechanosensory complex. F1000 Biology Reports. 2012;4:1. doi: 10.3410/B4-1. [DOI] [PMC free article] [PubMed] [Google Scholar]
- 2.Chiu JJ, Chien S. Effects of disturbed flow on vascular endothelium: pathophysiological basis and clinical perspectives. Physiol Rev. 2011;91:327–387. doi: 10.1152/physrev.00047.2009. [DOI] [PMC free article] [PubMed] [Google Scholar]
- 3.Ando J, Yamamoto K. Flow detection and calcium signaling in vascular endothelial cells. Cardiovasc Res. 2013;99:260–268. doi: 10.1093/cvr/cvt084. [DOI] [PubMed] [Google Scholar]
- 4.Mammoto T, Ingber DE. Mechanical control of tissue and organ development. Development. 2010;137:1407–1420. doi: 10.1242/dev.024166. [DOI] [PMC free article] [PubMed] [Google Scholar]
- 5.Lucitti JL, et al. Vascular remodeling of the mouse yolk sac requires hemodynamic force. Development. 2007;134:3317–3326. doi: 10.1242/dev.02883. [DOI] [PMC free article] [PubMed] [Google Scholar]
- 6.Coste B, et al. Piezo1 and Piezo2 are essential components of distinct mechanically activated cation channels. Science. 2010;330:55–60. doi: 10.1126/science.1193270. [DOI] [PMC free article] [PubMed] [Google Scholar]
- 7.Coste B, et al. Piezo proteins are pore-forming subunits of mechanically activated channels. Nature. 2012;483:176–181. doi: 10.1038/nature10812. [DOI] [PMC free article] [PubMed] [Google Scholar]
- 8.Kim SE, Coste B, Chadha A, Cook B, Patapoutian A. The role of Drosophila Piezo in mechanical nociception. Nature. 2012;483:209–212. doi: 10.1038/nature10801. [DOI] [PMC free article] [PubMed] [Google Scholar]
- 9.Olsson AK, Dimberg A, Kreuger J, Claesson-Welsh L. VEGF receptor signalling - in control of vascular function. Nat Rev Mol Cell Biol. 2006;7:359–371. doi: 10.1038/nrm1911. [DOI] [PubMed] [Google Scholar]
- 10.Bae C, Sachs F, Gottlieb PA. The mechanosensitive ion channel Piezo1 is inhibited by the peptide GsMTx4. Biochemistry. 2011;50:6295–6300. doi: 10.1021/bi200770q. [DOI] [PMC free article] [PubMed] [Google Scholar]
- 11.Song JW, Munn LL. Fluid forces control endothelial sprouting. Proc Natl Acad Sci U S A. 2011;108:15342–15347. doi: 10.1073/pnas.1105316108. [DOI] [PMC free article] [PubMed] [Google Scholar]
- 12.Dolan JM, Kolega J, Meng H. High Wall Shear Stress and Spatial Gradients in Vascular Pathology: A Review. Annals of Biomedical Engineering. 2013;41:1411–1427. doi: 10.1007/s10439-012-0695-0. [DOI] [PMC free article] [PubMed] [Google Scholar]
- 13.Johnson BD, Mather KJ, Wallace JP. Mechanotransduction of shear in the endothelium: basic studies and clinical implications. Vasc Med. 2011;16:365–377. doi: 10.1177/1358863X11422109. [DOI] [PubMed] [Google Scholar]
- 14.Matthews BD, Overby DR, Mannix R, Ingber DE. Cellular adaptation to mechanical stress: role of integrins, Rho, cytoskeletal tension and mechanosensitive ion channels. J Cell Sci. 2006;119:508–518. doi: 10.1242/jcs.02760. [DOI] [PubMed] [Google Scholar]
- 15.Tzima E, et al. A mechanosensory complex that mediates the endothelial cell response to fluid shear stress. Nature. 2005;437:426–431. doi: 10.1038/nature03952. [DOI] [PubMed] [Google Scholar]
- 16.Brakemeier S, Eichler I, Hopp H, Kohler R, Hoyer J. Up-regulation of endothelial stretch-activated cation channels by fluid shear stress. Cardiovasc Res. 2002;53:209–218. doi: 10.1016/s0008-6363(01)00476-x. [DOI] [PubMed] [Google Scholar]
- 17.AbouAlaiwi WA, et al. Ciliary polycystin-2 is a mechanosensitive calcium channel involved in nitric oxide signaling cascades. Circ Res. 2009;104:860–869. doi: 10.1161/CIRCRESAHA.108.192765. [DOI] [PMC free article] [PubMed] [Google Scholar]
- 18.Hartmannsgruber V, et al. Arterial response to shear stress critically depends on endothelial TRPV4 expression. PLoS One. 2007;2:e827. doi: 10.1371/journal.pone.0000827. [DOI] [PMC free article] [PubMed] [Google Scholar]
- 19.Yamamoto K, et al. Impaired flow-dependent control of vascular tone and remodeling in P2X4-deficient mice. Nature Medicine. 2006;12:133–137. doi: 10.1038/nm1338. [DOI] [PubMed] [Google Scholar]
- 20.Zarychanski R, et al. Mutations in the mechanotransduction protein PIEZO1 are associated with hereditary xerocytosis. Blood. 2012;120:1908–1915. doi: 10.1182/blood-2012-04-422253. [DOI] [PMC free article] [PubMed] [Google Scholar]
- 21.Bae C, Gnanasambandam R, Nicolai C, Sachs F, Gottlieb PA. Xerocytosis is caused by mutations that alter the kinetics of the mechanosensitive channel PIEZO1. Proc Natl Acad Sci U S A. 2013;110:E1162–1168. doi: 10.1073/pnas.1219777110. [DOI] [PMC free article] [PubMed] [Google Scholar]
- 22.Li S, et al. The role of the dynamics of focal adhesion kinase in the mechanotaxis of endothelial cells. Proc Natl Acad Sci U S A. 2002;99:3546–3551. doi: 10.1073/pnas.052018099. [DOI] [PMC free article] [PubMed] [Google Scholar]
- 23.Langille BL, Adamson SL. Relationship between blood flow direction and endothelial cell orientation at arterial branch sites in rabbits and mice. Circ Res. 1981;48:481–488. doi: 10.1161/01.res.48.4.481. [DOI] [PubMed] [Google Scholar]
- 24.Balligand JL, Feron O, Dessy C. eNOS activation by physical forces: from short-term regulation of contraction to chronic remodeling of cardiovascular tissues. Physiol Rev. 2009;89:481–534. doi: 10.1152/physrev.00042.2007. [DOI] [PubMed] [Google Scholar]
- 25.Lebart MC, Benyamin Y. Calpain involvement in the remodeling of cytoskeletal anchorage complexes. The FEBS journal. 2006;273:3415–3426. doi: 10.1111/j.1742-4658.2006.05350.x. [DOI] [PubMed] [Google Scholar]
- 26.McHugh BJ, et al. Integrin activation by Fam38A uses a novel mechanism of R-Ras targeting to the endoplasmic reticulum. J Cell Sci. 2010;123:51–61. doi: 10.1242/jcs.056424. [DOI] [PMC free article] [PubMed] [Google Scholar]
- 27.Miyazaki T, Honda K, Ohata H. Requirement of Ca2+ influx- and phosphatidylinositol 3-kinase-mediated m-calpain activity for shear stress-induced endothelial cell polarity. Am J Physiol Cell Physiol. 2007;293:C1216–1225. doi: 10.1152/ajpcell.00083.2007. [DOI] [PubMed] [Google Scholar]
- 28.Arthur JS, Elce JS, Hegadorn C, Williams K, Greer PA. Disruption of the murine calpain small subunit gene, Capn4: calpain is essential for embryonic development but not for cell growth and division. Mol Cell Biol. 2000;20:4474–4481. doi: 10.1128/mcb.20.12.4474-4481.2000. [DOI] [PMC free article] [PubMed] [Google Scholar]
- 29.Zhuang X, Cross D, Heath VL, Bicknell R. Shear stress, tip cells and regulators of endothelial migration. Biochemical Society Transactions. 2011;39:1571–1575. doi: 10.1042/BST20110746. [DOI] [PubMed] [Google Scholar]
- 30.Hahn C, Schwartz MA. Mechanotransduction in vascular physiology and atherogenesis. Nat Rev Mol Cell Biol. 2009;10:53–62. doi: 10.1038/nrm2596. [DOI] [PMC free article] [PubMed] [Google Scholar]
- 31.van Beijnum JR, Rousch M, Castermans K, van der Linden E, Griffioen AW. Isolation of endothelial cells from fresh tissues. Nature protocols. 2008;3:1085–1091. doi: 10.1038/nprot.2008.71. [DOI] [PubMed] [Google Scholar]
- 32.Wisniewski JR, Zougman A, Nagaraj N, Mann M. Universal sample preparation method for proteome analysis. Nature Methods. 2009;6:359–362. doi: 10.1038/nmeth.1322. [DOI] [PubMed] [Google Scholar]
- 33.Thingholm TE, Jorgensen TJ, Jensen ON, Larsen MR. Highly selective enrichment of phosphorylated peptides using titanium dioxide. Nature Protocols. 2006;1:1929–1935. doi: 10.1038/nprot.2006.185. [DOI] [PubMed] [Google Scholar]
- 34.Babaei F, et al. Novel Blood Collection Method Allows Plasma Proteome Analysis from Single Zebrafish. Journal of Proteome Research. 2013;12:1580–1590. doi: 10.1021/pr3009226. [DOI] [PubMed] [Google Scholar]
- 35.Huang da W, Sherman BT, Lempicki RA. Systematic and integrative analysis of large gene lists using DAVID bioinformatics resources. Nature Protocols. 2009;4:44–57. doi: 10.1038/nprot.2008.211. [DOI] [PubMed] [Google Scholar]
- 36.Warboys CM, et al. Disturbed Flow Promotes Endothelial Senescence via a p53-Dependent Pathway. Arteriosclerosis, Thrombosis, and Vascular Biology. 2014;34:985–995. doi: 10.1161/ATVBAHA.114.303415. [DOI] [PubMed] [Google Scholar]
- 37.Rezakhaniha R, et al. Experimental investigation of collagen waviness and orientation in the arterial adventitia using confocal laser scanning microscopy. Biomechanics and Modeling in Mechanobiology. 2012;11:461–473. doi: 10.1007/s10237-011-0325-z. [DOI] [PubMed] [Google Scholar]
Associated Data
This section collects any data citations, data availability statements, or supplementary materials included in this article.


