Abstract
RATIONALE
Site occupancy measurements using LC/MS are reported throughout the literature. However, site occupancy quantification suffers from ionization bias between modified and unmodified peptides containing the active site. In this study, we explore the MS signal as a function of nonpolar surface area (NPSA) in order to better understand this bias in electrospray response. The correlation between hydrophobicity and LC/MS response was evaluated and applied to study enzyme intermediates in polyketide synthases.
METHODS
Site occupancy methods were developed to study acyltransferase activity. To further evaluate these methods, several standard peptides containing one cysteine residue were modified with alkylation reagents of increasing hydrophobicity to study the MS signal as a function of nonpolar surface area.
RESULTS
A consistent trend in MS response was observed which is dependent on the NPSA of the analyte. An optimal NPSA zone was observed for the peptides studied.
CONCLUSIONS
Nonpolar surface area can be used as metric to determine relative LC/MS response for peptides and evaluate site occupancy measurements.
INTRODUCTION
Polyketides and nonribosomal peptides are two classes of natural products that have found widespread use as therapeutics.[1] Many of these secondary metabolites are built in an assembly-line fashion by megaenzyme complexes referred to as polyketide synthases (PKSs) and nonribosomal peptide synthetases (NRPSs). Polyketides and nonribosomal peptides are built up from smaller building blocks in the form of organic acids and amino acids, respectively. A major goal in synthetic biology is to take advantage of the modular, biosynthetic machinery found within natural synthases to build biosynthetic products for rational drug design. However, taking advantage of the natural enzymatic processes not only necessitates a solid understanding of the biosynthetic mechanisms found in PKSs but also a realization of the potential to incorporate chemical moieties not found in nature. High-resolving power, mass spectrometry-based techniques have been used for investigating PKS modules in Yersinia pestis,[2] NRPS modules in Bacillus licheniformis,[3] the biosynthesis of microcin B17,[4] lacticin 481,[5] thiamin B,[6] and many other systems.[7–12] Koryakina et al. demonstrated that promiscuous malonyl-CoA synthetase mutants can be utilized to synthesize a broad range of malonyl-CoA extender units, many of which have no known natural biosynthetic routes within polyketide-producing organisms.[13, 14] Furthermore, the same group demonstrated the first reported poly specific trans-acyltransferase (trans-AT) which has the ability to utilize non-natural extender units to acylate carrier proteins, and also revealed extender unit promiscuity of the terminal module from the erythromycin polyketide synthase, DEBS.[14, 15] This work and that of others[16–18] highlight the potential for ATs to incorporate non-natural substrates into novel biosynthetic molecules that have yet to be discovered.
One analytical challenge is to accurately characterize enzyme activity toward both natural and non-natural substrates regardless of whether the extender unit is transferred to the enzyme’s native acyl carrier protein (ACP). This necessitates developing methodologies for probing the ATs directly, many of which can be quite large in size and difficult to resolve using LC/MS. Proteolytic digestion of the ATs followed by LC/MS or LC/MS/MS analysis has been employed previously to study site occupancy of similar biological systems.[2, 19, 20] Although, this is a powerful approach to accurately identify enzyme intermediates, ionization biases between modified and unmodified forms of the active sites are not addressed in the aforementioned studies. The differences in electrospray response between peptides modified with different chemical moieties can drastically affect their MS signal[21–23] and, as a result, the accuracy of site occupancy values derived from chemically distinct species are questionable even if consistent replicate results are reported. In addition, the sample matrix can affect different analytes to varying degrees in electrospray ionization.[24–26] Previous reports suggest that more hydrophobic analytes generally have higher ESI responses.[27] Hydrophobic derivatization of hydrophilic analytes, such as peptides, nucleic acids, and glycans has been shown to significantly improve MS response, and this is attributed to higher surface activity and more efficient desorption from electrospray droplets.[28–31] It has also been shown that adding too much “hydrophobic character” to an analyte can be detrimental to the MS signal[22]; however, it is not clear if this is due to poorer ionization, poorer solubility, or sample loss resulting from possibly irreversible binding to the hydrophobic stationary phases typically employed in reverse-phase chromatography.
Many techniques have been developed to try to quantify hydrophobicity between different amino acids and peptides.[32–34] In this study, we use nonpolar surface area (NPSA) as a metric of hydrophobic character, which has been reported previously to quantify the relative hydrophobicity of different molecules.[21, 22, 29, 35] In addition, we report the combined use of filter-aided sample preparation (FASP) combined with consecutive proteolytic digestion and LC/MS/MS to characterize the activity of two trans-AT enzymes, DSZS-AT from disorazole synthase (DSZS)[36] and KirCll-AT from kirromycin biosynthesis (KirCll).[37] Furthermore, we build upon previous studies by evaluating the change in MS signal as a function of NPSA in order to evaluate the accuracy of these semi-quantitative site occupancy strategies. By targeting peptides with a single cysteine residue using alkylation reagents, we study the change in MS signal between standard peptides modified with tags of increasing NPSA.
EXPERIMENTAL
General
All materials and reagents were of the highest grade possible and purchased from Sigma (St. Louis, MO, USA) unless otherwise stated. Isopropyl β-D-thiogalactoside (IPTG) was purchased from Calbiochem (Gibbstown, NJ, USA). Bacterial strain E. coli BL21(DE3) pLysS competent cells were purchased from Promega (Madison, WI, USA). Primers were purchased from Integrated DNA Technologies (Coralville, IA, USA). Plasmid pET28a-MatB was prepared as previously described.[13]
Synthesis of acyl-CoAs by MatB
Synthesis of acyl-CoAs was carried out as described previously.[14] Briefly, 50 μL reaction mixtures containing 100 mM sodium phosphate (pH 7), MgCl2 (2 mM), ATP (4 mM), coenzyme A (4 mM), malonate or analog (16 mM), and wild-type or mutant MatB (10 μg) were incubated at 25 °C. Reactions were quenched after 3 h incubation with an equal volume of ice-cold methanol, centrifuged at 10,000 g for 10 min, and the cleared supernatants were used for HPLC analysis on a Varian ProStar HPLC system (Palo Alto, CA, USA) with a Pursuit XRs C18 column (250 × 4.6 mm, Varian Inc.). A series of linear gradients was developed from 0.1% TFA (A) in water to methanol (HPLC grade, B) using the following values: 0–32 min, 80% B; 32–35 min, 100% A. The flow rate was 1 mL/min, and peaks were generated from the UV absorbance measured at 254 nm. The malonate analog and the acyl-CoA product HPLC peak areas were integrated, and the conversion calculated as a percentage of the total peak area. Product identity was confirmed by LC/MS.
Expression and purification of DSZS and KirCII
The gene for DSZS[38] from Sorangium cellulosum was synthesized by GeneScript and subcloned into pET28a via NcoI and HindIII restriction sites. DSZS was over-expressed in E. coli BL21(DE3) as a C-terminally His6-tagged fusion protein and purified as previously described.[38] The kirromycin trans-AT KirCII, harbored in pET52 3C/LIC[37], was over-expressed in Rosetta2(DE3) pLysS as an N-terminally His6-tagged fusion protein and purified as previously described.[37]
DSZS Active Site Occupancy
15 μL of acyl-CoA (4 mM, ~60 nmol), 3.75 μL of 10× buffer, 3.75 μL of DSZS (~350 pmol), and 15 μL of water were allowed to react at room temperature in a Vivacon 30 kDa molecular weight cutoff (MWCO) filter (Sartorius Stedim Biotech, Goettingen, Germany). To quench the reaction, solutions were centrifuged at 11,000 × g, for 10 min: 50 μL of 100 mM NH4HCO3 was added to the MWCO filter and centrifuged at 11,000 × g for 10 min. This step was repeated one more time. The flow-through was discarded and 1 μg of GluC protease (New England Biolabs, Ipswich, MA, USA) in 100 mM NH4HCO3 was added to the MWCO filter. TCEP at pH 7.5 was added to give a final concentration of 2 mM for a total reaction volume of ~45 μL. Protein digestion was allowed to proceed for 40 min at 37 °C. Samples were centrifuged for 10 min at 11,000 × g to elute the peptides.
KirCll Active Site Occupancy
5 μL of acyl-CoA (8 mM, ~40 nmol), 3.75 μL of 10× buffer, 10 μL of KirCll (~20 pmol), and water were added and mixed to bring the reaction volume to 37.5 μL. Reactions were carried out in a 30 kDa MWCO filter at room temperature and quenched by centrifugation at 11,000 × g for 10 min. For digestion, 1 μg of trypsin (Sigma) in 100 mM NH4HCO3 was added to the MWCO filter. TCEP at pH 7.5 was added to a final concentration of 2 mM with a total reaction volume of 35 μL. Protein digestion was allowed to proceed for 30 min at 37 °C. Peptides were eluted by centrifugation for 10 min at 11,000 × g. For screening KirCll, the peptide solution was further digested by adding 1 μg of GluC and allowing the digestion to proceed for an additional 30 min at 37 °C. The solution was then placed in a new MWCO filter and centrifuged at 11,000 × g for 10 min to isolate the peptides from any intact GluC. Samples were frozen at −20 °C until LC/MS/MS analysis.
The eluted peptides were analyzed using nLC/MS/MS with a quadrupole Orbitrap (Q Exactive) mass spectrometer (Thermo Fisher, San Jose, CA, USA) and an nLC II system (Thermo Fisher). Analytical columns (15 cm) and traps (5 cm) were packed in-house with Magic C18Q (5 μm particle, 200 Å pore size: Microm BioResources, Auburn, CA, USA) using PicoFrit (75 μm i.d.) and IntegraFrit (100 μm i.d.) capillaries, respectively, (New Objective, Woburn, MA, USA). The mobile phase solvents (Burdick and Jackson, Muskegon, MI, USA) were acetonitrile, water, and formic acid, with mobile phase A having the ratio 2:98:0.2, respectively, and mobile phase B having the ratio 98:2:0.2, respectively. Gradient elution was employed starting at 10% B and increasing to 35% B over 38 min. The gradient was adjusted to 95 % B for 10 min and re-equilibrated to 10 % B for 10 min. Each reaction was analyzed separately with two blank injections between each reaction to minimize analyte carryover. Data-dependent acquisition was employed utilizing up to 8 MS/MS acquisitions for every MS acquisition. AGC targets were set to 1E6 and 5E4 for MS and MS/MS, respectively. All data were analyzed manually by searching for all potential m/z values corresponding to predicted peptide sequences. Peptide sequences and modified residues were verified with LC/MS/MS data.
Alkylation Reactions with Model Peptides
Pure peptides, VCTLELFSPK and ISLPCQNQPDR, each containing one cysteine residue were purchased from Mayo Clinic Proteomics Research Center (Rochester, MN, USA) and utilized as received. The purity of each peptide was verified by LC-/MS/MS. Each peptide was alkylated with one of five different alkylation reagents in five individual tubes. Briefly, approximately 1000 pmol of pure peptide was dissolved in 90:10 Tris-HCl (pH 8.0):acetonitrile and reduced with a 10-fold molar excess of DTT at 56 °C for 20 min. This was followed by the addition of a 40-fold molar excess of alkylation reagent, and this solution was allowed to react for 1 hour at 37 °C. The alkylation reagents were dissolved in 80:20 acetonitrile:buffer to aid in solubility. Following the alkylation reactions, the completion of each reaction was verified by LC/MS/MS. Each tagged peptide was then combined in equimolar amounts and frozen at −80 °C and thawed just prior to LC/MS/MS analysis. Three replicates were injected for each sample, and a minimum of two blanks were injected between samples.
LC conditions for the pure peptide samples were as follows. The mobile phases were identical to the site occupancy measurements described above. An isocratic elution of 35 % B was held for 15 minutes before ramping to 95 % B for five minutes, then re-equilibrating to 35% B. An isocratic elution was employed so that the solvent composition would remain static as all the tagged peptides eluted. All the tagged peptides were verified to elute before the ramp up to 95 % B. Full MS data was collected at 70,000FWHM @ m/z 200. The MS AGC setting was set to 1 × 10⁶, and the maximum allowed ionization time was set to 30 ms. The ion chromatograms for each tagged peptide were extracted and integrated to obtain the MS signal as an area under the curve.
Alkylation Reactions with Bovine Serum Albumin Peptides
For the BSA peptides, the alkylation reaction was the same as described above except that a BSA digest was substituted for the pure peptide solution. Approximately 31 pmol of BSA was used in each reaction to yield ~1000 pmol of cysteine sites in each reaction. The BSA digest was reduced and alkylated as described above. The completion of the alkylation reactions was verified by LC/MS/MS for all the peptides used in this study. Each reaction was then combined in equimolar amounts and frozen at −80 °C and thawed just prior to LC/MS/MS analysis. Four replicates were injected and a minimum of two blanks were injected between samples.
The LC conditions for the BSA digest were modified to account for the more complex sample. A shallow gradient was employed going from 5 % B to 8 % B in the first two minutes, and then rising to 25 % B over the next 68 min. A ramp to 95 % B was used for 8 minutes before re-equilibrating to 5 % B. As described above, all the quantitative values for all the tagged peptides were obtained with MS data using extracted ion chromatograms for each of the tagged peptides and integrating the area under the curve.
Nonpolar Surface Area
The nonpolar surface area for peptides and alkylation tags was calculated by summing the surface area of nonpolar atoms as previously described.[21, 29, 35] The values were calculated in Microsoft Excel based on bond lengths, van der Waals radii, and basic geometry.[22]
RESULTS AND DISCUSSION
Acyltransferase Digestion Using Filter-Aided Sample Preparation (FASP)
Filter-aided sample preparation (FASP) has been previously described.[39, 40] We reasoned that FASP would be beneficial for site occupancy measurements since a molecular weight cutoff filter would allow the reaction to proceed in the filtration device and quenching could be achieved by centrifugation as demonstrated previously.[2] During centrifugation, the small acyl-CoA molecules would be separated from the much larger acyltransferases which would remain on top of the filter. Moreover, the digestion of KirCll required multiple proteases in order to detect the peptide containing the active site, and FASP allowed consecutive digestions to be performed on the same sample.[41] The sample workflow is shown in Fig. 1A and the values are shown in Fig. 1B.
Figure 1.
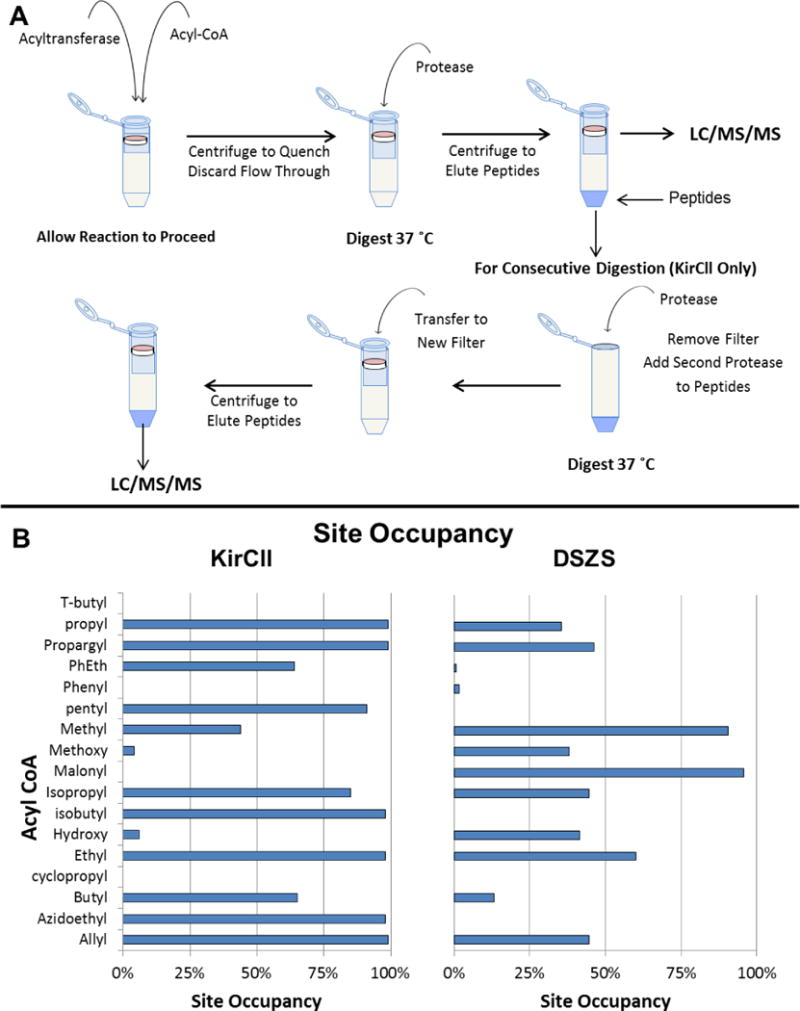
A) Sample preparation flow chart using FASP. DSZS was prepared using a single proteolytic digestion. KirCll was prepared using a consecutive digestion technique. B) Site occupancy values measured with each enzyme.
Different digestion protocols had to be developed for each of the acyltransferases, DSZS and KirCll. In addition, certain constraints had to be overcome which are often not of any concern in traditional bottom-up workflows. For example, these small extender units in PKSs are attached via ester and thioester linkages to acyltransferases and carrier proteins, respectively, and can be hydrolyzed using dithiothreitol (DTT).[42, 43] DTT is often used to reduce disulfide bonds in order to denature proteins to aid in more complete digestion. For this reason, we omitted DTT and used tris(2-carboxyethyl)phosphine (TCEP), which has been used previously for similar measurements,[2, 19, 20, 44] to aid in protein denaturation. In addition, these enzyme-mediated modifications within PKSs are not stable for long periods of time which necessitated short digestion times and higher protease:protein ratios for more accurate results[2, 20].
For DSZS, we found that using GluC yielded a peptide containing the active site as shown in Fig. 2. GluC cleaves on the C-terminal side of glutamic acid (E). However, the N-terminus of the DSZS peptide containing the active site has three consecutive glutamic acid residues, and as a result, three cleavage products were detected from GluC cleavage at the three different positions on the N-terminus (Fig. 2). The site occupancy values were consistent for each of the GluC cleavage products. For KirCll, we tested 3 different proteases and found that none of them yielded a peptide containing the active site (Supplementary Material, Figs. S1–S3) even when screening up to 6 missed cleavages. As a result, a two-protease, consecutive digestion was employed which yielded a “hybrid” peptide containing the active site with the N-terminus of the peptide having a tryptic cleavage site and the C-terminus having a GluC cleavage site (Fig. 3).
Figure 2.
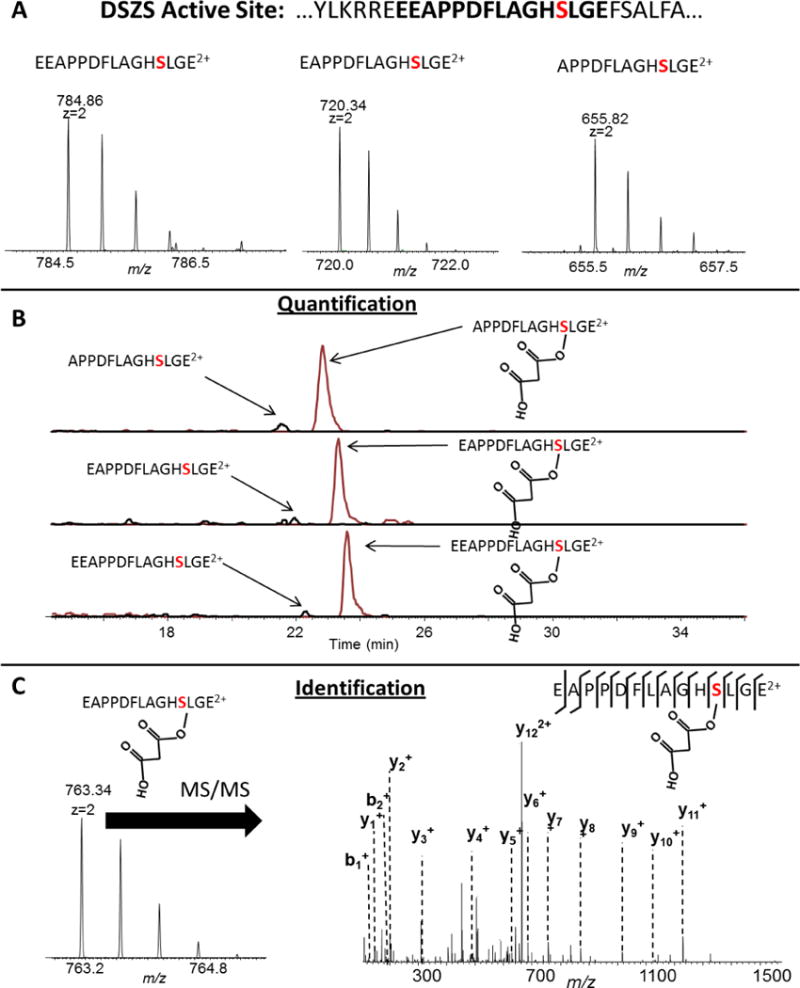
The results from DSZS digestion followed by LC/MS/MS: A) Three unique peptides were identified with the active site due to three consecutive glutamic acid residues on the N-terminus. B) All three peptides could be used for quantification by integrating the area under the extracted ion chromatograms. C) The modification was localized with amino acid resolution using MS/MS.
Figure 3.
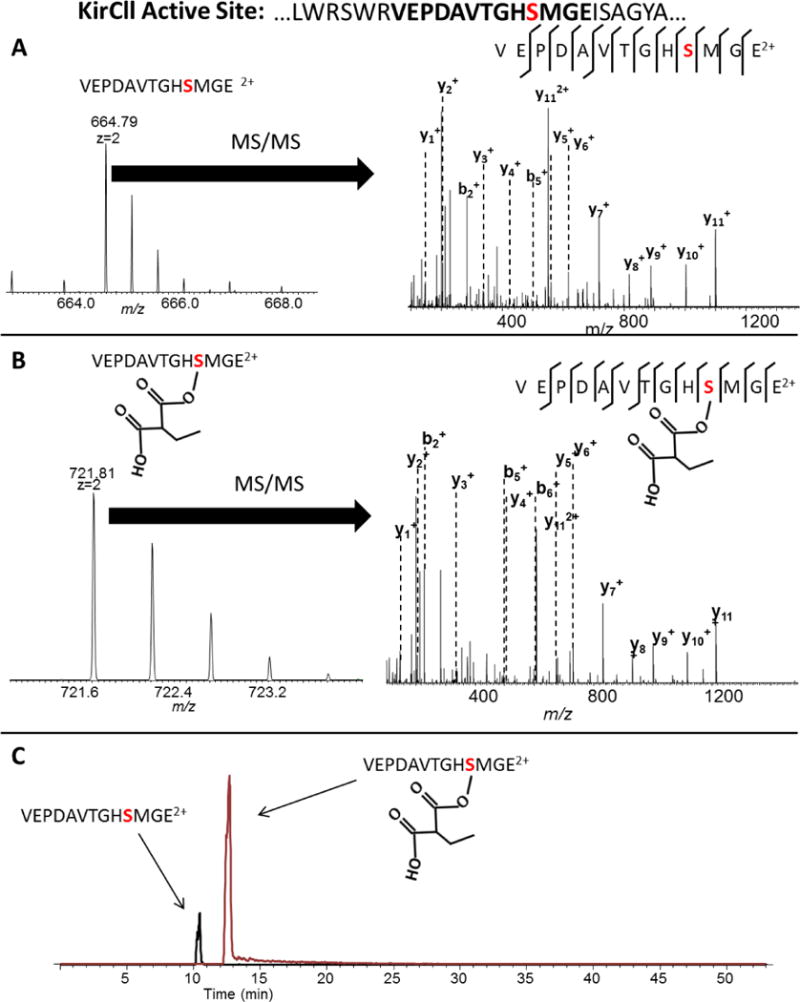
The active site of KirCll was identified by using a consecutive proteolytic digestion with both trypsin and GluC. The tryptic cleavage site was located on the N-terminus and the GluC cleavage site located on the C-terminus. An example of sequencing the A) unmodified and B) modified peptide using MS/MS. C) Quantification is achieved using extracted ion chromatograms of the unmodified and modified peptide.
Determining Site Occupancy
As a proof of concept of demonstrating the FASP method, the two ATs were screened with a variety of different acyl-CoA malonate derivatives with substitutions in the C2 position. Surprisingly, the activity of the ATs displayed toward both natural and unnatural substrates was not constrained only toward their natural substrates. To obtain an estimated value for site occupancy for each of the malonate derivatives, quantitative measurements were calculated with extracted ion chromatograms from the MS data of the modified and unmodified peptides, as shown in Equation 1.
| (1) |
Similar approaches have been used to determine site occupancy of various modifications of proteins.[2, 20, 45, 46] Although this is an effective method for screening enzyme activity and producing confident identifications of modified peptides using MS/MS, quantitative measurements suffer from ionization bias due to differences in ionization efficiency between the modified and unmodified peptide. The ionization bias due to a small modification can be very dramatic. Therefore, we sought to more thoroughly examine the effect of ionization bias on modifications made to peptides.
Ionization Efficiency as Function of Hydrophobicity
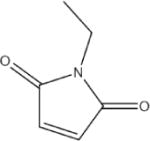
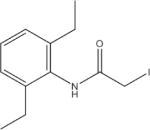
We sought to estimate the hydrophobicity in the analytes in this study by finding the nonpolar surface area (NPSA) and correlating this to electrospray response. This calculation has been discussed previously.[22, 35, 47, 48] The NPSA calculation involves calculating the surface area of nonpolar atoms using van der Waals radii values. To test the effect of adding hydrophobicity to peptides via small modifications, we used peptides which contained only one cysteine residue and alkylated them with iodoacetamide derivatives. Alkylation of cysteine residues is a common practice in quantitative, bottom-up proteomic workflows as this reaction is fast, efficient, and goes to completion readily. Experiments have been performed in our laboratory to ensure the prevention of “over-alkylation”[21–23], and we used optimized protocols to carry out all alkylation reactions with the reagents in Table 1. We chose two common alkylation reagents, IAM and NEM, and then chose additional commercially available reagents based on derivatives of IAM that would further increase the NPSA of peptides thereby providing a “gradient” of hydrophobicity which can be evaluated with MS.
Table 1.
Alkylation reagents of increasing hydrophobicity
| Alkylation Agent | NPSA(Å2) | ||
|---|---|---|---|
| Tag 1 |

|
2-lodoacetamide (IAM) | 20 |
| Tag 2 |
|
N-Ethylmaleimide (NEM) | 77 |
| Tag 3 |

|
N-(Tert-Butyl)-2-lodoacetamide (NTB) | 107 |
| Tag 4 |

|
N-(2,4-Dimethylphenyl)-2-lodoacetamide (NDMP) | 145 |
| Tag 5 |
|
N-(2,6-Diethylphenyl)-2-lodoacetamide (NDEP) | 230 |
Model Peptides Modified with Alkylation Reagents
Figure 4A shows the workflow for the tagging reaction used in this study. A pure peptide was aliquoted into separate reactions and each reaction was analyzed separately to ensure complete alkylation before recombining tagged peptides in equimolar ratios for LC/MS/MS analysis. An isocratic gradient was used to keep the droplet composition consistent during the electrospray process. Two different peptides, each containing one cysteine residue, were analyzed. Peak area vs concentration regression curves are plotted for VCTLELFSPK2+ and ISLPCQNQPDR2+ in Figs. 4B and 4D, respectively. These figures show a linear increase in abundance for each tagged peptide as more material is loaded onto the column. Interestingly, the addition of any NPSA causes a decrease in MS response for VCTLELFSPK2+ for each of the tags relative to IAM. This trend is consistent with different amounts injected onto the column as shown in Fig. 4C. Tag 2, tag 3, tag 4, and tag 5 increase the NPSA of VCTLELFSPK2+ by 8, 13, 19, and 31 %, respectively, relative to the IAM-alkylated peptide (Fig. 4C). Moreover, each tag further reduces the MS response as NPSA increases, with tag 5 decreasing the MS response by 99 % relative to the IAM-alkylated peptide.
Figure 4.
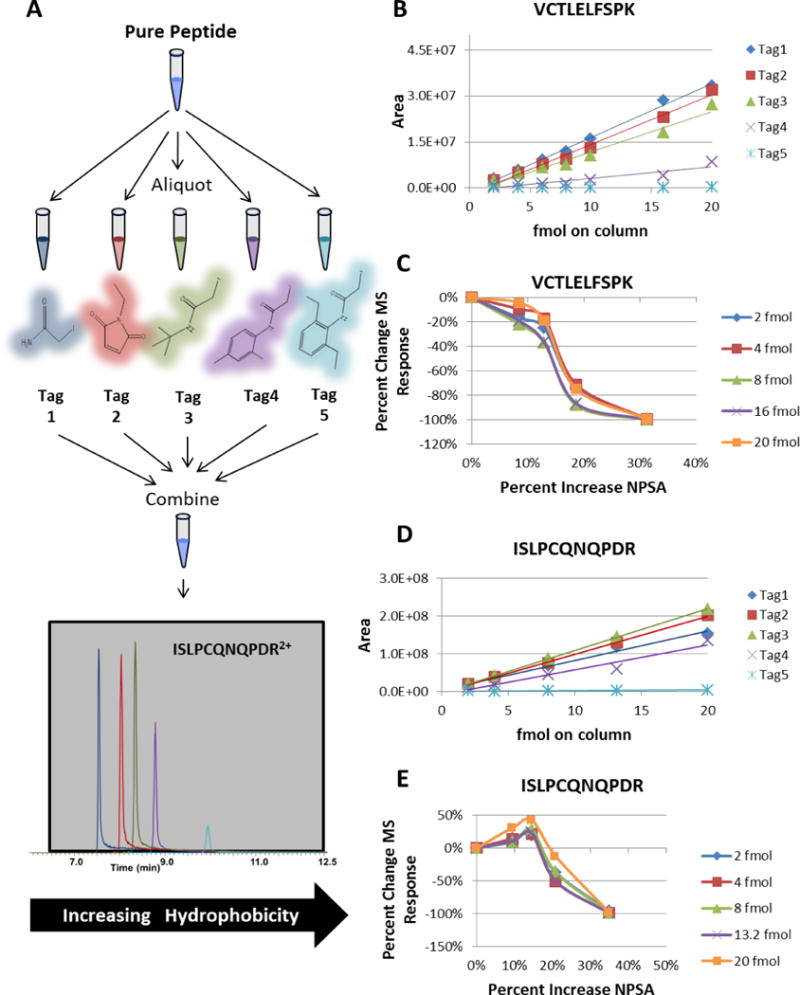
A) The sample workflow for the tagging reactions. B) Average peak areas plotted versus different loading amounts for VCTLELFSPK modified with each tag. C) The percentage change in MS signal as a function of percentage change of NPSA for VCTLELFSPK. D) Average peak areas plotted versus different loading amounts for ISLPCQNQPDR modified with each tag. E) The percentage change in MS signal as a function of percentage change of NPSA for ISLPCQNQPDR.
ISLPCQNQPDR2+ displays a slightly different trend. Figures 4D and 4E indicate that ISLPCQNQPDR2+ alkylated with tag 3 has the optimal response over a range of concentrations. Tag 2, tag 3, tag 4, and tag 5 increase the NPSA of ISLPCQNQPDR2+ by 9, 14, 21, and 35 %, respectively, relative to the IAM-alkylated peptide. On average, tag 2 increases the MS response by 16 % relative to tag 1 while tag 3 increases the MS response by 27 % relative to the tag 1. However, the MS response decreases by 37 % and 98 % with tag 4 and tag 5, respectively, relative to tag 1. These data clearly show that different trends can result from modifying different peptides using identical tags. Taken together, these data also suggest that adding hydrophobic modifications can either increase or decrease the MS signal.
Peptides Derived from Bovine Serum Albumin
The results from using two commercially pure peptides were interesting, yet it was difficult to build a model correlating hydrophobicity with MS signal using only two peptides especially since different trends were observed between the two peptides. As a result, we used bovine serum albumin (BSA) as source of additional peptides containing a single cysteine residue. BSA contains 35 cysteine residues and, upon digestion with trypsin, we could identify twelve tryptic peptides that contained a single cysteine residue. Each of the twelve peptides was alkylated with five different reagents which yielded 60 additional data points to further assess the effect of hydrophobicity on MS response. Following the workflow outlined in Fig. 4A, a BSA digest was substituted for the pure peptide solution and was subsequently aliquoted, tagged, and recombined. This tagging scheme was chosen to ensure that each tagging reaction contained equimolar amounts of each of the twelve peptides regardless of digestion efficiency between the different peptides. The gradient was modified and lengthened to account for the added sample complexity. As before, each reaction mixture was analyzed by LC/MS/MS individually to ensure that the alkylation reaction went to completion.
Each of the twelve peptide sequences and their MS abundance as a function of NPSA are shown in Fig. 5A. For simplicity, these peptides will be referred to BSA_1 through BSA_12. A clear trend emerged from the peptides that we could detect. First, there seemed to be an optimal NPSA zone for maximum MS abundance. The peptides that had the most LC/MS response resided in the NPSA region of 500 – 700 Å2 as shown in the shaded grey region in Fig. 5A. This is an interesting observation as it was observed using peptides with varied amino acid compositions, length, and presumably varied conformations in solution. It is important to note that within the shaded region the abundances of the different peptides varied substantially, suggesting that factors other than the total NPSA are affecting the MS response of the different peptides. Such factors could include variable digestion efficiency between different cleavage sites or ion suppression/enhancement due to matrix effects (co-eluting species). However, there is a more general and consistent trend observed among the peptides, which all show an increase in abundance when modified with more NPSA if the NPSA is located in the region of ≤500 Å2. Conversely, if the peptide is relatively more hydrophobic, as indicated by a higher NPSA value (≥700 Å2), and more NPSA is added, a decrease in abundance is observed. This effect is augmented if the peptide is very hydrophobic as shown in the inset of Fig. 5A. BSA_7, BSA_9, and BSA_10 are the most hydrophobic peptides from the BSA digest and lose MS abundance rapidly as more NPSA is added.
Figure 5.
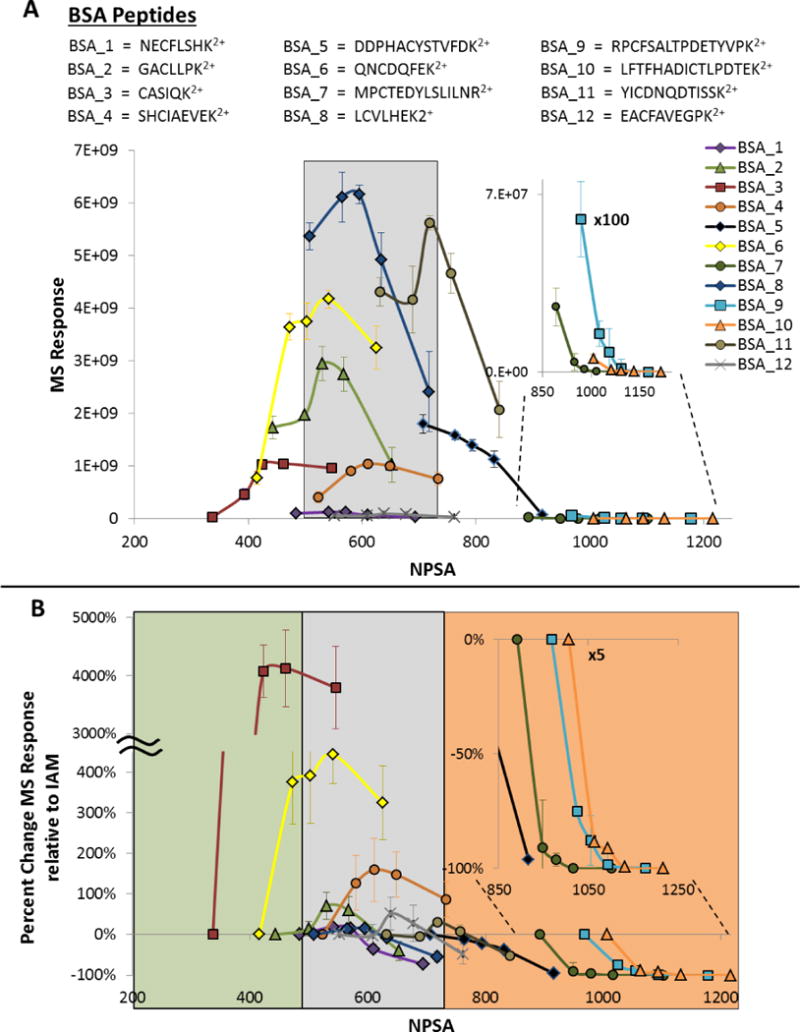
A) All twelve BSA peptide sequences and their MS abundance as a function of NPSA. B) All twelve BSA peptides showing the relative change in MS signal relative to the IAM-tagged peptide. The legend in panel A represents peptides in both plots.
Figure 5B illustrates this effect more clearly as it shows the relative change in MS abundance relative to the IAM-tag as a function of absolute NPSA. Since all data points are relative to IAM, the first data point of each peptide is set to 0. BSA_3 is the most hydrophilic peptide from the BSA digest, as indicated by the smallest NPSA value, and has the most pronounced change in abundance. Tag 2, tag 3, tag 4, and tag 5 increased the abundance of BSA_3 by 1646, 4073, 4129, and 3795 %, respectively. Moreover, at the far extreme end of the NPSA scale, the downward trend is quite substantial for very hydrophobic peptides as shown clearly in the inset in Fig. 5B. For example, the decrease in abundance when going from tag 1 to tag 2 is 91, 75, and 88 % for peptides BSA_7, BSA_9, and BSA_10, respectively. These data suggest that an increase in NPSA for very hydrophobic peptides is more detrimental to the MS signal. However, the effect is the opposite for the most hydrophilic peptides that we detected. The MS signal increases substantially for the two most hydrophilic peptides, BSA_3 and BSA_6. Taken together, these data indicate a possible NPSA zone that is optimal for MS abundance. Peptides with NPSA below the optimal NSPA zone will increase in abundance if modified with a relatively small amount of NPSA presumably due to better ionization efficiency. Very hydrophobic peptides will decrease drastically as NPSA is added presumably due to poorer solubility in the mostly aqueous solvent. Peptides within the optimal NPSA zone will fluctuate in both the positive and the negative direction as the NPSA area changes, yet to a lesser degree than either very hydrophilic and very hydrophobic peptides.
Applying NPSA to Site Occupancy Measurements in Polyketide Biosynthesis
Ideally, site occupancy measurements would be accurate if the modified and unmodified analytes yielded similar MS responses when present at equimolar amounts. Ionization efficiency is a major factor in determining MS response. Hydrophilic molecules derivatized with hydrophobic tags have been shown to display increased MS response due to increased ionization efficiency. However, the data in Figs. 5A and 5B suggest that there is an upper limit where the MS response starts to suffer when the NPSA reaches a particular point using the LC conditions typically employed in proteomic workflows. This could be due to a lower ionization efficiency or poor solubility in aqueous mobile phase. These data provide a model to predict relative MS response based on NPSA. Table 2 displays the peptides used in site occupancy measurements for two different acyltransferases involved in polyketide biosynthesis. Although site occupancy values were determined for each extender unit for each AT, the values may be accurate, under representative or over representative of the true site occupancy due to ionization or solubility biases. In order to try to obtain more accurate values, we used data from Figs. 5A and 5B to predict whether or not extender unit modifications would bias the modified peptide in a particular direction. Table 2 displays the NPSA values for the modified peptides shaded in either grey or orange color. The orange shading represents modified peptides that would be under representative of the true site occupancy based on data obtained from the BSA peptides. The peptides shaded grey in Table 2 are difficult to predict based on our data set and could be either under representative, over representative, or accurately reflect the true site occupancy. Interestingly, the vast majority of the modified peptides in Table 2 should have relatively lower MS responses than the unmodified peptides. This suggests that most of the site occupancy values that we obtained are under representative of the true value.
Table 2.
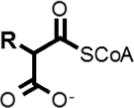
Calculated nonpolar surface area of peptides used for site occupancy measurements
|
|||||
|---|---|---|---|---|---|
|
| |||||
| KirCII | DSZS | DSZS | DSZS | ||
|
| |||||
| Unmodified NPSA(Å2): | VEPDAVTGHSMGE 626 |
APPDFLAGHSLGE 690 |
EAPPDFLAGHSLGE 736 |
EEAPPDFLAGHSLGE 782 |
|
|
| |||||
| Extender Unit (R) | NPSA (Å2) | NPSA (Å2) of Modified Peptides | |||
| 1 hydroxy | 8 | 634 | 698 | 744 | 790 |
|
|
|||||
| 2 malonyl (H) | 19 | 645 | 709 | 755 | 801 |
|
|
|||||
| 3 methoxy | 38 | 664 | 728 | 774 | 820 |
|
|
|||||
| 4 methyl | 38 | 664 | 728 | 774 | 820 |
|
|
|||||
| 5 azidoethyl | 46 | 672 | 736 | 782 | 828 |
|
|
|||||
| 6 propargyl | 49 | 675 | 739 | 785 | 831 |
|
|
|||||
| 7 cyclopropyl | 53 | 679 | 743 | 789 | 835 |
|
|
|||||
| 8 ethyl | 57 | 683 | 747 | 793 | 839 |
|
|
|||||
| 9 allyl | 71 | 697 | 761 | 807 | 853 |
|
|
|||||
| 10 isopropyl | 76 | 702 | 766 | 812 | 858 |
|
|
|||||
| 11 propyl | 76 | 702 | 766 | 812 | 858 |
|
|
|||||
| 12 phenyl | 84 | 710 | 774 | 820 | 866 |
|
|
|||||
| 13 butyl | 95 | 721 | 785 | 831 | 877 |
|
|
|||||
| 14 isobutyl | 95 | 721 | 785 | 831 | 877 |
|
|
|||||
| 15 t-butyl | 95 | 721 | 785 | 831 | 877 |
|
|
|||||
| 16 pentyl | 114 | 740 | 804 | 850 | 896 |
|
|
|||||
| 17 phenylethyl | 122 | 748 | 812 | 858 | 904 |
CONCLUSION
We developed two methods for evaluating site occupancy of various acyl-CoA extender units with two trans-ATs using FASP, a consecutive digestion scheme, and LC/MS/MS analysis. These measurements provide semi-quantitative results due to ionization biases between modified and unmodified peptides. For this reason, studies were designed to evaluate the effect on the MS response. Peptides modified with tags of increasing nonpolar surface area (NPSA) were evaluated by measuring the MS response. A consistent trend was observed. All peptides with <500 Å2 of total NPSA displayed an increase in the MS response when modified with more nonpolar surface area. Peptides with a NPSA between 500 and 700 Å2 showed variable responses (both positive and negative) when modified with more NPSA. All peptides with a NPSA >700 Å2 showed a decreased MS response when modified with more NPSA. These results indicate there is an optimal NPSA zone where the MS response is maximized. More importantly, these data clearly show that relatively small modifications can potentially have a significant effect on the MS signal. Surprisingly, we found that for our application, the NPSA data strongly suggests that the site occupancy values obtained were under representative for the majority of measurements made using the two trans-AT enzymes, KirCll and DSZS. More broadly, this study suggests that NPSA can be helpful when choosing surrogate peptides for absolute quantification, derivatization reagents for analytes, or proteases for targeted studies which will affect peptide chemistry and therefore ionization and solubility characteristics.
Supplementary Material
Acknowledgments
The authors would like to gratefully acknowledge funding support from National Institutes of Health (GM104258-01 to G.J.W), the W. M. Keck Foundation, and North Carolina State University. The authors would like to thank the Biological Core Instrumentation Facility in the Department of Chemistry at North Carolina State.
Footnotes
This article contains three additional supplementary Figures (S1–S3).
LITERATURE CITED
- 1.Walsh CT. Polyketide and nonribosomal peptide antibiotics: Modularity and versatility. Science. 2004;303:1805. doi: 10.1126/science.1094318. [DOI] [PubMed] [Google Scholar]
- 2.Mazur MT, Walsh CT, Kelleher NL. Site-specific observation of acyl intermediate processing in thiotemplate biosynthesis by Fourier transform mass spectrometry: The polyketide module of yersiniabactin synthetase. Biochemistry. 2003;42:13393. doi: 10.1021/bi035585z. [DOI] [PubMed] [Google Scholar]
- 3.Hicks L, Weinreb P, Konz D, Marahiel MA, Walsh CT, Kelleher NL. Fourier-transform mass spectrometry for detection of thioester-bound intermediates in unfractionated proteolytic mixtures of 80 and 191 kDa portions of Bacitracin A synthetase. Anal Chim Acta. 2003;496:217. [Google Scholar]
- 4.Kelleher NL, Hendrickson CL, Walsh CT. Posttranslational heterocyclization of cysteine and serine residues in the antibiotic Microcin B17: Distributivity and directionality. Biochemistry. 1999;38:15623. doi: 10.1021/bi9913698. [DOI] [PubMed] [Google Scholar]
- 5.Xie LL, Miller LM, Chatterjee C, Averin O, Kelleher NL, van der Donk WA. Lacticin 481: In vitro reconstitution of lantibiotic synthetase activity. Science. 2004;303:679. doi: 10.1126/science.1092600. [DOI] [PubMed] [Google Scholar]
- 6.Park JH, Dorrestein PC, Zhai H, Kinsland C, McLafferty FW, Begley TP. Biosynthesis of the thiazole moiety of thiamin pyrophosphate (Vitamin B1) Biochemistry. 2003;42:12430. doi: 10.1021/bi034902z. [DOI] [PubMed] [Google Scholar]
- 7.Dorrestein PC, Zhai HL, McLafferty FW, Begley TP. The biosynthesis of the thiazole phosphate moiety of thiamin: The sulfur transfer mediated by the sulfur carrier protein ThiS. Chem Biol. 2004;11:1373. doi: 10.1016/j.chembiol.2004.08.009. [DOI] [PubMed] [Google Scholar]
- 8.Zhai HL, Dorrestein PC, Chatterjee A, Begley TP, McLafferty FW. Simultaneous kinetic characterization of multiple protein forms by top down mass spectrometry. J Am Soc Mass Spectrom. 2005;16:1052. doi: 10.1016/j.jasms.2005.02.016. [DOI] [PubMed] [Google Scholar]
- 9.Hicks LM, O’Connor SE, Mazur MT, Walsh CT, Kelleher NL. Mass spectrometric interrogation of thioester-bound intermediates in the initial stages of epothilone biosynthesis. Chem Biol. 2004;11:327. doi: 10.1016/j.chembiol.2004.02.021. [DOI] [PubMed] [Google Scholar]
- 10.McLoughlin SM, Kelleher NL. Kinetic and Regiospecific Interrogation of Covalent Intermediates in the Nonribosomal Peptide Synthesis of Yersiniabactin. J Am Chem Soc. 2004;126:13265. doi: 10.1021/ja0470867. [DOI] [PMC free article] [PubMed] [Google Scholar]
- 11.Miller LM, Mazur MT, McLoughlin SM, Kelleher NL. Parallel interrogation of covalent intermediates in the biosynthesis of gramicidin S using high-resolution mass spectrometry. Protein Science. 2005;14:2702. doi: 10.1110/ps.051553705. [DOI] [PMC free article] [PubMed] [Google Scholar]
- 12.Dorrestein PC, Kelleher NL. Dissecting non-ribosomal and polyketide biosynthetic machineries using electrospray ionization Fourier-Transform mass spectrometry. Natural Product Reports. 2006;23:893. doi: 10.1039/b511400b. [DOI] [PubMed] [Google Scholar]
- 13.Koryakina I, Williams GJ. Mutant Malonyl-CoA Synthetases with Altered Specificity for Polyketide Synthase Extender Unit Generation. Chembiochem. 2011;12:2289. doi: 10.1002/cbic.201100383. [DOI] [PubMed] [Google Scholar]
- 14.Koryakina I, McArthur J, Randall S, Draelos MM, Musiol EM, Muddiman DC, Weber T, Williams GJ. Poly Specific trans-Acyltransferase Machinery Revealed via Engineered Acyl-CoA Synthetases. ACS Chem Biol. 2013;8:200. doi: 10.1021/cb3003489. [DOI] [PubMed] [Google Scholar]
- 15.Koryakina I, McArthur JB, Draelos MM, Williams GJ. Promiscuity of a modular polyketide synthase towards natural and non-natural extender units. Org Biomol Chem. 2013;11:4449. doi: 10.1039/c3ob40633d. [DOI] [PubMed] [Google Scholar]
- 16.Walker MC, Thuronyi BW, Charkoudian LK, Lowry B, Khosla C, Chang MCY. Expanding the Fluorine Chemistry of Living Systems Using Engineered Polyketide Synthase Pathways. Science. 2013;341:1089. doi: 10.1126/science.1242345. [DOI] [PMC free article] [PubMed] [Google Scholar]
- 17.Lowry B, Robbins T, Weng CH, O’Brien RV, Cane DE, Khosla C. In Vitro Reconstitution and Analysis of the 6-Deoxyerythronolide B Synthase. J Am Chem Soc. 2013;135:16809. doi: 10.1021/ja409048k. [DOI] [PMC free article] [PubMed] [Google Scholar]
- 18.Bonnett SA, Rath CM, Shareef AR, Joels JR, Chemler JA, Hakansson K, Reynolds K, Sherman DH. Acyl-CoA Subunit Selectivity in the Pikromycin Polyketide Synthase PikAIV: Steady-State Kinetics and Active-Site Occupancy Analysis by FTICR-MS. Chem Biol. 2011;18:1075. doi: 10.1016/j.chembiol.2011.07.016. [DOI] [PMC free article] [PubMed] [Google Scholar]
- 19.Dorrestein PC, Blackhall J, Straight PD, Fischbach MA, Garneau-Tsodikova S, Edwards DJ, McLaughlin S, Lin M, Gerwick WH, Kolter R, Walsh CT, Kelleher NL. Activity screening of carrier domains within nonribosomal peptide synthetases using complex substrate mixtures and large molecule mass spectrometry. Biochemistry. 2006;45:1537. doi: 10.1021/bi052333k. [DOI] [PMC free article] [PubMed] [Google Scholar]
- 20.Bonnett SA, Rath CM, Shareef AR, Joels JR, Chemler JA, Hakansson K, Reynolds K, Sherman DH. Acyl-CoA subunit selectivity in the pikromycin polyketide synthase PikAIV: steady-state kinetics and active-site occupancy analysis by FTICR-MS. Chem Biol. 2011;18:1075. doi: 10.1016/j.chembiol.2011.07.016. [DOI] [PMC free article] [PubMed] [Google Scholar]
- 21.Shuford CM, Comins DL, Whitten JL, Burnett JC, Muddiman DC. Improving limits of detection for B-type natriuretic peptide using PC-IDMS: An application of the ALiPHAT strategy. Analyst. 2010;135:36. doi: 10.1039/b919484c. [DOI] [PMC free article] [PubMed] [Google Scholar]
- 22.Williams DK, Comins DL, Whitten JL, Muddiman DC. Evaluation of the ALiPHAT Method for PC-IDMS and Correlation of Limits-of-Detection with Nonpolar Surface Area. J Am Soc Mass Spectrom. 2009;20:2006. doi: 10.1016/j.jasms.2009.07.019. [DOI] [PMC free article] [PubMed] [Google Scholar]
- 23.Frahm JL, Bori ID, Comins DL, Hawkridge AM, Muddiman DC. Achieving augmented limits of detection for peptides with hydrophobic alkyl tags. Anal Chem. 2007;79:3989. doi: 10.1021/ac070558q. [DOI] [PubMed] [Google Scholar]
- 24.Niessen WMA, Manini P, Andreoli R. Matrix effects in quantitative pesticide analysis using liquid chromatography–mass spectrometry. Mass Spectrom; Rev. 2006;25:881. doi: 10.1002/mas.20097. [DOI] [PubMed] [Google Scholar]
- 25.Mei H, Hsieh Y, Nardo C, Xu X, Wang S, Ng K, Korfmacher WA. Investigation of matrix effects in bioanalytical high-performance liquid chromatography/tandem mass spectrometric assays: application to drug discovery. Rapid Commun Mass Spectrom. 2003;17:97. doi: 10.1002/rcm.876. [DOI] [PubMed] [Google Scholar]
- 26.Gosetti F, Mazzucco E, Zampieri D, Gennaro MC. Signal suppression/enhancement in high-performance liquid chromatography tandem mass spectrometry. J Chromatogr A. 2010;1217:3929. doi: 10.1016/j.chroma.2009.11.060. [DOI] [PubMed] [Google Scholar]
- 27.Cech NB, Krone JR, Enke CG. Predicting electrospray response from chromatographic retention time. Anal Chem. 2001;73:208. doi: 10.1021/ac0006019. [DOI] [PubMed] [Google Scholar]
- 28.Null AP, Nepomuceno AI, Muddiman DC. Implications of hydrophobicity and free energy of solvation for characterization of nucleic acids by electrospray ionization mass spectrometry. Anal Chem. 2003;75:1331. doi: 10.1021/ac026217o. [DOI] [PubMed] [Google Scholar]
- 29.Walker HS, Lilley LM, Enamorado MF, Comins DL, Muddiman DC. Hydrophobic Derivatization of N-linked Glycans for Increased Ion Abundance in Electrospray Ionization Mass Spectrometry. J Am Soc Mass Spectrom. 2011;25:1309. doi: 10.1007/s13361-011-0140-x. [DOI] [PMC free article] [PubMed] [Google Scholar]
- 30.Mirzaei H, Regnier F. Enhancing electrospray ionization efficiency of peptides by derivatization. Anal Chem. 2006;78:4175. doi: 10.1021/ac0602266. [DOI] [PubMed] [Google Scholar]
- 31.Yang WC, Mirzaei H, Liu XP, Regnier FE. Enhancement of amino acid detection and quantification by electrospray ionization mass spectrometry. Anal Chem. 2006;78:4702. doi: 10.1021/ac0600510. [DOI] [PubMed] [Google Scholar]
- 32.Biswas KM, DeVido DR, Dorsey JG. Evaluation of methods for measuring amino acid hydrophobicities and interactions. J Chromatogr A. 2003;1000:637. doi: 10.1016/s0021-9673(03)00182-1. [DOI] [PubMed] [Google Scholar]
- 33.Mant CT, Kovacs JM, Kim HM, Pollock DD, Hodges RS. Intrinsic Amino Acid Side-Chain Hydrophilicity/Hydrophobicity Coefficients Determined by Reversed-Phase High-Performance Liquid Chromatography of Model Peptides: Comparison With Other Hydrophilicity/Hydrophobicity Scales. Biopolymers. 2009;92:573. doi: 10.1002/bip.21316. [DOI] [PMC free article] [PubMed] [Google Scholar]
- 34.Kovacs JM, Mant CT, Hodges RS. Determination of intrinsic hydrophilicity/hydrophobicity of amino acid side chains in peptides in the absence of nearest-neighbor or comformational effects. Biopolymers. 2006;84:283. doi: 10.1002/bip.20417. [DOI] [PMC free article] [PubMed] [Google Scholar]
- 35.Cech NB, Enke CG. Relating electrospray ionization response to nonpolar character of small peptides. Anal Chem. 2000;72:2717. doi: 10.1021/ac9914869. [DOI] [PubMed] [Google Scholar]
- 36.Wong FT, Chen AY, Cane DE, Khosla C. Protein-Protein Recognition between Acyltransferases and Acyl Carrier Proteins in Multimodular Polyketide Synthases. Biochemistry. 2010;49:95. doi: 10.1021/bi901826g. [DOI] [PMC free article] [PubMed] [Google Scholar]
- 37.Musiol EM, Hartner T, Kulik A, Moldenhauer J, Piel J, Wohlleben W, Weber T. Supramolecular Templating in Kirromycin Biosynthesis: The Acyltransferase KirCII Loads Ethylmalonyl-CoA Extender onto a Specific ACP of the trans-AT PKS. Chem Biol. 2011;18:438. doi: 10.1016/j.chembiol.2011.02.007. [DOI] [PubMed] [Google Scholar]
- 38.Wong FT, Jin X, Mathews II, Cane DE, Khosla C. Structure and Mechanism of the trans-Acting Acyltransferase from the Disorazole Synthase. Biochemistry. 2011;50:6539. doi: 10.1021/bi200632j. [DOI] [PMC free article] [PubMed] [Google Scholar]
- 39.Wisniewski JR, Zougman A, Nagaraj N, Mann M. Universal sample preparation method for proteome analysis. Nature Methods. 2009;6:359. doi: 10.1038/nmeth.1322. [DOI] [PubMed] [Google Scholar]
- 40.Wisniewski JR, Zougman A, Mann M. Combination of FASP and StageTip-Based Fractionation Allows In-Depth Analysis of the Hippocampal Membrane Proteome. Journal of Proteome Research. 2009;8:5674. doi: 10.1021/pr900748n. [DOI] [PubMed] [Google Scholar]
- 41.Wisniewski JR, Mann M. Consecutive Proteolytic Digestion in an Enzyme Reactor Increases Depth of Proteomic and Phosphoproteomic Analysis. Anal Chem. 2012;84:2631. doi: 10.1021/ac300006b. [DOI] [PubMed] [Google Scholar]
- 42.Song J, Wang JH, Jozwiak AA, Hu WD, Swiderski PM, Chen Y. Stability of thioester intermediates in ubiquitin-like modifications. Protein Science. 2009;18:2492. doi: 10.1002/pro.254. [DOI] [PMC free article] [PubMed] [Google Scholar]
- 43.Grillo MP, Benet LZ. Studies on the reactivity of clofibryl-S-acyl-CoA thioester with glutathione in vitro. Drug Metabolism and Disposition. 2002;30:55. doi: 10.1124/dmd.30.1.55. [DOI] [PubMed] [Google Scholar]
- 44.Burns JA, Butler JC, Moran J, Whitesides GM. Selective Reduction of Disulfides by Tris(2-Carboxyethyl)Phosphine. J Org Chem. 1991;56:2648. [Google Scholar]
- 45.Xu Y, Bailey UM, Punyadeera C, Schulz BL. Identification of salivary N-glycoproteins and measurement of glycosylation site occupancy by boronate glycoprotein enrichment and liquid chromatography/electrospray ionization tandem mass spectrometry. Rapid Commun Mass Spectrom. 2014;28:471. doi: 10.1002/rcm.6806. [DOI] [PubMed] [Google Scholar]
- 46.Steen H, Jebanathirajah JA, Springer M, Kirschner MW. Stable isotope-free relative and absolute quantitation of protein phosphorylation stoichiometry by MS. Proc Natl Acad Sci USA. 2005;102:3948. doi: 10.1073/pnas.0409536102. [DOI] [PMC free article] [PubMed] [Google Scholar]
- 47.Shuford CM, Comins DL, Whitten JL, Burnett JC, Jr, Muddiman DC. Improving limits of detection for B-type natriuretic peptide using PC-IDMS: an application of the ALiPHAT strategy. Analyst. 2010;135:36. doi: 10.1039/b919484c. [DOI] [PMC free article] [PubMed] [Google Scholar]
- 48.Walker SH, Lilley LM, Enamorado MF, Comins DL, Muddiman DC. Hydrophobic Derivatization of N-linked Glycans for Increased Ion Abundance in Electrospray Ionization Mass Spectrometry. J Am Soc Mass Spectrom. 2011;22:1309. doi: 10.1007/s13361-011-0140-x. [DOI] [PMC free article] [PubMed] [Google Scholar]
Associated Data
This section collects any data citations, data availability statements, or supplementary materials included in this article.


