

Abstract
Target-based high-throughput screening (HTS) has recently been critiqued for its relatively poor yield compared to phenotypic screening approaches. One type of phenotypic screening, image-based high-content screening (HCS), has been seen as particularly promising.
In this article, we assess whether HCS is as high content as it can be. We analyze HCS publications and find that although the number of HCS experiments published each year continues to grow steadily, the information content lags behind. We find that a majority of high-content screens published so far (60−80%) made use of only one or two image-based features measured from each sample and disregarded the distribution of those features among each cell population. We discuss several potential explanations, focusing on the hypothesis that data analysis traditions are to blame. This includes practical problems related to managing large and multidimensional HCS data sets as well as the adoption of assay quality statistics from HTS to HCS. Both may have led to the simplification or systematic rejection of assays carrying complex and valuable phenotypic information.
We predict that advanced data analysis methods that enable full multiparametric data to be harvested for entire cell populations will enable HCS to finally reach its potential.
Keywords: Cell-based assays, high-content screening, image analysis, statistical analyses, phenotypic drug discovery
Introduction
There is growing concern that biochemical or cell-based high-throughput screening (HTS) assays with only a single, simplistic, population-averaged readout may yield hits that are relatively poor quality (e.g., in terms of clinical efficacy and toxicity for chemical hits, and in terms of physiological relevance for genetic perturbations), as compared to phenotypic assays.1 In particular, high-content screening (HCS) by imaging cell populations has been predicted to offer tremendous promise. HCS enables measuring complex phenotypic outcomes that are more closely linked to disease states while also providing preliminary, cell-level assessment of certain aspects of ADMET during a primary screen. Moreover, profiling methods—measurement of multiple parameters integrated at the level of single cells—can facilitate more complex tasks such as target prediction of a drug candidate2,3 or precise identification of proteins involved in biological processes.4
Despite this promise, HCS is generally not used as the dominant primary screening modality in industry or academia. There may be many reasons for this, including long assay development times, low throughput of microscopy hardware, and the requirement of specialized expertise to carry out HCS, although improvements have been made in these areas in the past decade. In this article, we focus on the information content of HCS experiments; we find that although the number of HCS experiments published each year continues to grow steadily, the information content lags behind. We discuss possible explanations for this, focusing on the hypothesis that data analysis customs are to blame.
The Rate of Discoveries Made Using HCS Is Increasing
We first wanted to observe the trend in discoveries made using HCS throughout time (here, HCS refers only to microscopy-based experiments). We used publication records as our source, which constrains our findings primarily to academia. Recognizing that it is not feasible to exhaustively identify all papers that used HCS to obtain biological results, we sought representative samplings in three ways (see the “Notes” section for details). In the first approach (termed HCS-title here), we searched PubMed for “high-content screening” (including quotes) in the title. The term HCS is by no means used universally to describe high-throughput, image-based experiments, and requiring it in the title is likely biased toward papers on the more simplistic end of the spectrum. Therefore, our second approach (termed Top-tier here) searched PubMed with a much broader combination of words and then constrained the size of this set by limiting it to papers published in Science, Nature, Cell, and the Proceedings of the National Academy of Sciences (see “Notes” for details). Our third approach (termed CellProfiler citers here) was based on a set of papers curated by hand that cite our group’s open-source software for high-throughput image analysis. We expected this group to be somewhat biased toward laboratories willing to use high-end informatics tools in their work. For all three approaches, we excluded book chapters, reviews, and comments, as well as papers in which presenting a method was the main focus (e.g., development of an assay) as opposed to presenting a biological discovery. We find that the number of papers meeting these criteria that are published each year is increasing steadily (Fig. 1).
Figure 1.

The number of papers in which a high-throughput, image-based experiment was used toward a discovery, by year of publication. Combined indicates the sum of all three searches. Note that the Combined trend line should not be considered as a total, because the literature searches are not at all comprehensive.
The Information Content of the Typical HCS Experiment Is Much Lower than Its Potential
In the resulting 118 papers33–150 based on the search above, we then read the relevant portions to identify the main readout(s) of each high-throughput image-based experiment. Given the power of HCS to provide multiparametric readouts, we were surprised to find that roughly 60–80% of the papers used only one or two measured features of the cells (Fig. 2). Although measuring a single feature was by far the most common, those papers measuring two features typically used the main phenotype under study and cell count as a measure of toxicity. As we suspected, the HCS-title search yielded the highest percentage (83%) of low-content papers (1–2 features), whereas the CellProfiler citers search yielded the highest percentage (29%) of high-content papers (6+ features). Examining the results of all three searches together throughout time, we find the percentage of papers using only 1–2 features has stayed relatively steady during the past decade (Fig. 3).
Figure 2.
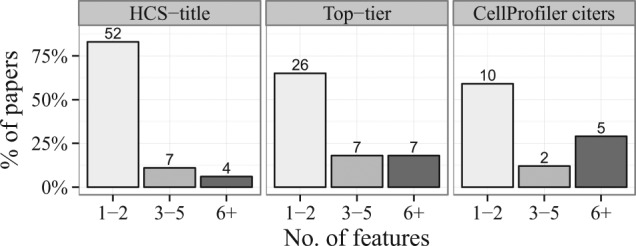
Feature set sizes used in papers throughout the three searches. Numbers at the top of each bar indicate the actual number of papers. Between 60% and 80% of the papers used only one or two measured features of the cells.
Figure 3.

Percentage of papers that use only one or two measured features of the cells, by year of publication.
Certainly measurement of one or two features by microscopy can yield a valuable phenotypic readout, and clearly a complex experiment need not be performed when a simple one will do. Furthermore, researchers may have surveyed several potential features prior to selection, but in the end, only 1–2 features may have been used for the experiment and published in the report. We nonetheless conclude that there is a strong tendency for HCS assays to typically be, in truth, quite low content in terms of the number of different parameters used. Given the additional complexity and time involved in HCS and that the typical outcome is relatively low content, it is perhaps unsurprising that the use of HCS is not increasing more rapidly. In the remainder of this article, we discuss some challenges that have likely driven at least part of this trend toward low-content HCS.
Insufficient Computational Infrastructure for Multidimensional, Single-Cell Data
The field of HTS has made tremendous progress in data handling, resulting in streamlined systems for handling the large amount of data produced in typical HTS screens as long as a small number of values are produced per replicate sample. Although image files are larger in size, a similar trend is true for HCS, because systems dedicated to handling these files have become relatively reliable. In typical HCS, however, hundreds of features can be extracted for thousands of cells in each replicate sample. Storing and manipulating these data matrices requires significant refactoring and expansion of data management systems, and analyzing the large amounts of data from HCS requires alternate multidimensional methods and, often, significant computing power. These challenges have usually been avoided rather than addressed; HCS results are typically collapsed to a single value per replicate sample to avoid having to modify existing HTS data storage and handling systems to cope with the large amount and high dimensionality of HCS.
Workflow Hurdles
Further pressure to reduce rich HCS data has come at other stages of the workflow. For example, hits from a screen are often iteratively improved by chemists once the screen is complete in a process called lead optimization, particularly in a drug-discovery environment. There is no commonly adopted method to handle multiple readouts at this stage; generally, a single readout is preferred to easily fit dose–response curves and discern structure–activity relationships.
Even when lead optimization is not an issue, pressure has come from assay quality requirements that may not be appropriate for truly high-content experiments. Screening centers, in both pharmaceutical and academic settings, typically require that any high-throughput assay meet a minimum value of the Z′-factor5 (see Suppl. Fig. 1 for a definition) prior to being accepted for screening. The Z′-factor is suited to most HTS readouts and is an improvement over prior assay-quality statistics such as signal-to-noise ratios. The measure indicates the extent of separation between positive and negative controls. It assumes a Gaussian distribution of the controls’ values—an assumption met (in theory) for most HTS readouts due to the central limit theorem. For example, whole-well fluorescence measurements involve the sum of the light emitted by each independent and identically distributed molecular interaction. In practice, effects like spatial biases across the plate can corrupt that Gaussianity, but the Z′-factor is generally used regardless.
Interestingly, the screening community has adopted the Z′-factor as a quality control statistic for HCS as well. Of the 118 papers identified above, 40% used the Z′-factor (Fig. 4); the majority of these came from the HCS-title group (Suppl. Fig. 2). Many of the remainder also used a Gaussian assumption of univariate controls, for example in t tests.
Figure 4.

The percentage of papers throughout all three searches that use the Z′-factor, plotted by year of publication. The fractions indicate the number of papers that use the Z′-factor divided by the total number of papers in each year. Overall, 40% use the Z′-factor (dotted line).
There are several problems with using the Z′-factor in HCS (Fig. 5). First, the statistic requires that the readout be univariate, so typically only a single cellular feature is retained. Second, although multivariate extensions to the Z′-factor have been proposed,6,7 they still require that the per-cell readouts be summarized into a single value per replicate sample. By doing so, the rich information captured from single-cell measurements is effectively discarded. Together, these two transformations coerce a matrix of readouts into a single value per sample, thereby losing many of the benefits of HCS.
Figure 5.

The necessary steps required to use the Z′-factor as a quality metric drastically simplify assay readout and analysis but typically also reduce the power and value of an HCS assay. (A) The Z′-factor is a univariate statistic, so assay developers typically select a single feature as a readout, ignoring a large part of other available information; (B) the per-cell measurements need to be aggregated into a single value per replicate sample, and assays presenting heterogeneous cell responses detectable only via subtleties in their population distributions will often fail to yield acceptable Z′-factor values and be discarded; and (C) the Z′-factor requires that the distributions of controls’ values are Gaussian—a condition that is met by choosing the method of aggregation to be the mean throughout the cell population—but this biases the selection of assays considerably, as discussed in the text.
Third, it is usually the mean that is used to summarize per-cell readouts into a single value. This generally results in the transformed data having a Gaussian distribution, meeting the assumptions of the Z′-factor, but it obscures changes that are present only within certain subpopulations of cells. When the per-cell readouts are summarized in other ways (e.g., counting the percentage of cells with a particular phenotype), the summaries may be distributed in a non-Gaussian8 way, and this generally leads to lower Z′-factors.
The Z′-factor is therefore often not ideal for HCS because there is a mismatch between the purpose of the metric (distinguishing a positive control from a negative control based on a single population-averaged readout that follows a normal distribution) and more sophisticated usage of HCS (see the “Hope for the Future” section). Although advanced data techniques could certainly be used after the Z′-factor hurdle has been crossed, it is possible for an assay to fail to meet a Z′-factor threshold for a single averaged assay readout and nonetheless be of suitable quality for more advanced methods that are based on dozens or hundreds of features on a single-cell level. Conversely, it is possible for an assay to pass the Z′-factor >0.5 threshold for a single population-merged assay readout and nonetheless be poorly suited to further multivariate analyses.
Together, these issues inadvertently nudge scientists toward HCS assays that show a significant shift in the mean of the population and thus yield an acceptable Z′-factor value. In the process, we suspect that complex assays, in which one or more biological processes of interest manifest as changes in the distributions of cellular subpopulations, are often abandoned.
Hope for the Future: Multiparametric Methods for HCS
Overall, we suspect that there has been a trend to choose simpler HCS assays to pass through the bottleneck of existing data infrastructures and approval processes at screening centers and that this has likely had dramatic and largely silent consequences on scientific discovery.
Still, there is hope on the horizon because some pioneering work in this area has begun to carve out use cases for HCS that are more complex and valuable. Laboratories have been working to establish high-dimensional data analysis methods suited specifically to HCS assays and to address the data-handling and infrastructure challenges we have described above. In addition, in practice, HCS assays have also required closer attention to consistency because normalization can be more challenging among samples and experimental batches when working in high-dimensional spaces.
In the remainder of this section, we focus on reviewing the computational methods that have been used in successful instances of multidimensional data analysis for HCS.
Scoring Cellular Phenotypes Using Multidimensional Classification
Machine learning methods to score phenotypes at the individual cell level have been effective in a number of discovery-oriented high-content screens.9–16 Several tools have been created to recognize and sort complex cell phenotypes automatically at high throughput using their high-dimensional image-based cytological profiles and a hand-trained classifier. These include CellProfiler Analyst,17 CellClassifier,18 Enhanced CellClassifier,19 and Advanced CellClassifier.20 They all enable researchers to choose example cells that represent the phenotype of interest and train machine learning algorithms to distinguish them. They differ from each other in the particularities of their user interfaces and the machine learning algorithms used. CellProfiler Analyst uses GentleBoosting,21 a method that combines many relatively weak and inaccurate yet simple rules to create a classifier with a significantly higher accuracy. CellClassifier uses support vector machines (SVMs), neural networks, or k-nearest neighbors for classification. Enhanced CellClassifier is a similar framework that also uses SVMs for classification. Advanced CellClassifier interfaces with Weka,22 which provides a suite of classification algorithms. Finally, CellCognition23 enables the analysis of time-lapse images to monitor the progression of cells through different functional states using hidden Markov modeling.
Multidimensional Profiling of Samples
More exploratory are methods that can be described as phenotypic profiling—creating signatures or profiles from multiparametric, feature-based analysis of cellular phenotypes of each sample so that the biological similarities among samples are reflected in the similarities among profiles. Mathematically, a profile is simply a set of numerical values that represent a given treatment condition. In this section, we review five phenotypic profiling approaches that have been shown to be effective in previously reported experiments.
Approach 1: Summary of Feature Distributions
Each component of the phenotypic profile for a sample is a simple summary statistic, such as the mean, computed across all the cells in the sample for each feature. Adams et al.24 used this method to compute profiles for identifying the mechanisms of action of compounds by similarity to those with known mechanisms. Genovesio et al.4 used it to select hits from a genome-wide loss-of-function screen. Gustafsdottir et al.25 used it to cluster compounds by similarity. The advantage of this method is its simplicity and ease of implementation. It does not, however, capture heterogeneity in cell populations, and that may prevent it from detecting effects of perturbations when a small fraction of cells are affected.
Approach 2: Summary of Feature Differences between Treatment and Control Distributions
The phenotypic profile is given by the differences in distributions in each cellular feature between the treatment sample and control samples. Perlman et al.2 use the Kolmogorov–Smirnov statistic, a nonparametric measure of difference between distributions, to construct profiles for identifying the mechanism of action of compounds. By measuring distributional differences in each feature, treatment effects can be detected even when the cellular response is heterogeneous, albeit ignoring changes that are only seen when considering two or more features simultaneously. This approach is very sensitive to the choice of control distribution, because all samples are compared against it, with different controls potentially leading to vastly different signatures for a treatment.
Approach 3: Multivariate Classifier Separating Treatment and Control
The phenotypic profile is constructed by training a multivariate classifier to distinguish samples of treatment and control cells. Using this approach, Loo et al.3 identified the mechanism of action of compounds by training an SVM and using the normal vector of the classifier’s separating hyperplane as the treatment’s phenotypic profile. This method has the advantage of combining information among all the features in a true multivariate manner. It may, however, emphasize features that distinguish a treatment from control, rather than from other compounds or known compound groups, making the profiles less effective on tasks such as grouping compounds into mechanisms of action.26 Further, subpopulation information may be lost as all cells from a sample are grouped into a single class when training the classifier.
Approach 4: Normalized Frequency of Cells from Each Subpopulation
It is well known that cellular subpopulations within a sample may respond differently to treatments,27,28 a phenomenon that is unaccounted for in profiling methods that assume homogeneous responses to perturbations. Although Approach 2 partially addresses this problem by measuring population differences per feature, a more comprehensive solution is to model all the subpopulations in the experiment explicitly and to then represent a treatment by the relative frequency of cells that belong to each subpopulation. An example of this approach is presented by Slack et al.,29 in which a clustering algorithm (Gaussian mixture models, or GMMs) is used to identify cellular subpopulations, and the profile is constructed as the percentage of the sample’s cells that fall into each subpopulation. Although considering cells as falling into discrete subpopulations is an imperfect representation of the variation seen among different cells and different features, Slack et al. successfully used this method to identify the mechanism of action of drugs. A potential shortcoming is that GMMs, similar to most clustering algorithms, can fail to give meaningful clusters in high dimensions due to the redundancy of features, the sparseness of data, or the existence of clusters in different subspaces.30
Approach 5: Data-Driven Feature Reduction
When several hundreds of image-based measurements are extracted per cell, many features tend to be highly correlated with each other. This leads to the redundant features being weighted higher than less redundant features when computing similarities. In such scenarios, feature reduction techniques may help tackle this problem either by selecting a subset of features or by linearly combining features so that correlated features group together. As an example, Young et al.31 estimate a latent factor model from the data for a certain, small number of factors, resulting in a lower-dimensional representation of the data. A profile for the sample is then constructed by averaging the factor values among all cells. This method can be used as a preprocessing step in combination with the approaches described above. In cases in which the features are highly redundant, profiles thus generated are likely to be more discriminative than those generated from the original, high-dimensional feature set—a phenomenon we have previously observed on the task of identifying mechanisms of action of compounds.26
Many avenues remain to be explored; a routine method of profiling does not yet exist. For example, for all the methods discussed above to generate profiles, a choice must be made in how to measure profile similarity. It is still actively debated which metrics are best in which contexts, with Reisen et al.32 recently providing a comparison of several that indicates that Kendall’s τ and Spearman’s ρ perform well in most evaluation scenarios. The comparison of the profiling methods themselves has been addressed only recently;26 further comparisons are needed to test methods against each other in other contexts, such as with different cell lines, assays and stains, and experimental goals.
What about Quality Control?
The profiling methods described above cannot be reduced to simply aiming at distinguishing positive and negative controls using a single feature, for which quality control (QC) metrics like the Z′-factor were designed. Instead, the methods have various goals, and thus the QC metrics should be appropriate to those goals. Classification accuracy is a reasonable quality metric for experiments in which similarity and difference among samples are the goals—however, calculating this requires a large number of positive controls and in many replicates. This is problematic because these are frequently not available: often, positive controls are not known in advance, or they do not reflect the subtlety expected from samples to be tested in the actual experiment. Replicate reproducibility could theoretically be used as a metric indicating assay quality; this, however, requires defining an appropriate null distribution for the metric and has not been used in practice, to our knowledge.
Conclusion
There are clearly important applications involving high-content screening that require sophisticated data analysis methods. It is encouraging to see emerging research aimed at developing suitable approaches. Perhaps most exciting is the prospect that large data sets from past publications have typically been safely archived and might be reanalyzed with some of these new methods to generate new discoveries. As data analysis approaches for these more complex types of HCS experiments become well developed and incorporated into easy-to-use software, we anticipate more powerful applications of HCS to blossom, the value of a typical experiment to increase, and ultimately the technology to be more widely adopted.
Acknowledgments
The authors thank Paul A. Clemons and members of the Imaging Platform, especially Mark-Anthony Bray, David J. Logan, Margaret Anthony, Matthew Veneskey, and Vebjorn Ljosa, for helpful discussions, critiques, and data compilation.
For the HCS-title search, we searched PubMed in March 2013 for the exact wording “high-content screening” (including quotes). This yielded 473 papers, a large portion of which only mentioned HCS but did not use it. We refined the search by requiring “high-content screening” in the title, yielding a list of 214 papers. We categorized the papers by type and found that of the 214 papers we identified, 67 were book chapters, reviews, or comments; 84 presented methods (most often, assay development); and 63 presented the discovery of a molecule or a mechanism by HCS.
For the Top-tier search, we searched PubMed in August 2013 for a set of terms that we found captured a broad range of papers that used image-based high-throughput experiments to make a discovery (Search = ((automat* OR throughput OR screen) AND (visual OR microscop* OR (image AND analysis) OR morpholog*) AND (cell OR cells OR cellular)) NOT “review”[Publication Type]). Because this search captured 13,111 papers, we limited the list to only those published in Science, Nature, Cell, and Proceedings of the National Academy of Sciences, yielding 232 papers. We filtered this set by reading the abstracts and excluding papers that were clearly not using imaging as a high-throughput assay leading to the major discovery in the paper. We then read the relevant parts of the remaining papers and identified 40 that presented the discovery of a molecule or a mechanism by HCS.
For the CellProfiler citers search, we used a manually curated collection of papers as follows. We routinely manually identify papers citing CellProfiler (whether by name, website, or citation of publications describing CellProfiler) and maintain a list (http://cellprofiler.org/citations.shtml). For each paper, we record whether CellProfiler was used (or just mentioned), whether it was used to make a discovery (rather than as proof-of-principle or assay development), and whether it was used in high throughput (defined as >100 images). Out of more than 800 CellProfiler citers as of August 2013, there were 17 in which CellProfiler was used in high-throughput mode in a publication in which the discovery (rather than the methodology) was the main point of the paper.
For each of the searches, we noted the number of image-based features that were used in the experiments, recognizing that this is somewhat subjective (e.g., we counted a feature that is normalized to cell count as two features, but it could be argued that the resulting feature should be considered a single feature). For all the searches, we also documented whether the Z′-factor was used in the screen.
Supplementary Table 1 provides the detail and annotation of the literature searches. In all, 118 papers were included in the study. Among all three searches, only two of these papers50,114 were found in more than one search: these two were present in both the Top-tier and CellProfiler citers searches.
Footnotes
Declaration of Conflicting Interests: The authors declared no potential conflicts of interest with respect to the research, authorship, and/or publication of this article.
Funding: The authors disclosed receipt of the following financial support for the research, authorship, and/or publication of this article: this work was supported by the National Science Foundation (NSF CAREER DBI 1148823, to AEC).
Supplementary material for this article is available on the Journal of Biomolecular Screening Web site at http://jbx.sagepub.com/supplemental.
References
- 1. Swinney D. C., Anthony J. How Were New Medicines Discovered? Nat. Rev. Drug Discov. 2011, 10, 507–519. [DOI] [PubMed] [Google Scholar]
- 2. Perlman Z. E., Slack M. D., Feng Y., et al. Multidimensional Drug Profiling by Automated Microscopy. Science 2004, 306, 1194–1198. [DOI] [PubMed] [Google Scholar]
- 3. Loo L.-H., Wu L. F., Altschuler S. J. Image-Based Multivariate Profiling of Drug Responses from Single Cells. Nat. Methods 2007, 4, 445–453. [DOI] [PubMed] [Google Scholar]
- 4. Genovesio A., Kwon Y.-J., Windisch M. P., et al. Automated Genome-Wide Visual Profiling of Cellular Proteins Involved in HIV Infection. J. Biomol. Screen. 2011, 16, 945–958. [DOI] [PubMed] [Google Scholar]
- 5. Zhang J.-H. A Simple Statistical Parameter for Use in Evaluation and Validation of High Throughput Screening Assays. J. Biomol. Screen. 1999, 4, 67–73. [DOI] [PubMed] [Google Scholar]
- 6. Kümmel A., Gubler H., Gehin P., et al. Integration of Multiple Readouts into the Z′ Factor for Assay Quality Assessment. J. Biomol. Screen. 2010, 15, 95–101. [DOI] [PubMed] [Google Scholar]
- 7. Kozak K., Csucs G. Kernelized Z′ Factor in Multiparametric Screening Technology. RNA Biol. 2010, 7, 615–620. [DOI] [PubMed] [Google Scholar]
- 8. Haney S. A. Rapid Assessment and Visualization of Normality in High Content and Other Cell-Level Data and Its Impact on the Interpretation of Experimental Result. J. Biomol. Screen. 2014. In press. [DOI] [PubMed] [Google Scholar]
- 9. Wild T., Horvath P., Wyler E., et al. A Protein Inventory of Human Ribosome Biogenesis Reveals an Essential Function of Exportin 5 in 60S Subunit Export. PLoS Biol. 2010, 8, e1000522. [DOI] [PMC free article] [PubMed] [Google Scholar]
- 10. Misselwitz B., Dilling S., Vonaesch P., et al. RNAi Screen of Salmonella Invasion Shows Role of COPI in Membrane Targeting of Cholesterol and Cdc42. Mol. Syst. Biol. 2011, 7, 474. [DOI] [PMC free article] [PubMed] [Google Scholar]
- 11. Misselwitz B., Dehio C., Truttmann M. C., et al. Bartonella henselae Engages Inside-Out and Outside-In Signaling by Integrin 1 and Talin1 during Invasome-Mediated Bacterial Uptake. J. Cell Sci. 2011, 124, 3591–3602. [DOI] [PubMed] [Google Scholar]
- 12. Hardt W.-D., Chabria M., Misselwitz B., et al. Near Surface Swimming of Salmonella typhimurium Explains Target-Site Selection and Cooperative Invasion. PLoS Pathog. 2012, 8, e1002810. [DOI] [PMC free article] [PubMed] [Google Scholar]
- 13. March S., Ng S., Velmurugan S., et al. Resource A Microscale Human Liver Platform that Supports the Hepatic Stages of Plasmodium falciparum and vivax. Cell Host Microbe 2013, 14, 104–115. [DOI] [PMC free article] [PubMed] [Google Scholar]
- 14. Paul P., van den Hoorn T., Jongsma M. L. M., et al. A Genome-Wide Multidimensional RNAi Screen Reveals Pathways Controlling MHC Class II Antigen Presentation. Cell 2011, 145, 268–283. [DOI] [PubMed] [Google Scholar]
- 15. Stergiou L., Bauer M., Mair W., et al. Integrin-Mediated Signaling Induced by Simian Virus 40 Leads to Transient Uncoupling of Cortical Actin and the Plasma Membrane. PLoS One 2013, 8. [DOI] [PMC free article] [PubMed] [Google Scholar] [Retracted]
- 16. Snijder B., Sacher R., Rämö P., et al. Single-Cell Analysis of Population Context Advances RNAi Screening at Multiple Levels. Mol. Syst. Biol. 2012, 8, 579. [DOI] [PMC free article] [PubMed] [Google Scholar]
- 17. Jones T. R., Carpenter A. E., Lamprecht M. R., et al. Scoring Diverse Cellular Morphologies in Image-Based Screens with Iterative Feedback and Machine Learning. Proc. Natl. Acad. Sci. U. S. A. 2009, 106, 1826–1831. [DOI] [PMC free article] [PubMed] [Google Scholar]
- 18. Rämö P., Sacher R., Snijder B., et al. CellClassifier: Supervised Learning of Cellular Phenotypes. Bioinformatics 2009, 25, 3028–3030. [DOI] [PubMed] [Google Scholar]
- 19. Misselwitz B., Strittmatter G., Periaswamy B., et al. Enhanced CellClassifier: A Multi-Class Classification Tool for Microscopy Images. BMC Bioinformatics 2010, 11, 30. [DOI] [PMC free article] [PubMed] [Google Scholar]
- 20. Horvath P., Wild T., Kutay U., et al. Machine Learning Improves the Precision and Robustness of High-Content Screens: Using Nonlinear Multiparametric Methods to Analyze Screening Results. J. Biomol. Screen. 2011, 16, 1059–1067. [DOI] [PubMed] [Google Scholar]
- 21. Friedman J., Hastie T., Tibshirani R. Additive Logistic Regression: A Statistical View of Boosting. Ann. Stat. 2000, 28, 337–407. [Google Scholar]
- 22. Hall M., Frank E., Holmes G., et al. The WEKA Data Mining Software: An Update. ACM SIGKDD Explor. Newsl. 2009, 11, 10–18. [Google Scholar]
- 23. Held M., Schmitz M. H., Fischer B., et al. CellCognition: Time-Resolved Phenotype Annotation in High-Throughput Live Cell Imaging. Nat. Methods 2010, 7, 747–754. [DOI] [PubMed] [Google Scholar]
- 24. Adams C. L., Kutsyy V., Coleman D., et al. Compound Classification Using Image-Based Cellular Phenotypes. Methods Enzymol. 2006, 414, 440–468. [DOI] [PubMed] [Google Scholar]
- 25. Gustafsdottir S. M., Ljosa V., Sokolnicki K. L., et al. Multiplex Cytological Profiling Assay to Measure Diverse Cellular States. PLoS One 2013, 8, e80999. [DOI] [PMC free article] [PubMed] [Google Scholar]
- 26. Ljosa V., Caie P. D., Ter Horst R., et al. Comparison of Methods for Image-Based Profiling of Cellular Morphological Responses to Small-Molecule Treatment. J. Biomol. Screen. 2013, 18, 1321–1329. [DOI] [PMC free article] [PubMed] [Google Scholar]
- 27. Snijder B., Pelkmans L. Origins of Regulated Cell-to-Cell Variability. Nat Rev Mol Cell Biol. 2011, 12, 119–125. [DOI] [PubMed] [Google Scholar]
- 28. Altschuler S. J., Wu L. F. Cellular Heterogeneity: Do Differences Make a Difference? Cell 2010, 141, 559–563. [DOI] [PMC free article] [PubMed] [Google Scholar]
- 29. Slack M. D., Martinez E. D., Wu L. F., et al. Characterizing Heterogeneous Cellular Responses to Perturbations. Proc. Natl. Acad. Sci. U. S. A. 2008, 105, 19306–19311. [DOI] [PMC free article] [PubMed] [Google Scholar]
- 30. Parsons L., Haque E., Liu H. Subspace Clustering for High Dimensional Data: A Review. SIGKDD Explor. Newsl. 2004, 6, 90–105. [Google Scholar]
- 31. Young D. W., Bender A., Hoyt J., et al. Integrating High-Content Screening and Ligand-Target Prediction to Identify Mechanism of Action. Nat. Chem. Biol. 2008, 4, 59–68. [DOI] [PubMed] [Google Scholar]
- 32. Reisen F., Zhang X., Gabriel D., et al. Benchmarking of Multivariate Similarity Measures for High-Content Screening Fingerprints in Phenotypic Drug Discovery. J. Biomol. Screen. 2013, 18, 1284–1297. [DOI] [PubMed] [Google Scholar]
- 33. Wang J., Xie X. Development of a Quantitative, Cell-Based, High-Content Screening Assay for Epidermal Growth Factor Receptor Modulators. Acta Pharmacol. Sin. 2007, 28, 1698–1704. [DOI] [PubMed] [Google Scholar]
- 34. Quintavalle M., Elia L., Price J. H., et al. A Cell-Based High-Content Screening Assay Reveals Activators and Inhibitors of Cancer Cell Invasion. Sci. Signal. 2011, 4, ra49. [DOI] [PMC free article] [PubMed] [Google Scholar]
- 35. Kitami T., Spiegelman B. M., Logan D. J., et al. A Chemical Screen Probing the Relationship between Mitochondrial Content and Cell Size. PLoS One 2012, 7, e33755. [DOI] [PMC free article] [PubMed] [Google Scholar]
- 36. Giddings A. M., Maitra R. A disease-Relevant High-Content Screening Assay to Identify Anti-Inflammatory Compounds for Use in Cystic Fibrosis. J. Biomol. Screen. 2010, 15, 1204–1210. [DOI] [PubMed] [Google Scholar]
- 37. Paul P., van den Hoorn T., Jongsma M. L. M., et al. A Genome-Wide Multidimensional RNAi Screen Reveals Pathways Controlling MHC Class II Antigen Presentation. Cell 2011, 145, 268–283. [DOI] [PubMed] [Google Scholar]
- 38. Dobbelaere J., Josué F., Suijkerbuijk S., et al. A Genome-Wide RNAi Screen to Dissect Centriole Duplication and Centrosome Maturation in Drosophila. PLoS Biol. 2008, 6, e224. [DOI] [PMC free article] [PubMed] [Google Scholar]
- 39. Proszynski T. J., Klemm R. W., Gravert M., et al. A Genome-Wide Visual Screen Reveals a Role for Sphingolipids and Ergosterol in Cell Surface Delivery in Yeast. Proc. Natl. Acad. Sci. 2005, 102, 17981–17986. [DOI] [PMC free article] [PubMed] [Google Scholar]
- 40. Boyd J. D., Glicksman M., El Khoury J., et al. A High Content Drug Screen Identifies Ursolic Acid as an Inhibitor of Amyloid Protein Interactions with Its Receptor CD36. J. Biol. Chem. 2011, 286, 34914–34922. [DOI] [PMC free article] [PubMed] [Google Scholar]
- 41. Yip K. W., Cuddy M., Pinilla C., et al. A High-Content Screening (HCS) Assay for the Identification of Chemical Inducers of PML Oncogenic Domains (PODs). J. Biomol. Screen. 2011, 16, 251–258. [DOI] [PMC free article] [PubMed] [Google Scholar]
- 42. Teusch N., Kiefer C. A High-Content Screening Assay for the Nogo Receptor Based on Cellular Rho Activation. Assay Drug Dev. Technol. 2006, 4, 133–141. [DOI] [PubMed] [Google Scholar]
- 43. Saydmohammed M., Vollmer L. L., Onuoha E. O., et al. A High-Content Screening Assay in Transgenic Zebrafish Identifies Two Novel Activators of fgf Signaling. Birth Defects Res. C. Embryo Today 2011, 93, 281–287. [DOI] [PMC free article] [PubMed] [Google Scholar]
- 44. Moffat J., Grueneberg D. A., Yang X., et al. A Lentiviral RNAi Library for Human and Mouse Genes Applied to an Arrayed Viral High-Content Screen. Cell 2006, 124, 1283–1298. [DOI] [PubMed] [Google Scholar]
- 45. Emery A., Sorrell D. A., Lawrence S., et al. A Novel Cell-Based, High-Content Assay for Phosphorylation of lats2 by Aurora A. J. Biomol. Screen. 2011, 16, 925–931. [DOI] [PubMed] [Google Scholar]
- 46. Wild T., Horvath P., Wyler E., et al. A Protein Inventory of Human Ribosome Biogenesis Reveals an Essential Function of Exportin 5 in 60S Subunit Export. PLoS Biol. 2010, 8, e1000522. [DOI] [PMC free article] [PubMed] [Google Scholar]
- 47. Collins C. S., Hong J., Sapinoso L., et al. A Small Interfering RNA Screen for Modulators of Tumor Cell Motility Identifies MAP4K4 as a Promigratory Kinase. Proc. Natl. Acad. Sci. 2006, 103, 3775–3780. [DOI] [PMC free article] [PubMed] [Google Scholar]
- 48. Carey K. L., Westwood N. J., Mitchison T. J., et al. A Small-Molecule Approach to Studying Invasive Mechanisms of Toxoplasma gondii. Proc. Natl. Acad. Sci. 2004, 101, 7433–7438. [DOI] [PMC free article] [PubMed] [Google Scholar]
- 49. Wolff M., Kauschke S. G., Schmidt S., et al. Activation and Translocation of Glucokinase in Rat Primary Hepatocytes Monitored by High Content Image Analysis. J. Biomol. Screen. 2008, 13, 837–846. [DOI] [PubMed] [Google Scholar]
- 50. de Boer J., Post G. F., Hulsman M., et al. An Algorithm-Based Topographical Biomaterials Library to Instruct Cell Fate. Proc. Natl. Acad. Sci. 2011, 108, 16565–16570. [DOI] [PMC free article] [PubMed] [Google Scholar]
- 51. Kriston-Vizi J., Lim C. A., Condron P., et al. An Automated High-Content Screening Image Analysis Pipeline for the Identification of Selective Autophagic Inducers in Human Cancer Cell Lines. J. Biomol. Screen. 2010, 15, 869–881. [DOI] [PubMed] [Google Scholar]
- 52. Kittler R., Putz G., Pelletier L., et al. An Endoribonuclease-Prepared siRNA Screen in Human Cells Identifies Genes Essential for Cell Division. Nature 2004, 432, 1036–1040. [DOI] [PubMed] [Google Scholar]
- 53. Zanella F., Rosado A., Blanco F., et al. An HTS Approach to Screen for Antagonists of the Nuclear Export Machinery Using High Content Cell-Based Assays. Assay Drug Dev. Technol. 2007, 5, 333–341. [DOI] [PubMed] [Google Scholar]
- 54. Schultz P. G., Boitano A. E., Cooke M. P., et al. An Image-Based Screen Identifies a Small Molecule Regulator of Megakaryopoiesis. Proc. Natl. Acad. Sci. 2012, 109, 14019–14023. [DOI] [PMC free article] [PubMed] [Google Scholar]
- 55. Jurgeit A., Moese S., Roulin P., et al. An RNA Replication-Center Assay for High Content Image-Based Quantifications of Human Rhinovirus and Coxsackievirus Infections. Virol. J. 2010, 7, 264. [DOI] [PMC free article] [PubMed] [Google Scholar]
- 56. Finco O., Frigimelica E., Buricchi F., et al. Approach to Discover T- and B-Cell Antigens of Intracellular Pathogens Applied to the Design of Chlamydia trachomatis Vaccines. Proc. Natl. Acad. Sci. 2011, 108, 9969–9974. [DOI] [PMC free article] [PubMed] [Google Scholar]
- 57. Radio N. M., Breier J. M., Shafer T. J., et al. Assessment of Chemical Effects on Neurite Outgrowth in PC12 Cells Using High Content Screening. Toxicol. Sci. 2008, 105, 106–118. [DOI] [PubMed] [Google Scholar]
- 58. Hirota T., Kunitoku N., Sasayama T., et al. Aurora-A and an Interacting Activator, the LIM Protein Ajuba, Are Required for Mitotic Commitment in Human Cells. Cell 2003, 114, 585–598. [DOI] [PubMed] [Google Scholar]
- 59. Wolff M., Haasen D., Merk S., et al. Automated High Content Screening for Phosphoinositide 3 Kinase Inhibition Using an AKT 1 Redistribution Assay. Comb. Chem. High Throughput Screen. 2006, 9, 339–350. [DOI] [PubMed] [Google Scholar]
- 60. Norton J. T., Titus S. A., Dexter D., et al. Automated High-Content Screening for Compounds That Disassemble the Perinucleolar Compartment. J. Biomol. Screen. 2009, 14, 1045–1053. [DOI] [PMC free article] [PubMed] [Google Scholar]
- 61. Saucerman J. J., Ryall K. A. Automated Imaging Reveals a Concentration Dependent Delay in Reversibility of Cardiac Myocyte Hypertrophy. J. Mol. Cell. Cardiol. 2012, 53, 282–290. [DOI] [PMC free article] [PubMed] [Google Scholar]
- 62. Knowles D. W., Sudar D., Bator-Kelly C., et al. Automated Local Bright Feature Image Analysis of Nuclear Protein Distribution Identifies Changes in Tissue Phenotype. Proc. Natl. Acad. Sci. 2006, 103, 4445–4450. [DOI] [PMC free article] [PubMed] [Google Scholar]
- 63. Chu J. J. H., Yang P. L. c-Src Protein Kinase Inhibitors Block Assembly and Maturation of Dengue Virus. Proc. Natl. Acad. Sci. 2007, 104, 3520–3525. [DOI] [PMC free article] [PubMed] [Google Scholar]
- 64. Iniesta A. A., Hillson N. J., Shapiro L. Cell Pole-Specific Activation of a Critical Bacterial Cell Cycle Kinase. Proc. Natl. Acad. Sci. 2010, 107, 7012–7017. [DOI] [PMC free article] [PubMed] [Google Scholar]
- 65. Ghosh R. N., Chen Y. T., DeBiasio R., et al. Cell-Based, High-Content Screen for Receptor Internalization, Recycling and Intracellular Trafficking. Biotechniques 2000, 29, 170–175. [DOI] [PubMed] [Google Scholar]
- 66. Prigozhina N. L., Heisel A., Wei K., et al. Characterization of a Novel Angiogenic Model Based on Stable, Fluorescently Labelled Endothelial Cell Lines Amenable to Scale-Up for High Content Screening. Biol. Cell 2011, 103, 467–481. [DOI] [PMC free article] [PubMed] [Google Scholar]
- 67. Therizols P., Duong T., Dujon B., et al. Chromosome Arm Length and Nuclear Constraints Determine the Dynamic Relationship of Yeast Subtelomeres. Proc. Natl. Acad. Sci. 2010, 107, 2025–2030. [DOI] [PMC free article] [PubMed] [Google Scholar]
- 68. Kaltenbach L. S., Bolton M. M., Shah B., et al. Composite Primary Neuronal High-Content Screening Assay for Huntington’s Disease Incorporating Non-Cell-Autonomous Interactions. J. Biomol. Screen. 2010, 15, 806–819. [DOI] [PubMed] [Google Scholar]
- 69. Piskunov A., Fischer B., Boeglin M., et al. Cullin 3 Mediates SRC-3 Ubiquitination and Degradation to Control the Retinoic Acid Response. Proc. Natl. Acad. Sci. 2011, 108, 20603–20608. [DOI] [PMC free article] [PubMed] [Google Scholar]
- 70. Berke J. M., Fenistein D., Pauwels F., et al. Development of a High-Content Screening Assay to Identify Compounds Interfering with the Formation of the Hepatitis C Virus Replication Complex. J. Virol. Methods 2010, 165, 268–276. [DOI] [PubMed] [Google Scholar]
- 71. Kim S., Jun D. H., Kim H. J., et al. Development of a High-Content Screening Method for Chemicals Modulating DNA Damage Response. J. Biomol. Screen. 2011, 16, 259–265. [DOI] [PubMed] [Google Scholar]
- 72. Zunder E. R., Knight Z. A., Houseman B. T., et al. Discovery of Drug-Resistant and Drug-Sensitizing Mutations in the Oncogenic PI3K Isoform p110 Alpha. Cancer Cell 2008, 14, 180–192. [DOI] [PMC free article] [PubMed] [Google Scholar]
- 73. Ricicova M., Hamidi M., Quiring A., et al. Dissecting Genealogy and Cell Cycle as Sources of Cell-to-Cell Variability in MAPK Signaling Using High-Throughput Lineage Tracking. Proc. Natl. Acad. Sci. 2013, 110, 11403–11408. [DOI] [PMC free article] [PubMed] [Google Scholar]
- 74. Rosales N., Rao T. D., Spriggs D. R. Dual-Fluorescence Isogenic High-Content Screening for MUC16/CA125 Selective Agents. Mol. Cancer Ther. 2011, 10, 1939–1948. [DOI] [PMC free article] [PubMed] [Google Scholar]
- 75. Taylor R. J., Falconnet D., Niemistö A., et al. Dynamic Analysis of MAPK Signaling Using a High-Throughput Microfluidic Single-Cell Imaging Platform. Proc. Natl. Acad. Sci. 2009, 106, 3758–3763. [DOI] [PMC free article] [PubMed] [Google Scholar]
- 76. Feng Y., Yu S., Lasell T. K. R., et al. Exo1: A New Chemical Inhibitor of the Exocytic Pathway. Proc. Natl. Acad. Sci. 2003, 100, 6469–6474. [DOI] [PMC free article] [PubMed] [Google Scholar]
- 77. Guo Y., Walther T. C., Rao M., et al. Functional Genomic Screen Reveals Genes Involved in Lipid-Droplet Formation and Utilization. Nature 2008, 453, 657–661. [DOI] [PMC free article] [PubMed] [Google Scholar]
- 78. Eulalio A., Mano M., Dal Ferro M., et al. Functional Screening Identifies miRNAs Inducing Cardiac Regeneration. Nature 2012, 492, 376–381. [DOI] [PubMed] [Google Scholar]
- 79. Ko E. C., Rosenstein B. S., Kao J., et al. γ-H2AX Kinetics as a Novel Approach to High Content Screening for Small Molecule Radiosensitizers. PLoS One 2012, 7, e38465. [DOI] [PMC free article] [PubMed] [Google Scholar]
- 80. Lindquist R. A., Ottina K. A., Wheeler D. B., et al. Genome-Scale RNAi on Living-Cell Microarrays Identifies Novel Regulators of Drosophila melanogaster TORC1-S6K Pathway Signaling. Genome Res. 2011, 21, 433–446. [DOI] [PMC free article] [PubMed] [Google Scholar]
- 81. Pelkmans L., Fava E., Grabner H., et al. Genome-Wide Analysis of Human Kinases in Clathrin- and Caveolae/Raft-Mediated Endocytosis. Nature 2005, 436, 78–86. [DOI] [PubMed] [Google Scholar]
- 82. O’Brien P. J., Irwin W., Diaz D., et al. High Concordance of Drug-Induced Human Hepatotoxicity with in Vitro Cytotoxicity Measured in a Novel Cell-Based Model Using High Content Screening. Arch. Toxicol. 2006, 80, 580–604. [DOI] [PubMed] [Google Scholar]
- 83. Florean C., Zampese E., Zanese M., et al. High Content Analysis of Gamma-Secretase Activity Reveals Variable Dominance of Presenilin Mutations Linked to Familial Alzheimer’s Disease. Biochim. Biophys. Acta 2008, 1783, 1551–1560. [DOI] [PubMed] [Google Scholar]
- 84. Havinga J., Horbach G. J. M. J., Schoonen W. G. E. J., et al. High Content Screening Analysis of Phospholipidosis: Validation of a 96-Well Assay with CHO-K1 and HepG2 Cells for the Prediction of in Vivo Based Phospholipidosis. Toxicol. Vitr. 2011, 25, 1870–1882. [DOI] [PubMed] [Google Scholar]
- 85. Grånäs C., Lundholt B. K., Heydorn A., et al. High Content Screening for G Protein-Coupled Receptors Using Cell-Based Protein Translocation Assays. Comb. Chem. High Throughput Screen. 2005, 8, 301–309. [DOI] [PubMed] [Google Scholar]
- 86. Leuchowius K.-J., Jarvius M., Wickström M., et al. High Content Screening for Inhibitors of Protein Interactions and Post-Translational Modifications in Primary Cells by Proximity Ligation. Mol. Cell. Proteomics 2010, 9, 178–183. [DOI] [PMC free article] [PubMed] [Google Scholar]
- 87. Christophe T., Jackson M., Jeon H. K., et al. High Content Screening Identifies Decaprenyl-Phosphoribose 2’ Epimerase as a Target for Intracellular Antimycobacterial Inhibitors. PLoS Pathog. 2009, 5, e1000645. [DOI] [PMC free article] [PubMed] [Google Scholar]
- 88. Blackmore M. G., Moore D. L., Smith R. P., et al. High Content Screening of Cortical Neurons Identifies Novel Regulators of Axon Growth. Mol. Cell. Neurosci. 2010, 44, 43–54. [DOI] [PMC free article] [PubMed] [Google Scholar]
- 89. Schulte J., Sepp K. J., Wu C., et al. High-Content Chemical and RNAi Screens for Suppressors of Neurotoxicity in a Huntington’s Disease Model. PLoS One 2011, 6, e23841. [DOI] [PMC free article] [PubMed] [Google Scholar]
- 90. Au Q., Kanchanastit P., Barber J. R., et al. High-Content Image-Based Screening for Small-Molecule Chaperone Amplifiers in Heat Shock. J. Biomol. Screen. 2008, 13, 953–959. [DOI] [PubMed] [Google Scholar]
- 91. Ross S., Chen T., Yu V., et al. High-Content Screening Analysis of the p38 Pathway: Profiling of Structurally Related p38alpha Kinase Inhibitors Using Cell-Based Assays. Assay Drug Dev. Technol. 2006, 4, 397–409. [DOI] [PubMed] [Google Scholar]
- 92. Borchert K. M., Galvin R. J. S., Frolik C. A., et al. High-Content Screening Assay for Activators of the Wnt/Fzd Pathway in Primary Human Cells. Assay Drug Dev. Technol. 2005, 3, 133–141. [DOI] [PubMed] [Google Scholar]
- 93. Nadanaciva S., Dillman K., Gebhard D. F., et al. High-Content Screening for Compounds That Affect mtDNA-Encoded Protein Levels in Eukaryotic Cells. J. Biomol. Screen. 2010, 15, 937–948. [DOI] [PubMed] [Google Scholar]
- 94. Starkuviene V., Liebel U., Simpson J. C., et al. High-Content Screening Microscopy Identifies Novel Proteins with a Putative Role in Secretory Membrane Traffic. Genome Res. 2004, 14, 1948–1956. [DOI] [PMC free article] [PubMed] [Google Scholar]
- 95. Andrews P. D., Becroft M., Aspegren A., et al. High-Content Screening of Feeder-Free Human Embryonic Stem Cells to Identify Pro-Survival Small Molecules. Biochem. J. 2010, 432, 21–33. [DOI] [PubMed] [Google Scholar]
- 96. Teunissen E. A., Mastrobattista E., de Raad M., et al. High-Content Screening of Peptide-Based Non-Viral Gene Delivery Systems. J. Control. Release 2012, 158, 433–442. [DOI] [PubMed] [Google Scholar]
- 97. Ibig-Rehm Y., Götte M., Gabriel D., et al. High-Content Screening to Distinguish between Attachment and Post-Attachment Steps of Human Cytomegalovirus Entry into Fibroblasts and Epithelial Cells. Antiviral Res. 2011, 89, 246–256. [DOI] [PubMed] [Google Scholar]
- 98. Giuliano K. A., Chen Y.-T., Taylor D. L. High-Content Screening with siRNA Optimizes a Cell Biological Approach to Drug Discovery: Defining the Role of P53 Activation in the Cellular Response to Anticancer Drugs. J. Biomol. Screen. 2004, 9, 557–568. [DOI] [PubMed] [Google Scholar]
- 99. Christen B., Fero M. J., Hillson N. J., et al. High-Throughput Identification of Protein Localization Dependency Networks. Proc. Natl. Acad. Sci. 2010, 107, 4681–4686. [DOI] [PMC free article] [PubMed] [Google Scholar]
- 100. Rae J., Fontaine F., Salim A. A., et al. High-Throughput Screening of Australian Marine Organism Extracts for Bioactive Molecules Affecting the Cellular Storage of Neutral Lipids. PLoS One 2011, 6, e22868. [DOI] [PMC free article] [PubMed] [Google Scholar]
- 101. Wong S. T. C., Xia X., Lipinski M. M., et al. Identification of Small Molecule Inhibitors of Neurite Loss Induced by A peptide using High Content Screening. J. Biol. Chem. 2012, 287, 8714–8723. [DOI] [PMC free article] [PubMed] [Google Scholar]
- 102. Wilson C. J., Si Y., Thompsons C. M., et al. Identification of a Small Molecule That Induces Mitotic Arrest Using a Simplified High-Content Screening Assay and Data Analysis Method. J. Biomol. Screen. 2006, 11, 21–28. [DOI] [PubMed] [Google Scholar]
- 103. Peltan A., Briggs L., Matthews G., et al. Identification of Drosophila Gene Products Required for Phagocytosis of Leishmania donovani. PLoS One 2012, 7, e51831. [DOI] [PMC free article] [PubMed] [Google Scholar]
- 104. Bonilla-Santiago R., Wu Z., Zhang L., et al. Identification of Growth Inhibiting Compounds in a Giardia lamblia High-Throughput Screen. Mol. Biochem. Parasitol. 2008, 162, 149–154. [DOI] [PMC free article] [PubMed] [Google Scholar]
- 105. Au Q., Zhang Y., Barber J. R., et al. Identification of Inhibitors of HSF1 Functional Activity by High-Content Target-Based Screening. J. Biomol. Screen. 2009, 14, 1165–1175. [DOI] [PubMed] [Google Scholar]
- 106. Whittaker R., Loy P. A., Sisman E., et al. Identification of MicroRNAs That Control Lipid Droplet Formation and Growth in Hepatocytes via High-Content Screening. J. Biomol. Screen. 2010, 15, 798–805. [DOI] [PubMed] [Google Scholar]
- 107. Tolliday N. J., VerPlank L., Schenone M., et al. Identification of Regulators of Polyploidization Presents Therapeutic Targets for Treatment of AMKL. Cell 2012, 150, 575–589. [DOI] [PMC free article] [PubMed] [Google Scholar]
- 108. Zhang B., Au Q., Yoon I. S., et al. Identification of Small-Molecule HSF1 Amplifiers by High Content Screening in Protection of Cells from Stress Induced Injury. Biochem. Biophys. Res. Commun. 2009, 390, 925–930. [DOI] [PubMed] [Google Scholar]
- 109. Bellomo E. A., Li W.-H., Chen S., et al. Imaging dynamic Insulin Release Using a Fluorescent Zinc Indicator for Monitoring Induced Exocytotic Release (ZIMIR). Proc. Natl. Acad. Sci. 2011, 108, 21063–21068. [DOI] [PMC free article] [PubMed] [Google Scholar]
- 110. Vasudevan C., Fursov N., Maunder P., et al. Improving High-Content-Screening Assay Performance by Using Division-Arrested Cells. Assay Drug Dev. Technol. 2005, 3, 515–523. [DOI] [PubMed] [Google Scholar]
- 111. Arrasate M., Mitra S., Schweitzer E. S., et al. Inclusion Body Formation Reduces Levels of Mutant Huntingtin and the Risk of Neuronal Death. Nature 2004, 431, 805–810. [DOI] [PubMed] [Google Scholar]
- 112. Bertelsen M., Sanfridson A. Inflammatory Pathway Analysis Using a High Content Screening Platform. Assay Drug Dev. Technol. 2005, 3, 261–271. [DOI] [PubMed] [Google Scholar]
- 113. Nadler-Holly M., Breker M., Gruber R., et al. Interactions of Subunit CCT3 in the Yeast Chaperonin CCT/TRiC with Q/N-Rich Proteins Revealed by High-Throughput Microscopy Analysis. Proc. Natl. Acad. Sci. U. S. A. 2012, 109, 18833–18838. [DOI] [PMC free article] [PubMed] [Google Scholar]
- 114. Kuijl C., Savage N. D. L., Marsman M., et al. Intracellular Bacterial Growth Is Controlled by a Kinase Network around PKB/AKT1. Nature 2007, 450, 725–730. [DOI] [PubMed] [Google Scholar]
- 115. Ainscow E. K., Pilling J. E., Brown N. M., et al. Investigations into the Liver Effects of Ximelagatran Using High Content Screening of Primary Human Hepatocyte Cultures. Expert Opin. Drug Saf. 2008, 7, 351–365. [DOI] [PubMed] [Google Scholar]
- 116. Westphal A. J., Price P. B., Leighton T. J., et al. Kinetics of Size Changes of Individual Bacillus thuringiensis Spores in Response to Changes in Relative Humidity. Proc. Natl. Acad. Sci. 2003, 100, 3461–3466. [DOI] [PMC free article] [PubMed] [Google Scholar]
- 117. Antczak C., Takagi T., Ramirez C. N., et al. Live-Cell Imaging of Caspase Activation for High-Content Screening. J. Biomol. Screen. 2009, 14, 956–969. [DOI] [PMC free article] [PubMed] [Google Scholar]
- 118. Hersen P., Batt G., Fages F., et al. Long-Term Model Predictive Control of Gene Expression at the Population and Single-Cell Levels. Proc. Natl. Acad. Sci. 2012, 109, 14271–14276. [DOI] [PMC free article] [PubMed] [Google Scholar]
- 119. Danielsson F., Skogs M., Huss M., et al. Majority of Differentially Expressed Genes Are Down-Regulated during Malignant Transformation in a Four-Stage Model. Proc. Natl. Acad. Sci. 2013, 110, 6853–6858. [DOI] [PMC free article] [PubMed] [Google Scholar]
- 120. DeBolt S., Gutierrez R., Ehrhardt D. W., et al. Morlin, an Inhibitor of Cortical Microtubule Dynamics and Cellulose Synthase Movement. Proc. Natl. Acad. Sci. 2007, 104, 5854–5859. [DOI] [PMC free article] [PubMed] [Google Scholar]
- 121. Ross D. A., Lee S., Reiser V., et al. Multiplexed Assays by High-Content Imaging for Assessment of GPCR Activity. J. Biomol. Screen. 2008, 13, 449–455. [DOI] [PubMed] [Google Scholar]
- 122. Carter C. A. Multiplexed High Content Screening Reveals That Cigarette Smoke Condensate-Altered Cell Signaling Pathways Are Accentuated through FAK Inhibition in Human Bronchial Cells. Int. J. Toxicol. 2012, 31, 257–266. [DOI] [PubMed] [Google Scholar]
- 123. Carter C. A., Hamm J. T. Multiplexed Quantitative High Content Screening Reveals That Cigarette Smoke Condensate Induces Changes in Cell Structure and Function through Alterations in Cell Signaling Pathways in Human Bronchial Cells. Toxicology 2009, 261, 89–102. [DOI] [PubMed] [Google Scholar]
- 124. Hardt W.-D., Chabria M., Misselwitz B., et al. Near Surface Swimming of Salmonella typhimurium Explains Target-Site Selection and Cooperative Invasion. PLoS Pathog. 2012, 8, e1002810. [DOI] [PMC free article] [PubMed] [Google Scholar]
- 125. Moese S., McDowell R., Schwendener R., et al. Niclosamide Is a Proton Carrier and Targets Acidic Endosomes with Broad Antiviral Effects. PLoS Pathog. 2012, 8, e1002976. [DOI] [PMC free article] [PubMed] [Google Scholar]
- 126. Haasen D., Merk S., Seither P., et al. Pharmacological Profiling of Chemokine Receptor-Directed Compounds Using High-Content Screening. J. Biomol. Screen. 2008, 13, 40–53. [DOI] [PubMed] [Google Scholar]
- 127. Yuen D., Reisen F., Chen L., et al. PNAS Plus: Phenotype-Based High-Content Chemical Library Screening Identifies Statins as Inhibitors of in Vivo Lymphangiogenesis. Proc. Natl. Acad. Sci. 2012, 109, E2665–E2674. [DOI] [PMC free article] [PubMed] [Google Scholar]
- 128. Neumann B., Walter T., Hériché J.-K., et al. Phenotypic Profiling of the Human Genome by Time-Lapse Microscopy Reveals Cell Division Genes. Nature 2010, 464, 721–727. [DOI] [PMC free article] [PubMed] [Google Scholar]
- 129. Prigozhina N. L., Zhong L., Hunter E. A., et al. Plasma Membrane Assays and Three-Compartment Image Cytometry for High Content Screening. Assay Drug Dev. Technol. 2007, 5, 29–48. [DOI] [PubMed] [Google Scholar]
- 130. Hughes H. V., Huitema E., Pritchard S., et al. Protein Localization and Dynamics within a Bacterial Organelle. Proc. Natl. Acad. Sci. 2010, 107, 5599–5604. [DOI] [PMC free article] [PubMed] [Google Scholar]
- 131. Ghosh R. N., DeBiasio R., Hudson C. C., et al. Quantitative Cell-Based High-Content Screening for Vasopressin Receptor Agonists Using Transfluor Technology. J. Biomol. Screen. 2005, 10, 476–484. [DOI] [PubMed] [Google Scholar]
- 132. Han E., Tak Y. K., Song J. M., et al. Real-Time Concurrent Monitoring of Apoptosis, Cytosolic Calcium, and Mitochondria Permeability Transition for Hypermulticolor High-Content Screening of Drug-Induced Mitochondrial Dysfunction-Mediated Hepatotoxicity. Toxicol. Lett. 2012, 214, 175–181. [DOI] [PubMed] [Google Scholar]
- 133. Schembri L., Zanese M., Depierre-Plinet G., et al. Recombinant differential Anchorage Probes That Tower over the Spatial Dimension of Intracellular Signals for High Content Screening and Analysis. Anal. Chem. 2009, 81, 9590–9598. [DOI] [PubMed] [Google Scholar]
- 134. Xu Y., Zhu X., Hahm H. S., et al. Revealing a Core Signaling Regulatory Mechanism for Pluripotent Stem Cell Survival and Self-Renewal by Small Molecules. Proc. Natl. Acad. Sci. 2010, 107, 8129–8134. [DOI] [PMC free article] [PubMed] [Google Scholar]
- 135. Wu C.-C., Chawla F., Games D., et al. Selective Vulnerability of Dentate Granule Cells Prior to Amyloid Deposition in PDAPP Mice: Digital Morphometric Analyses. Proc. Natl. Acad. Sci. 2004, 101, 7141–7146. [DOI] [PMC free article] [PubMed] [Google Scholar]
- 136. Snijder B., Sacher R., Rämö P., et al. Single-Cell Analysis of Population Context Advances RNAi Screening at Multiple Levels. Mol. Syst. Biol. 2012, 8, 579. [DOI] [PMC free article] [PubMed] [Google Scholar]
- 137. Tay S., Hughey J. J., Lee T. K., et al. Single-Cell NF-kappaB Dynamics Reveal Digital Activation and Analogue Information Processing. Nature 2010, 466, 267–271. [DOI] [PMC free article] [PubMed] [Google Scholar]
- 138. Reiter J. F., Arkin M. R., Wu V. M., et al. Small Molecule Inhibitors of Smoothened Ciliary Localization and Ciliogenesis. Proc. Natl. Acad. Sci. 2012, 109, 13644–13649. [DOI] [PMC free article] [PubMed] [Google Scholar]
- 139. Zhang L., Yu J., Pan H., et al. Small Molecule Regulators of Autophagy Identified by an Image-Based High-Throughput Screen. Proc. Natl. Acad. Sci. 2007, 104, 19023–19028. [DOI] [PMC free article] [PubMed] [Google Scholar]
- 140. Xie C., Zhang H., Shimkets L. J., et al. Statistical Image Analysis Reveals Features Affecting Fates of Myxococcus xanthus Developmental Aggregates. Proc. Natl. Acad. Sci. 2011, 108, 5915–5920. [DOI] [PMC free article] [PubMed] [Google Scholar]
- 141. Collinet C., Stöter M., Bradshaw C. R., et al. Systems Survey of Endocytosis by Multiparametric Image Analysis. Nature 2010, 464, 243–249. [DOI] [PubMed] [Google Scholar]
- 142. Guzi T. J., Paruch K., Dwyer M. P., et al. Targeting the Replication Checkpoint Using SCH 900776, a Potent and Functionally Selective CHK1 Inhibitor Identified via High Content Screening. Mol. Cancer Ther. 2011, 10, 591–602. [DOI] [PubMed] [Google Scholar]
- 143. Barabasz A., Foley B., Otto J. C., et al. The Use of High-Content Screening for the Discovery and Characterization of Compounds That Modulate Mitotic Index and Cell Cycle Progression by Differing Mechanisms of Action. Assay Drug Dev. Technol. 2006, 4, 153–163. [DOI] [PubMed] [Google Scholar]
- 144. Lee J.-Y., Colinas J., Wang J. Y., et al. Transcriptional and Posttranscriptional Regulation of Transcription Factor Expression in Arabidopsis Roots. Proc. Natl. Acad. Sci. 2006, 103, 6055–6060. [DOI] [PMC free article] [PubMed] [Google Scholar]
- 145. Devreotes P. N., Rohlfs M., Batsios P., et al. Tumor Suppressor Hippo/MST1 Kinase Mediates Chemotaxis by Regulating Spreading aAnd Adhesion. Proc. Natl. Acad. Sci. 2012, 109, 13632–13637. [DOI] [PMC free article] [PubMed] [Google Scholar]
- 146. Ramirez C. N., Ozawa T., Takagi T., et al. Validation of a High-Content Screening Assay Using Whole-Well Imaging of Transformed Phenotypes. Assay Drug Dev. Technol. 2011, 9, 247–261. [DOI] [PMC free article] [PubMed] [Google Scholar]
- 147. Kim M. J., Lim C., Lee J. Y., et al. Visible-to-Near IR Quantum Dot-Based Hypermulticolor High-Content Screening of Herbal Medicines for the Efficacy Monitoring of Hair Growth Promotion and Hair Loss Inhibition. J. Biomol. Screen. 2013, 18, 462–473. [DOI] [PubMed] [Google Scholar]
- 148. Benn A. E., Hopkins A. L., Bickle Q. D., et al. Whole Organism High-Content Screening by Label-Free, Image-Based Bayesian Classification for Parasitic Diseases. PLoS Negl. Trop. Dis. 2012, 6, e1762. [DOI] [PMC free article] [PubMed] [Google Scholar]
- 149. Jee J., Jeon H., Hwang D., et al. High Content Screening for Compounds That Induce Early Stages of Human Embryonic Stem Cell Differentiation. Comb. Chem. High Throughput Screen. 2012, 15, 656–665. [DOI] [PubMed] [Google Scholar]
- 150. Sexton J. Z., He Q., Forsberg L. J., et al. High Content Screening for Non-Classical Peroxisome Proliferators. Int. J. High Throughput Screen. 2010, 2010, 127–140. [DOI] [PMC free article] [PubMed] [Google Scholar]