

Abstract
Human bone marrow mesenchymal stem cells (hBMSCs) represents one of the most frequently applied cell sources for clinical bone regeneration. To achieve the greatest therapeutic effect, it is crucial to evaluate the osteogenic differentiation potential of the stem cells during their culture before the implantation. However, the practical evaluation of stem cell osteogenicity has been limited to invasive biological marker analysis that only enables assaying a single end-point. To innovate around invasive quality assessments in clinical cell therapy, we previously explored and demonstrated the positive predictive value of using time-course images taken during differentiation culture for hBMSC bone differentiation potential. This initial method establishes proof of concept for a morphology-based cell evaluation approach, but reveals a practical limitation when considering the need to handle large amounts of image data. In this report, we aimed to scale-down our proposed method into a more practical, efficient modeling scheme that can be more broadly implemented by physicians on the frontiers of clinical cell therapy. We investigated which morphological features are critical during the osteogenic differentiation period to assure the performance of prediction models with reduced burden on image acquisition. To our knowledge, this is the first detailed characterization that describes both the critical observation period and the critical number of time-points needed for morphological features to adequately model osteogenic potential. Our results revealed three important observations: (i) the morphological features from the first 3 days of differentiation are sufficiently informative to predict bone differentiation potential, both activities of alkaline phosphatase and calcium deposition, after 3 weeks of continuous culture; (ii) intervals of 48 h are sufficient for measuring critical morphological features; and (iii) morphological features are most accurately predictive when early morphological features from the first 3 days of differentiation are combined with later features (after 10 days of differentiation). Biotechnol. Bioeng. 2014;111: 1430–1439.
Keywords: image-based analysis, mesenchymal stem cell, non-invasive analysis, osteogenic differentiation, prediction
Introduction
At present, the regenerative medicine market is still limited when one considers its potential impact on clinical practice. Currently, technological developments for commercial advancement of regenerative medicine are focused on cell culture automation technologies. For the purpose of industrialization, higher expectations for standardization are now required for automation technology; platforms need to improve both quality of results and cost effectiveness (Ratcliffe 2011; Smith 2012). Recently, advances in novel imaging technologies, used to support image-based cell evaluation, have improved performance to the point where quantitative evaluation of detailed cellular events is now possible (Becker and Madany, 2012; Erdmann et al., 2012; Hong et al., 2006; Kino-oka et al., 2009; Li et al., 2010; Platt et al., 2009; Poirier-Quinot et al., 2010; Seiler et al., 2012; Unadkat et al., 2012). Non-destructive imaging methods have shown particular compatibility with cell therapy, which requires intact cells for therapy during and after their evaluations. The historical use of microscopy for cell quality evaluation suggests that morphological parameters can empirically define cell quality, but to-date no objective morphometric criteria have been directly linked to osteogenic potential (Maul et al., 2011; Platt et al., 2009; Seiler et al., 2012; Wang et al., 2013; Zhang and Kilian, 2013).
By focusing on cellular morphological information, we previously reported a non-invasive cell quality evaluation method for predicting the osteogenic differentiation potential of human bone marrow-derived mesenchymal stem cells (hBMSCs), by using only time-course collected phase contrast images (Matsuoka et al., 2013). The clinical utility of our proposed method improves upon previous reports by more accurately predicting osteogenic potential. Also, our experimental framework is designed to overcome common biases of conventional morphology-/image-based cell quality analysis approaches by satisfying three essential criteria for obtaining high-performance models: (i) timely information extracted from precisely timed image capture, assured by a fully scheduled image acquisition system; (ii) unbiased information described by carefully selected features, which are not interdependent, thereby eliminating researcher subjectivity biases; and (iii) reliable information described by features derived from sampling statistically relevant numbers of cells.
Our proposed image-based cell quality prediction presents a significant technological advancement that offers several advantages over conventional measures of hBMSC differentiation potential. Conventional differentiation markers can only be measured once, when differentiation is complete. Our proposed non-destructive method preserves all cells, which maximizes the amount of viable material for therapeutic use. Our approach also allows the continuous evaluation of the same cells from the first day to the final day. The ability to repeat measurements on the same cell population provides a greater opportunity to accurately predict optimal timing for use of the cells. An image-based cell quality assessment tool can offer new choices for clinical physicians to supply additional quality assurances for the production of cells for therapy. Especially with their heterogenic diversity of stem cells, the image-based evaluation, which measures every single cell in the culture vessel, can be a powerful tool for total cell evaluation.
However, our proposed method left some tasks to be solved for more practical usage to satisfy both the efficacy and the profitability. Since proposing the original method, we re-evaluated the large collected data set consisting of 9,990 images covering 14 days (8 h intervals) of the differentiation period. We considered that the image-dense data required to implement our method may pose a potential obstacle for clinical implementation. A fully automatic image acquisition system to support image data analysis is not always a justifiable investment for clinics performing the latest cell therapies. In facilities already performing clinical research with established standard operating procedures, changing an automated sample handling system is also not always feasible. Physical space is another limiting consideration when introducing an automation platform into a clinical environment. Therefore, to make our proposed method more widely available, we aimed to breakdown, simplify and refine the prediction scheme into a practical, resource-efficient application without losing performance. We also considered the resource demands when re-evaluating our original method: (i) the worker time involved in each image acquisition, (ii) the additional costs to fund operators for timed images at night and on weekends, (iii) the frequency and cost of occupying and maintaining the defined area (such as clean rooms), (iv) the effort of scheduling operators and space to obtain image data, and (v) the expense of purchasing, labor and maintenance of image storage media. Based on the weight of these considerations, we investigated the minimum image acquisition conditions to assure high prediction performance if our method was implemented using manual procedures rather than fully automated. In this work, we launched our investigation of constructing high-quality, resource-efficient hBMSC prediction models by aiming to define essential morphology parameters. To achieve this aim, we vetted two aspects of the information derived from cellular images during osteogenic differentiation: (i) the critical period for defining cell quality by their morphological features, and (ii) the optimal density of morphological information while retaining prediction performance. To our knowledge, there has been no detailed analysis that critically weighs the content of cellular images for the purpose of informing cell quality predictions based on cellular morphology. Since manual observation of cellular morphology has historically supported cell production, a detailed characterization of morphological characteristics over a period of time should yield deeper insights into the prediction sensitivity, and also the biological meaning of morphology-based decisions executed by cell biologists.
In this study, we used three types of algorithm modification for the characterization of morphological features: (i) shortening type: dataset characterization where the inclusion rate of morphological features along a time-line is shortened; (ii) window-shift type: dataset characterization where the inclusion period for morphological features is changed along a time-line; and (iii) skipping type: dataset characterization where the density of morphological features is reduced by decreasing time-point sampling frequency. By comparing changes in each type of model's prediction performance, we could define the sensitivity of morphological signals for detecting collapse of hBMSC differentiation potential. We also defined the most resource-effective scheme to collect the morphological parameters to predict osteogenic differentiation potential. Our data shows not only the key conditions for feasible implementation of our proposed method by clinical physicians, but also the modeling approach that maximally satisfies both quality and efficiency of image-based cell quality prediction modeling.
Materials and Methods
Cells and Culture
Three lots of human bone marrow which were derived mesenchymal stem cells (hBMSCs) (Lonza Walkersville, Inc., Walkersville, MD) were designated as Lot 1 (strain number 15000-1, unknown race, Male, 19-year-old), Lot 2 (strain number 17174, Oriental, Male, 20-year-old), Lot 3 (strain number 11533, Black, Male, 22-year-old). Groups of cells with different passage number were prepared by expanding three lots of hBMSCs in growth medium (passage 3–5 for lot 1 and 2, passage 6–8 for lot 3) based on the clinical jaw bone therapy protocol used by our group (Kagami et al., 2011). The previously described osteogenic differentiation protocol was simultaneously applied to these cells and images acquired in parallel (detailed protocol described in Matsuoka et al., 2013). Briefly, as indicated in Figure 1, cells were seeded at a density of 1.0 × 10⁴ cells/well in 12-well plate (Greiner Bio-One, Frickenhausen, Germany), and the cell-seeding day was designated as day 0 and cultured for expansion from days 4 to 0 in α-modified Eagle's medium (αMEM) containing 10% fetal bovine. From days 1 to 14, cells were divided into two groups: (i) osteogenic-induction group (Induction, N = 6) and (ii) non-induction group (Control, N = 6). For the Induction group, the medium was switched to induction medium consisting of 10% FBS-containing αMEM medium supplemented with 10 nM dexamethasone (Sigma-Aldrich Corp., St. Louis, MO), 100 mM ascorbic acid (Wako Pure Chemical Industries, Ltd., Osaka, Japan), and 10 mM glycerol 2-phosphate sodium salt hydrate (Sigma-Aldrich Co.). For the non-induction group, no supplements were added to the αMEM medium containing 10% FBS. The medium was refreshed at days 3 and 9. For half of the samples in each experimental group (N = 3), alkaline phosphatase (ALP) activity was quantified on day 14, and for the rest (N = 3), calcium deposition was quantified on day 21.
Figure 1.
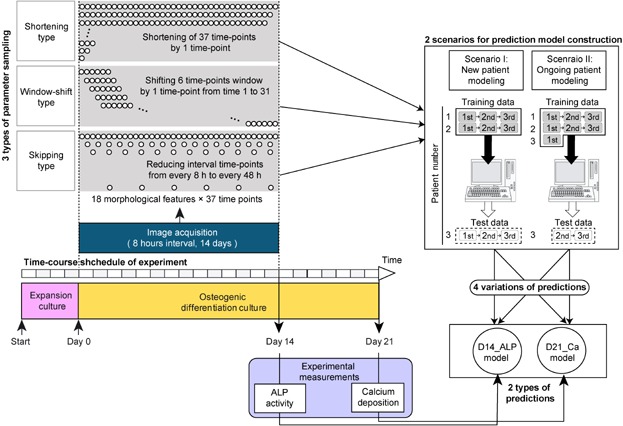
Schematic illustration of experimental procedures for constructing morphology-based prediction models for osteogenic differentiation potential. In the time-course experiment, an osteogenic differentiation culture period (21 days) followed the expansion culture period (4 days). For the first 14 days of differentiation culture phase contrast microscopic images were automatically acquired at 8 h intervals (total 37 time-points) using BioStation CT (Nikon). From acquired images, morphological features were extracted through image processing (total 666 morphological features). Three types of feature variation were compared: (i) Shortening type, a systematic examination of the impact of decreasing the overall duration of the experimental time-line; (ii) Window-shift type, a 6-time-point scan of the 14 day time-course to explore the possibility of a critical time window; and (iii) Skipping type, an evaluation of the critical sampling frequency between time-points. Circles in the upper-left panel represent image collection time-points. On day 14, samples were collected for experimental measurement of ALP activity. On day 21, samples were collected for calcium deposition measurement. The model predicting ALP activity on day 14 was designated as D14_ALP, and the model predicting calcium deposition rate on day 21 was designated as D21_Ca. For both prediction models, two different scenarios for model construction were examined. Scenario I: New patient modeling, which attempted to predict a new patient's cell potential from historical image data of previous patients, and Scenario II: Ongoing patient modeling, which attempted to predict new patient's cell potential by combining the historical image data of previous patients together with the patient's own image data from early culture stages.
Image Acquisition
During the osteogenic differentiation culture period, phase contrast microscopic images of hBMSCs were obtained using the BioStation CT (Nikon Co., Tokyo, Japan). Five view fields (center position and four positions at 2.2 mm from the center) of phase contrast images were acquired from each well at 8 h intervals covering 8 h (first image acquisition) to 320 h (last image acquisition) covering a total of 14 days. Among all 40 time-points scheduled, three time-points were omitted from analysis. Data at 8 h was omitted since the cells were not yet fully settled. Data at time 64 h and time 216 h were also omitted, since the image acquisition schedule conflicted with scheduled medium changes. As a consequence of these omissions, we re-numbered the retained data sequentially from time-point 1 (16 h after the differentiation start) to time-point 37 (320 h after the differentiation start).
Quantification of Osteogenic Differentiation Rates
Quantitative ALP activity and calcium deposition assays, which are conventional destructive experiments, were performed as previously described (Matsuoka et al., 2013). Briefly, after 14 days of differentiation culture, ALP activity was measured with a p-nitrophenyl phosphate solution and normalized to the total cell number. Since ALP activity measurement has been known as insufficient osteogenic differentiation marker in the clinical trials, calcium deposition was also measured after an additional 7 days of culture using an alizarin red staining method, to enhance the meaning of quantification of osteogenic differentiation potential.
Cell Image Processing
Cell image processing was performed as described in our previous reports (Matsuoka et al., 2013; Sasaki et al., 2013). Briefly, all images were processed using MetaMorph software (Molecular Devices, Sunnyvale, CA) with the original filter sets. After binarization, the following nine morphological features of all cellular objects in each image were measured: (i) breadth, (ii) elliptical form factor, (iii) fiber breadth, (iv) fiber length, (v) hole area, (vi) inner radius, (vii) relative hole area, (viii) shape factor, and (ix) total area. For each parameter, the average (AVE) and standard deviation (SD) of five view fields, consisting of about 4,000–40,000 cells, were calculated, yielding 18 features (consist of AVE and SD for nine features). Such AVE and SD information encompassing the time-course of 38-time-points are assigned to describe the statistical changes that arise in heterogenic group of cells. The final total features consisted of 666 features (18 morphological features within each of 37 time-points). From all of these parameters, key features were selected using the three types of dataset characterization described in the Construction and prediction models section. Morphological features were directly associated with the morphological measurement data, which were experimentally determined values, resulting in 54 samples (3 lots × 2 induction conditions × 3 passages × 3 wells) assigned with corresponding ALP values, and 54 samples assigned with calcium deposition values. This process linked the biological measurement with morphometric information to complete a dataset for use in prediction model construction.
Prediction Model Construction
To characterize the effects of morphological features on model performances to predict the osteogenic differentiation potential of hBMSCs, three types of data characterization concepts were examined with two types of target prediction models (D14_ALP and D21_Ca) constructed through two types of scenarios (scenario I and II) using ridge regression (Fig. 1). Three types of data characterization were defined as follows: (i) Shortening type: the number of morphological features was systematically decreased by 1 time-point for each sampling event along the time-course. For example, morphological features used for the full time-course included time-points 1–37 (666 features = 18 morphological features from 37 time-points); this was then shortened to time 1–36 (648 features = 18 morphological features from 36 time-points), then time 1–35(630 features = 18 morphological features from 35 time-points), and so on. (ii) Window-shift type: the number of time-points within an analysis set was fixed to 6 time-points (covering approximately 2 days), and their capture period was shifted along the time-course with 1 time-point. For example, beginning from time-point 1 the first 108 features (i.e., 18 morphological features × time-points 1–6) were included; beginning from time-point 2, the next time-matched 108 features were included (i.e., 18 morphological features × time-points 2–7), repeated to the final time-point. (iii) Skipping type: the number of morphological features included was decreased by increasing the time-point span by 8 h intervals. For example, 666 morphological features, including all time-point data at 8-h intervals were initially used, then the dataset was decreased to 342 features by increasing the time-point interval to 16-h, and so on. The detailed modeling process using ridge regression followed a previously described method (Hastie et al., 2009).
For each of the three types of parameter evaluations, four types of prediction models were constructed, which covered the two types of prediction goals and two types of modeling scenarios. The two types of prediction models were as follows: (i) D14_ALP model that aimed to predict the ALP activity value measured on 14th day from the preceding morphological features (days 1–14); and (ii) D21_Ca model that aimed to predict the calcium deposition value measured after an additional week of differentiation culture (day 21) from the previous week's morphological features (days 15–21).
For each model, two types of modeling scenarios were tested. In Scenario I, which is applied as a new patient modeling scheme, the prediction model does not use information from within the same lot of cells model training. For instance, when we examined 3 lots of hBMSCs with 18 samples per lot (54 samples in total), for each prediction output the prediction model was trained with 36 samples from 2 lots of cells (e.g., lots 1 and 2), and then used to predict performance of the 18 samples from the remaining lot (e.g., lot 3). This scenario was designed to provide the advantage of performing an accurate cell quality evaluation from a newly accepted patient using historical data collected from other patients' cells. In Scenario II, the ongoing patient approach, a model is built by incorporating early data derived from the patient's own cells into the training set. For example, when using data from 54 samples consisting of 3 lots of hBMSCs, the prediction model is trained with 42 samples consisting of 2 lots (e.g., lots 1 and 2), plus 6 early samples from the remaining lot (e.g., images from the first passage of lot 3), and then predicts the remaining 12 samples. This scenario was designed to take advantage of early data that may be generated when cell therapy requires more than two passages to expand cells in order to obtain therapeutically relevant cell numbers. This scenario makes use of stored information obtained from previous patients plus the patient's own cellular morphology data, which can be used to predict the future quality of a newly accepted patient's cells.
We calculated standardized error as a metric for evaluating the performance of the prediction models as follows:
| (1) |
| (2) |
(Estd, standardized error; Eave, averaged error; yp, prediction value; yt, teacher signal value; N, sample number; V, variance of all samples)
Performance is considered to be improved with a decrease in the standardized error. When the standardized error equals 1, the prediction yields are essentially equal to the average value for all test samples, which is equivalent to random guessing.
Results
Effect of Time-Course Length for the Prediction of Osteogenic Differentiation Potential Based on Image Data
We evaluated the performance of models derived from “shortening type” of dataset characterization to first determine the effect of morphological data acquisition period on predicting osteogenic differentiation potential (Fig. 2).
Figure 2.
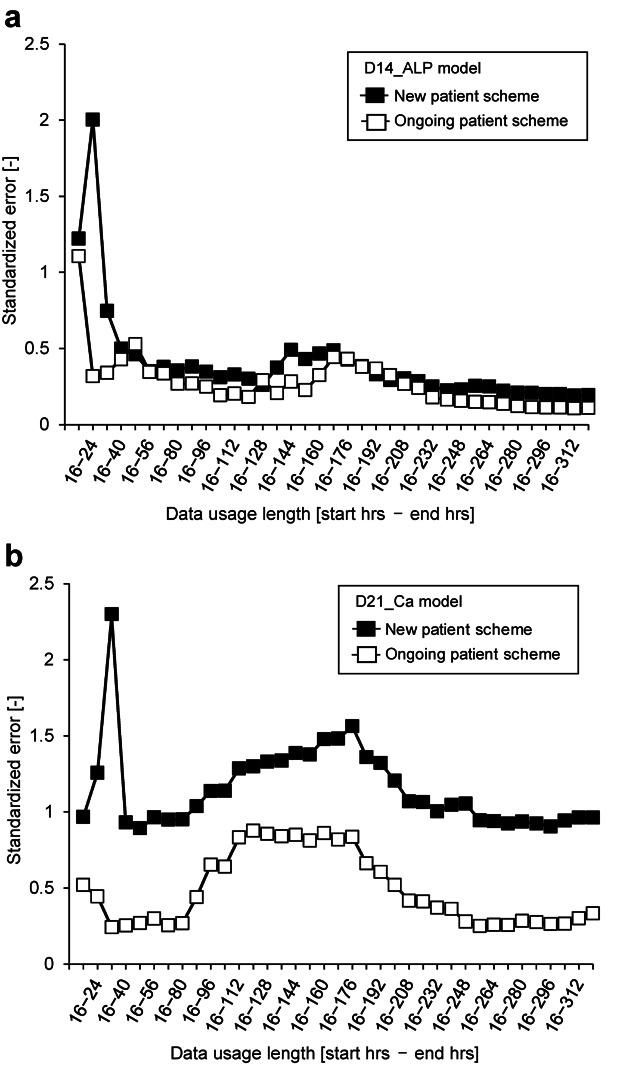
Prediction performance of “shortening type” use of morphological features. a: Performance of D14_ALP models. b: Performance of D21_Ca models. Filled squares and solid line, modeling with scenario I (new patient modeling); open squares and solid line, modeling with scenario II (ongoing patient modeling).
For both modeling scenarios, the prediction performance of the D14_ALP models were found to be high (standardized error < 0.5) for all models lacking morphology information collected after 40 h from start of induction (Fig. 2a). Surprisingly, in spite of the differences between construction scenarios, the prediction model using only morphological features from the first 2 days (precisely, 16–40 h) showed similar performance compared to the model using all information from the entire collection period. We have previously reported our scenario II to be the most effective modeling scenario by using all 14 days of morphological features. However, based on results from the present study, the scenario II-based models can reduce their data usage to only 8 h of data (16–24 h), which is sufficient to predict ALP activity after 14 days (Matsuoka et al., 2013). Considering aspects that have the greatest influence on diminishing performance, the scenario I-based models shifted performance drastically, when the morphological information from time-point 4 (40 h after the induction start) was removed, or when morphological features were limited to the very first day.
For D21_Ca models (Fig. 2b), we identified an observation time period that contributes uncertainty to the models. When morphological data from the culture period spanning 88–248 h is included in the model, we observe a noticeable decrease in model prediction accuracy. In contrast, features which cover only 48 h were found to construct models with consistent performance compared to the model using data from the entire sampling period (Fig. 2b). With D21_Ca, the difference in model between the two construction scenarios was marked. Our proposed approach with scenario II greatly enhanced performance of predicting further biological response after differentiation. Eight hours (16–24 h) of morphology measurements was also found to be sufficient to predict calcium deposition rate after 21 days of differentiation, which is similar to the findings when using D14_ALP models.
Effect of Image Collection Period Interval Within a Time-Course for Prediction of Osteogenic Differentiation Potential
The “window-shift type” of dataset characterization was evaluated to examine the critical time interval during which morphological information should be collected for the most accurate osteogenic differentiation model construction (Fig. 3). In our previous investigations, we found that a collection interval of approximately 2 days was sufficient to predict cellular quality (Sasaki et al., 2013); therefore, we set the size of the window to cover 2 days (6 time-points) and evaluated the effects of various 2 days intervals shifted over a total span of 14 days.
Figure 3.
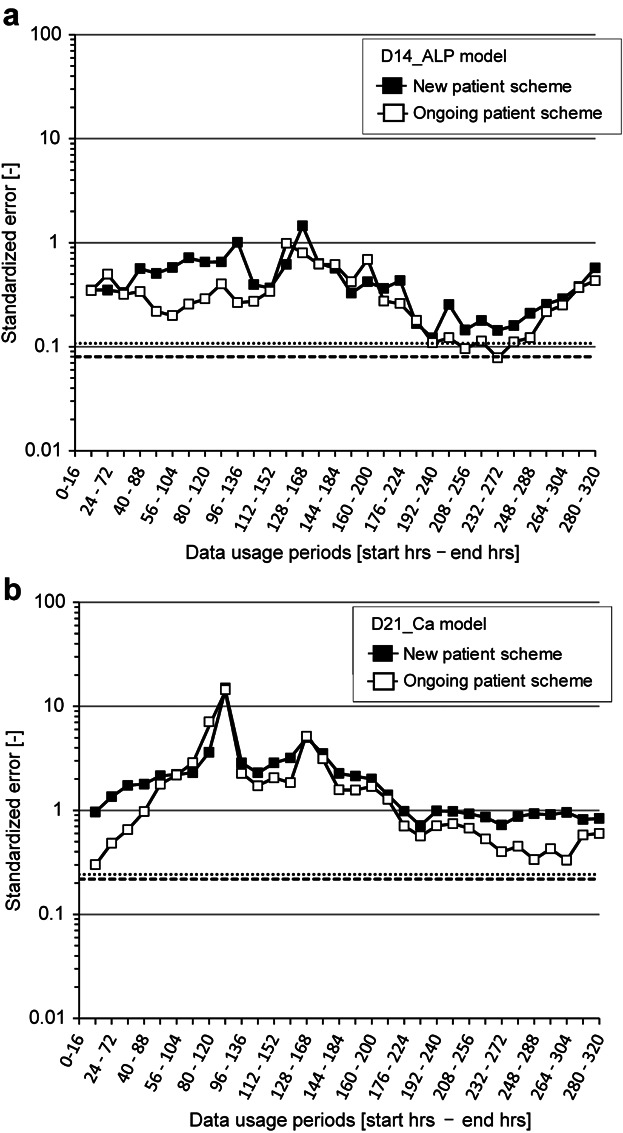
Prediction performance of “window-shift type” use of morphological features. a: Performance of D14_ALP models. b: Performance of D21_Ca models. Filled squares and solid line, modeling with scenario I (new patient modeling); open squares and solid line, modeling with scenario II (ongoing patient modeling). Dotted line, the lowest prediction error in Shortening type use of features; broken line, the lowest prediction error in Skipping type use of features. The axis indicating standard error is plotted in logarithmic scale for indicating a wider range of plots.
With a window-shift type of evaluation, we found that small numbers of morphological features gave stable and high prediction performance in D14_ALP models for most of the intervals tested. In contrast, D21_Ca model performances were poor in all intervals. Interestingly, we observed no significant differences in performance between scenarios I and II with the morphological features obtained from the 2 days period.
Effect of Image Data Sampling Frequency for Time-Course Prediction of Osteogenic Differentiation Potential
We evaluated the performance of models derived from “skipping type” data set characterization to explore the effect of image data density that would be sufficient for constructing accurate osteogenic differentiation models (Fig. 4). Starting with 8-h intervals from time-point 1 to 37, we decreased the frequency of image data collection, or “skipped” interim time-points, which diminished the density of the overall dataset.
Figure 4.

Prediction performance of “skipping type” use of morphological features. a: Performance of D14_ALP models. b: Performance of D21_Ca models. Filled bars, modeling with scenario I (new patient modeling); open bars, modeling with scenario II (ongoing patient modeling).
With D14_ALP models, prediction performance was nearly the same when using either 8- or 40-h sampling frequencies. Forty-eight hours sampling frequency was also found to be sufficient for clinical use. Scenario II constructed D21_Ca models also produced very highly accurate predictions using 48-h intervals. In contrast to the influence “skipping” data had in the D14_ALP models, the performance of D21_Ca models was enhanced by reducing the frequency of morphological features to 48-h intervals.
Discussion
To advance our previous findings, which proposed an automated approach for morphology-based prediction of osteogenic differentiation potential, we provide here a detailed critical evaluation of the image sampling requirements for morphological features of hBMSCs. Although an image-based cell quality assessment method provides greater advantages for industrialization of regenerative medicine due to its non-destructive nature, we designed this study to identify the critical morphological image sampling characteristics that would allow a resource-efficient prediction of osteogenic differentiation potential. Our focus was to balance accuracy, which can also be considered the prediction performance when only using microscopic images only, together with resource sparing, which considers the effort and expense required for its implementation. Thus, this study focused on reducing the resource demands of introducing our proposed cell quality prediction method in medical facilities that have to continuously run their current therapies without introduction of expensive hardware for automated image-acquisition. At the same time, we wanted to define the critical timing and number of morphological features that quantitatively allows detection of loss of hBMSC differentiation potential. In this study we reduced the data needed to be extracted from morphological features in order to predict both ALP activity (day 14) and calcium deposition rate (day 21) as compared to our previous report, in which we used a total of 666 morphological features (18 morphological features measured at 37 time-points, covering 14 days of differentiation culture) (Fig. 1).
Among all parameter reduction investigations, we found that modeling under scenario II (ongoing patient scenario) invariably provided better performance in both D14_ALP and D21_Ca models, compared to that under scenario I (new patient scenario). The strong performance of scenario II in this study was consistent with findings from our previous study and attributed to inclusion of the test patient's morphological data into the model. The present study also clarified that the weaker performance of scenario I models is not caused by improper use of morphological features, such as including a particularly noisy time-period or bias from overrepresentation of non-informative periods. We can now conclude more strongly that strong prediction performance of both ALP levels and calcium deposition can be achieved by following our scenario II modeling concept and focus further discussion only on scenario II modeling results.
From the performance of “shortening type” models (Fig. 2), we found that the minimum image-acquisition period could be shortened to the first 40 h after differentiation (standardized error < 0.5) in both D14_ALP and D21_Ca models. With a standardized error of 0.5, this prediction model is nearly twofold better than random guessing. It was surprising to find that the biochemical measurements of osteogenic differentiation after 2–3 weeks of culturing can be identified by morphological changes seen within the first 2 days. This finding indicates that a differentiation quality check of hBMSCs can be performed in a very early period, so that additional unnecessary culturing can be reduced.
The “window-shift type” model evaluation revealed a critical period for obtaining the most informative morphological features (Fig. 3). When attempting prediction with only 108 features (i.e., 16% of the information compared to that used in our original study), we found that the morphological changes in culture days 8–10 (D14_ALP model) and days 9–11 (D21_ALP model) are most informative and enhance prediction performance. This result largely matched the performance of “skipping type” models (Fig. 4). Most “skipping type” models exceeded the performance of models from the later stages in the “shortening type” analyses, which lost predictive strength in this portion of the time-course. The lack of later-stage morphological features correlated with decreased prediction performance in both D14_ALP and D21_Ca models, but more so in D21_Ca models, when derived from “shortening type” evaluations. This suggests morphological changes are informative in the first 2 days, but incorporation of morphological features from later stages of differentiation can further improve prediction accuracy. From this observation we conclude that acquiring additional images from the later stages of differentiation culture are not essential, but can add value to prediction models. Considering both observations from “shortening type” and “skipping type” evaluations, we conclude the image-acquisition from the first 2 days of a “shortening type” model, can be reduced by loosening the image acquisition schedule to a frequency of 48 h intervals without significant impact to correctly classifying candidate differentiation potential. An advantage to widening the sampling frequency to 48 h intervals is the ability to implement a manual version of this method in a clinical setting that frees up weekend time and mitigates resource burden on operators and facilities.
We also identified limitations of the morphological features reflecting cellular potential. As shown in Figure 4, the “shortening type” analysis revealed that including changes in morphological features from the first day (16–32 h) undermines the prediction performance. These observations suggest morphological changes in the first day of differentiation culture are likely more random compared to subsequent changes in morphology that more directly contribute to prediction of osteogenic potential. Since cells had attached sufficiently during the expansion culture period in the same plate wells prior to day 0 in our experiment, these extraordinary morphological changes are likely a response to changing the culture environment to differentiation medium. We therefore further examined the morphological responses to medium changes (Fig. 5). When the differentiation period started, medium was changed at 64 h (day 3) and at 216 h (day 10; Fig. 5a). Surprisingly, many morphological features showed irregular changes after the medium was refreshed, which we interpret as clear morphological responses to the medium change. When viewed collectively these morphological responses to medium change were limited to particular morphological features. The morphological parameter, “fiber lengths,” was one parameter sensitive to medium changes (Fig. 5b). Even though these changes were small from a statistical point of view, this parameter, which indicates cell shrinkage, was most sensitive to medium change across all cell lots. Although most of these features were insensitive to the second medium change at time-point 26, fiber length still reflected this change in the environment. We found a drift in model performance in the “shortening type” and “window-shift type” analyses, which was due to parameter disturbances reflecting this response to medium change. Based on our observations we suggest correcting for these types of morphological parameters, which may be a source of noise when used in predictions of cellular ostogenic potential. This finding also strongly indicates the possibility that cellular morphology changes can also be used to detect changes in cellular microenvironment as a way to quality check animal cells during high-throughput assays.
Figure 5.

Responses of morphological features to medium change events. Typical responses that appear in morphological features in all lots (a) and in Lot 1 (b) are shown as representative examples. (a) Heat map of morphological features (fiber length, shape factor, and total area) were shown with red (maximum) and green (minimum). Each square was colored based on the mean value of each morphological feature from all cells under 1 condition (3 wells × 5 view fields). Roughly, 4,000–40,000 cells were measured to obtain this mean value. (b) Longitudinal changes in average of Fiber length over time. Filled square, control samples; open square, induction samples. All average values were calculated as for Fig. 5a. Error bars indicate standard deviation. Red arrows indicate the timing of medium changes.
The utility of morphology-based cell quality evaluation has also been studied by Seiler et al. where they reported a systematic evaluation method for hBMSCs' differentiation potential based on morphological features measured from non-labeled time-course images (Seiler et al., 2012). Building on the work of Seiler et al. and their algorithm approach (node-harvest method), our original report greatly expands the utility of the image-based modeling concept by advancing the field in three areas: (i) improved model performance by data accuracy, (ii) various modeling scenarios for practical implementation in clinics, and (iii) quantitative prediction of osteogenic potential (versus classifications). The further iterations presented here add three more advancements: (i) identification of a critical period for measuring morphological features, (ii) the sensitivity of particular morphological features, and (iii) the most resource-efficient data collection method.
In conclusion, in this study, we were able to define the key characteristics of hBMSC morphological features to advance our image-based computational prediction model. The detailed characterization of morphological features in this study has demonstrated a way that allows practical, flexible and efficient introduction of our method, allowing users to most appropriately match facilities and protocols. Our next investigation to universalize this application should be the confirmation of our method under different imaging platforms. We believe that this is a benchmark study highlighting the importance of real-time morphological features for use in prediction modeling, which may trigger wider implementation of this approach to address the need for cell quality evaluation methods in regenerative medicine.
Acknowledgments
We are grateful to the New Energy and Industrial Technology Development Organization (NEDO) for the Grant for Industrial Technology Research (Financial Support to Young Researchers, 09C46036a) for financial support. We also thank Mai Okada and Yurika Nonogaki for help with experiments and data storage. We are deeply grateful to Wakana Yamamoto, Yoshihide Nagura, Kazuhiro Mukaiyama, Kenji Kojima, Hiroto Sasaki, and Asuka Miwa for establishing the basic analysis protocol and algorithms for the image analysis procedure.
References
- Becker T, Madany A. Morphology-based features for adaptive mitosis detection of in vitro stem cell tracking data. Methods Inf Med. 2012;51(5):449–456. doi: 10.3414/ME11-02-0038. [DOI] [PubMed] [Google Scholar]
- Erdmann G, Volz C, Boutros M. Systematic approaches to dissect biological processes in stem cells by image-based screening. Biotechnol J. 2012;7(6):768–778. doi: 10.1002/biot.201200117. [DOI] [PubMed] [Google Scholar]
- Hastie T, Tibshirani R, Friedman J. The elements of statistical learning: Data mining, inference, and prediction. New York, NY: Springer Science+Business Media; 2009. pp. 43–94. [Google Scholar]
- Hong L, Peptan IA, Xu H, Magin RL. Nondestructive evaluation of osteogenic differentiation in tissue-engineered constructs. J Orthop Res. 2006;24(5):889–897. doi: 10.1002/jor.20140. [DOI] [PubMed] [Google Scholar]
- Kagami H, Agata H, Tojo A. Bone marrow stromal cells (bone marrow-derived multipotent mesenchymal stromal cells) for bone tissue engineering: Basic science to clinical translation. Int J Biochem Cell Biol. 2011;43:286–289. doi: 10.1016/j.biocel.2010.12.006. [DOI] [PubMed] [Google Scholar]
- Kino-Oka M, Maeda Y, Sato Y, Maruyama N, Takezawa Y, Khoshfetrat AB, Sugawara K, Taya M. Morphological evaluation of chondrogenic potency in passaged cell populations. J Biosci Bioeng. 2009;107:544–551. doi: 10.1016/j.jbiosc.2008.12.018. [DOI] [PubMed] [Google Scholar]
- Li W, Hong L, Hu L, Magin RL. Magnetization transfer imaging provides a quantitative measure of chondrogenic differentiation and tissue development. Tissue Eng Part C Methods. 2010;16C(6):1407–1415. doi: 10.1089/ten.tec.2009.0777. [DOI] [PMC free article] [PubMed] [Google Scholar]
- Matsuoka F, Takeuchi I, Agata H, Kagami H, Shiono H, Kiyota Y, Honda H, Kato R. Morphology-based prediction of osteogenic differentiation potential of human mesenchymal stem cells. PLoS ONE. 2013;8(2):e55082. doi: 10.1371/journal.pone.0055082. [DOI] [PMC free article] [PubMed] [Google Scholar]
- Maul TM, Chew DW, Nieponice A, Vorp DA. Mechanical stimuli differentially control stem cell behavior: morphology, proliferation, and differentiation. Biomech Model Mechanobiol. 2011;10(6):939–953. doi: 10.1007/s10237-010-0285-8. [DOI] [PMC free article] [PubMed] [Google Scholar]
- Platt MO, Wilder CL, Wells A, Griffith LG, Lauffenburger DA. Multipathway kinase signatures of multipotent stromal cells are predictive for osteogenic differentiation: tissue-specific stem cells. Stem Cells. 2009;27(11):2804–2814. doi: 10.1002/stem.215. [DOI] [PMC free article] [PubMed] [Google Scholar]
- Poirier-Quinot M, Frasca G, Wilhelm C, Luciani N, Ginefri JC, Darrasse L, Letourneur D, Le Visage C, Gazeau F. High-resolution 1.5-Tesla magnetic resonance imaging for tissue-engineered constructs: a noninvasive tool to assess three-dimensional scaffold architecture and cell seeding. Tissue Eng Part C Methods. 2010;16C(2):185–200. doi: 10.1089/ten.TEC.2009.0015. [DOI] [PubMed] [Google Scholar]
- Ratcliffe A. The translation of product concept to bone products: A partnership of therapeutic effectiveness and commercialization. Tissue Eng B. 2011;17B(6):443–447. doi: 10.1089/ten.TEB.2011.0236. [DOI] [PubMed] [Google Scholar]
- Sasaki H, Matsuoka F, Yamamoto W, Kojima K, Honda H, Kato R. Image-based cell quality assessment: Modeling of cell morphology and quality for clinical cell therapy, studies in mechanobiology. Tissue Eng Biomater. 2013;10:207–226. [Google Scholar]
- Seiler C, Gazdhar A, Reyes M, Benneker LM, Geiser T, Siebenrock KA, Gantenbein-Ritter B. Time-lapse microscopy and classification of 2D human mesenchymal stem cells based on cell shape picks up myogenic from osteogenic and adipogenic differentiation. J Tissue Eng Regen Med. 2012;19 doi: 10.1002/term.1575. doi: 10.1002/term.1575. [DOI] [PubMed] [Google Scholar]
- Smith DM. Assessing commercial opportunities for autologous and allogeneic cell-based products. Regener Med. 2012;7(5):721–732. doi: 10.2217/rme.12.40. [DOI] [PubMed] [Google Scholar]
- Unadkat HV, Groen N, Doorn J, Fischer B, Barradas AM, Hulsman M, van de Peppel J, Moroni L, van Leeuwen JP, Reinders MJ, van Blitterswijk CA, de Boer J. High content imaging in the screening of biomaterial-induced MSC behavior. Biomaterials. 2012;34(5):1498–1505. doi: 10.1016/j.biomaterials.2012.10.035. [DOI] [PubMed] [Google Scholar]
- Wang W, Deng D, Li J, Liu W. Elongated cell morphology and uniaxial mechanical stretch contribute to physical attributes of niche environment for MSC tenogenic differentiation. Cell Biol Int. 2013;37(7):755–760. doi: 10.1002/cbin.10094. [DOI] [PubMed] [Google Scholar]
- Zhang D, Kilian KA. The effect of mesenchymal stem cell shape on the maintenance of multipotency. Biomaterials. 2013;34(16):3962–3969. doi: 10.1016/j.biomaterials.2013.02.029. [DOI] [PubMed] [Google Scholar]