Abstract
Purpose:
The purpose of this study is to build up the 3D pharmacophore of Monoacylglycerol lipase (MAGL) inhibitor and to provide the basis to design the novel and potent MAGL inhibitors.
Material and Method:
A 3D-QSAR study on benztriazol-1-yl carboxamide derivatives as monoacylglycerol lipase (MAGL) inhibitors was successfully performed by means of pharmacophore mapping using PHASE 3.5 module of Schrφdinger-9.4.
Result:
The 3D-QSAR obtained from APRRR-105 hypothesis was found to be statistically good with r2 = 0.9228 and q2 = 0.871, taking PLS factor 4. The statistical significance of the model was also confirmed by a high value of Fisher's ratio of 82.8 and a very low value of root-mean-square error (RMSE) 0.2564. Another parameter which signifies the model predictivity is Pearson R. Its value of 0.9512 showed that the correlation between predicted and observed activities for the test set compounds is excellent.
Conclusion:
The study suggested that one H-bond acceptor, one positive center, and proper positioning of hydrophobic groups near the distal aromatic ring C are the crucial determinants for MAGL inhibition. Thus, it can be assumed that the present QSAR analysis is enough to demonstrate MAGL inhibition with the help of APRRR-105 hypothesis and will be helpful in designing novel and potent MAGL inhibitors.
KEY WORDS: 3D-QSAR, benztriazol-1-yl carboxamides, monoacylglycerol lipase
Monoacylglycerol lipase (MAGL) is a serine hydrolase 33 kDa enzyme consisting of 303 amino acids. It hydrolyzes monoacylglycerols to glycerol and fatty acid through a catalytic triad mechanism consisting of the amino acids, Ser122, Asp239, and His269. It is a cytosolic enzyme that is also associated with membranes, with the highest expression in brain, white adipose tissue, and liver.[1,2,3,4] One of these monoacylglycerols is the endocannabinoid, 2-arachidonoylglycerol (2-AG), an endogenous full agonist at CB1 and CB2 G-protein coupled receptors.[5,6] Pathophysiological role of MAGL has been greatly studied in current years due to the accessibility of highly potent and selective inhibitors such as JZL184 and SAR629 [Figure 1], as well as the development of MAGL-deficient (−/−) mice.[7,8,9] Pharmacological or genetic knockdown of MAGL lowers 2-AG hydrolytic activity by more than 80% in most tissues including the brain, while the remaining 20% of 2-AG hydrolytic activity in brain arises from the uncharacterized serine hydrolases α/β hydrolase domain 6, ABHD6 and ABHD12.[10,11] MAGL-mediated hydrolysis of the 2-AG provides the major arachidonic acid (AA) precursor for pro-inflammatory eicosanoid synthesis in specific tissues.[12,13] Studies in recent years have shown that MAGL inhibitors elicit antinociceptive, anxiolytic, and antiemetic responses and attenuate precipitated withdrawal symptoms in addiction paradigms through attractive endocannabinoid signaling. MAGL inhibitors have also been shown to exert anti-inflammatory action in the brain and protect against neurodegeneration by decreasing eicosanoid production.[14,15,16,17,18] In cancer, MAGL inhibitors have been shown to have anticancer properties not only through modulating the endocannabinoid–eicosanoid network, but also by controlling fatty acid release for the synthesis of protumorigenic signaling lipids like phosphatidic acid (PA), lysophosphatidic acid (LPA), sphingosine-1-phosphate (S1P), and prostaglandins PGE2 and PGD2.[12] These stimulating findings suggest that pharmacological inhibition of MAGL may provide considerable therapeutic benefit.
Figure 1.
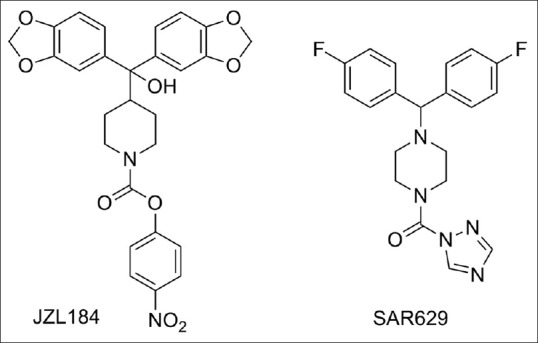
Established MAGL inhibitors JZL184 and SAR629
The purpose of this study is to build up the 3D pharmacophore of MAGL inhibitor and to provide the basis to design the novel and potent MAGL inhibitors. 3D-QSAR (Quantitative Structure Activity Relationship) has emerged as one of the most influential tools in ligand-based drug design approaches. 3D-QSAR involves the analysis of the quantitative relationship between the biological activity of compounds and their 3D structural properties using statistical correlation methods. The most important application of 3D-QSAR is lead optimization without knowing the receptor 3D structure. It allows 3D visual analysis for spatial arrangement of structural features with biological activity. In order to develop more potent and variable scaffold of MAGL inhibitors, a 3D-QSAR study was performed to establish the relationship between the spatial 3D pharmacophoric features of molecules and their MAGL inhibitory activity. A dataset comprising 37 benzotriazol-1-yl carboxamide derivatives with well-defined MAGL inhibitory activity was used to develop a robust 3D-QSAR model.
Materials and Methods
Dataset and method
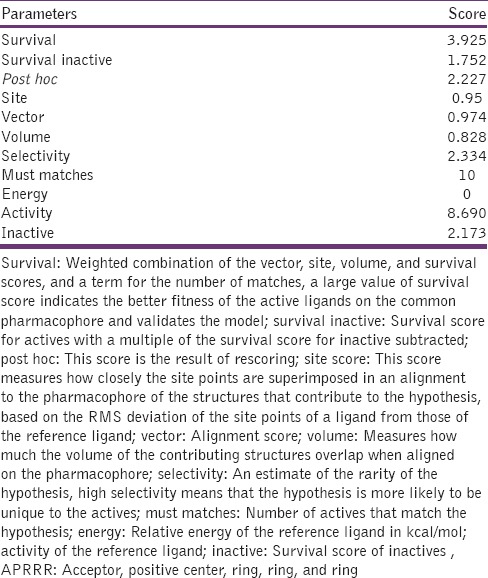
A successful 3D-QSAR study was performed to establish the relationship between the spatial 3D pharmacophoric features and MAGL activity of a class of benzotriazol-1-yl carboxamide derivatives synthesized by Morera et al.[19] The present 3D-QSAR study was performed with the dataset of 37 benzotriazol-1-yl carboxamide derivatives with well-defined MAGL inhibitory activity given as IC50 values in nanomolar concentration. For the correlation purpose, IC50 values were then converted to their molar values, and subseq uently, free energy-related terms were calculated, i.e. −log (1/IC50). The compounds with their inhibition data are summarized in Table 1. This dataset was then chosen for generating common pharmacophore hypotheses and then performing QSAR analysis. PHASE 3.5 module of Maestro-9.4 molecular modeling software was used to generate 3D pharmacophore models for selected series of MAGL inhibitors (PHASE 3.5, Schrö dinger, LLC, 2013). A pharmacophore conveys the characteristics of the three-dimensional arrangement of the pharmacophoric elements that are supposed to be critical for binding. A given hypothesis may be combined with known activity data to create a 3D-QSAR model that identifies the overall aspects of molecular structure which direct activity. The structures were sketched using maestro builder toolbar and were imported to develop pharmacophore model panel of the PHASE with their respective activity values. The ligands were assigned as actives with a threshold of pIC50 > 7.90 and inactives with a threshold of pIC50 < 6.97. The activity threshold value was selected on the basis of dataset activity distribution and the active ligands were chosen to derive a set of suitable pharmacophores. Sketched structures were energy-minimized/cleaned up by LigPrep module using OPLS_2005 force field, and proper protonation states were assigned to the ionizer subprogram at pH 7.2 ± 0.2 (LigPrep, Schrödinger, LLC, 2013). The conformations were generated with the help of MacroModel torsional sampling using OPLS_2005 force field (MacroModel, Schrödinger, LLC, 2013). Prepared ligands were then used for generating common pharmacophore hypothesis (CHP) and QSAR model generation. PHASE utilizes fine-grained conformational sampling and some scoring methods to identify the CHPs for a series of molecules that have particular target specificity. Each hypothesis conveys a particular 3D conformation of a set of ligands in which the ligands are going to bind to the receptor. The best hypothesis is then correlated with known biological activity values to generate a 3D-QSAR model which identifies the whole structural features of molecules that govern the activity.[20,21] Active analog approach was used to identify a CPH which has been applied in generating significant 3D-QSAR models.[22,23,24] The common pharmacophores were culled from the conformations of the set of active ligands using a tree-based partitioning technique which groups together similar pharmacophores according to their intersite distances. A tree depth of five with initial box size of 25.6 Å and final box size of 0.8 Å was used.[20,25] The resulting pharmacophore was then scored and ranked. The scoring was done to identify the best candidate hypothesis, which provided an overall ranking of all the hypotheses. The scoring algorithm included the contributions from the alignment of site points and vectors, volume overlap, selectivity, number of ligands matched, relative conformational energy, and activity. A detailed description about the scores can be found in the methodology research article where PHASE is described.[26] The selected APRRR-105 hypothesis with various scores is summarized in Table 2.
Table 1.
Structures of benzotriazol-1-yl carboxamide derivatives, along with their inhibition data

Table 2.
Scores of different parameters of the hypothesis APRRR-105
The best pharmacophore hypothesis APRRR-105 [Figure 2] was selected for further QSAR study. The above-mentioned 3D pharmacophore hypothesis [Figure 2a] encompasses the following features: One hydrogen bond acceptor (A) in pink color, one positive center (P) in sky blue color, and three aromatic rings (R) in yellow color. The 2D representation of the APRRR-105 hypothesis is given in Figure 2b. The 2D representation shows that the three aromatic rings (A, B, and C of benzotriazole and the distal phenyl ring), one positive center (piperazine), one hydrogen bond acceptor and the carbonyl functional group attached to the benzotriazole ring are the pharmacophoric elements of APRRR-105 hypothesis.
Figure 2.
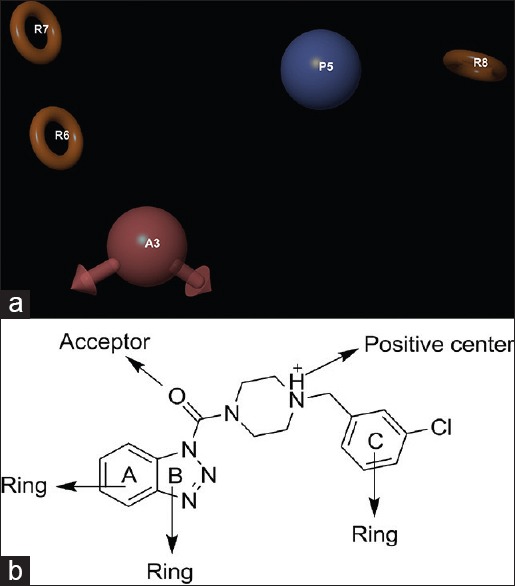
(a) Common pharmacophore for active ligands [one hydrogen bond acceptor (A) in pink color, one positive center (P) in sky blue color, and three aromatic rings (R) in yellow color]. (b) 2D representation of pharmacophore
Building of QSAR model
In this study, a significant 3D-QSAR model was generated using APRRR-105 hypothesis. For QSAR model generation, training and test partition was done by random selection method. Atom-based model selection criterion was chosen for model building.[27] PLS factor was set as 4. More the PLS factor value, more will be the reliability of models. Various models have been generated and the best model was selected on the basis of the statistical significance.
Results and Discussion
A successful 3D-QSAR study has been performed for substituted benztriazol-1-yl carboxamide derivatives to understand the effect of spatial arrangement of structural features on MAGL inhibition. Result of the 3D-QSAR is presented in Figure 3. The blue cubes in 3D plots of the 3D pharmacophore regions refer to ligand regions in which the specific feature is important for better activity, whereas the red cubes demonstrate that particular structural feature or functional group is not essential for the activity or likely to be the reason for decreased binding affinity. The statistical results of 3D-QSAR study are summarized in Table 3.
Figure 3.
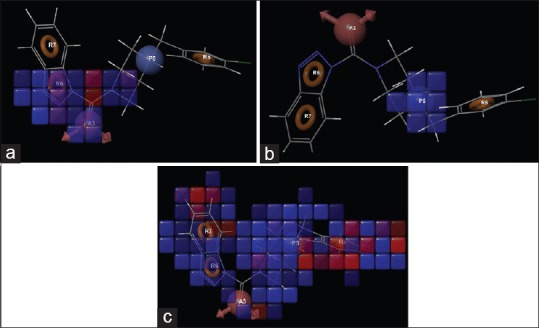
QSAR visualization of various substituents: (a) H-bond acceptor, (b) positive center, and (c) hydrophobic domain
Table 3.
3D-QSAR statistical parameters
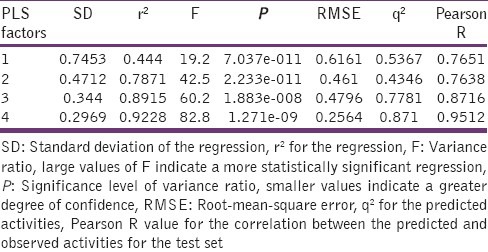
The reliability of the present 3D-QSAR analysis can be justified by the fact that all statistical measures are significant to any level. The model showed 99% variance exhibited by benztriazol-1-yl carboxamides, which is near to one and signified a very close agreement of fitting points on the regression line for the observed and PHASE-predicted activity. The fitness graph is shown in Figure 4 and the observed and PHASE-predicted activity data are summarized in Table 4. Validity of the model can be expressed by internal predictivity (q2 = 0.871) which is obtained by leave-one out (LOO). The q2 obtained by LOO method is a more reliable and robust statistical parameter than r2 because it is obtained by external validation method of dividing the dataset into training and test set. The large value of F (82.8) indicates a statistically significant regression model, which is supported by the small value of the variance ratio (P), an indication of a high degree of confidence. Further small values of standard deviation of the regression (0.2969) and root-mean-square error (RMSE; 0.2564) make an obvious implication that the data used for model generation are best for the QSAR analysis. Apart from the above-mentioned features, PLS factor also confirms the reliability of the model. In this study, the number of PLS factor was taken as 4, and for each increment, it gives one equation and there should be stepwise improvement each time the model generated. In addition to the above parameters, it is interesting to note that active ligands are closely fitted to the regression line and inactive ligands are scattered [Figure 5]. Figure 3 shows the 3D-pharmacophore regions around compounds. For the selected pharmacophore, blue and red cubes represent favorable and unfavorable regions, respectively. Molecular substitutions that increase the number of blue cubes will definitely lead to increased binding affinity of the molecules toward MAGL inhibition, while molecular substitutions that increase the number of red cubes will lead to decreased activity.
Figure 4.
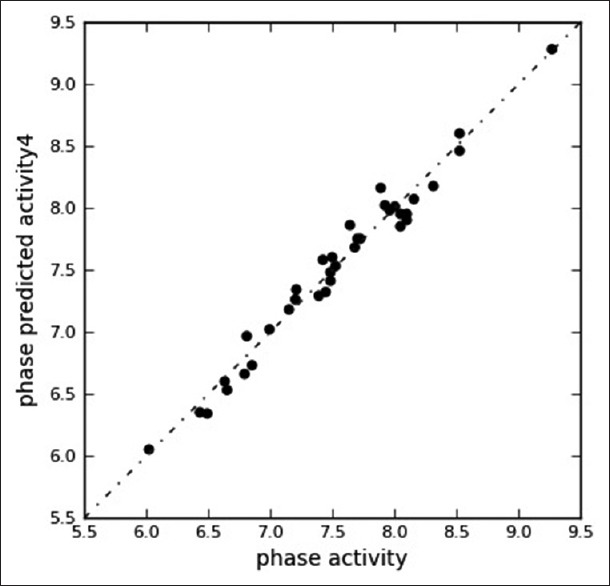
Fitness graph between observed activities versus PHASEpredicted activity for training and test set compounds
Table 4.
Fitness and PHASE-predicted activity data for all compounds
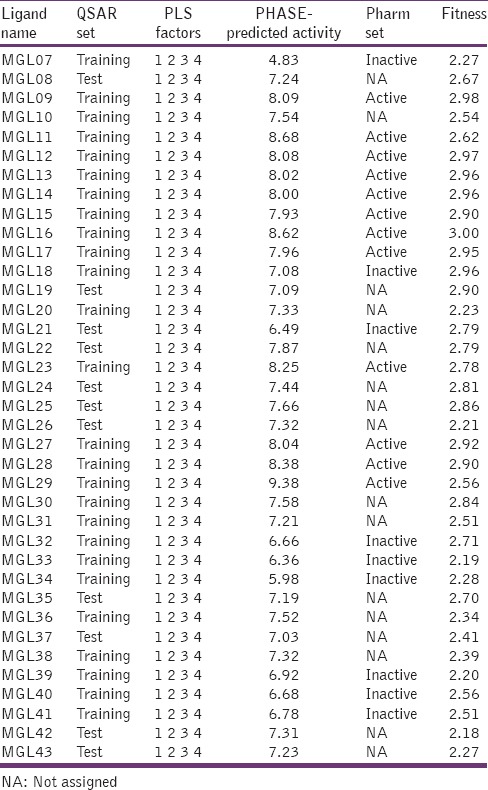
Figure 5.
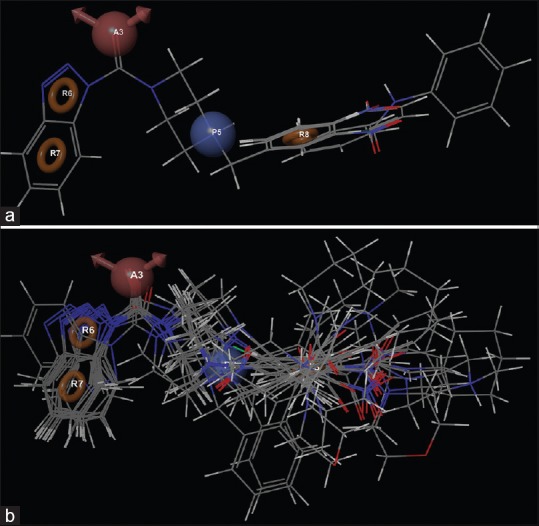
Alignment of (a) active and (b) inactive ligands to the pharmacophore
Figure 3a represents the H-bond acceptor characteristic of the pharmacophore hypothesis in the form of carbonyl group. It is also reported previously that a carbonyl group is essential for the inhibition of MAGL enzyme. This carbonyl function forms H-bond with the amino acids like Ala51, Met123, and Ser122 in the oxyanion hole of the enzyme.[28] Figure 3b shows the favored region for positive center in the pharmacophore hypothesis. From the experimental IC50 values as reported in literature,[19] the presence of piperazine ring instead of piperidine yields more potent inhibitor because piperazine ring gives a positive center at the physiological pH. Figure 3c shows the hydrophobic/nonpolar favorable regions to design more potent MAGL inhibitors. It is clear that the position of hydrophobic domain in the distal region of the molecule mainly governs the potency of the molecule. Increasing the hydrophobic character around ring C, mainly in the form of naphthalene or diphenyl substitution, increases the activity, while further substitution of the ring on ring C at ortho, meta, or para position or substitution of polar groups on ring C decreases the potency. Thus, it can be assumed that this study showed the selectivity toward MAGL and will help in designing more selective and variable MAGL inhibitor scaffolds.
Summary and Conclusion
A successful 3D-QSAR study was derived for the series of benztriazol-1-yl carboxamide derivatives as MAGL inhibitors to identify how three-dimensional arrangements of various substituents will affect MAGL inhibition. The selected model is very much significant to draw unambiguous inferences. The statistical parameter values are well above the acceptance limits. So, it is easy to draw clear inference to design novel compounds for better MAGL inhibition. The 3D-QSAR model discussed explains how and to what extent H-bond acceptor, positive centers, and hydrophobic properties should be modified. The model shows that MAGL inhibition can be increased if the hydrophobic character near the ring C and in the center is placed in an appropriate manner. The present finding suggests that H-bond acceptor and positive centers are mostly favorable in the structures. Thus, it is clear from this study that it is possible to develop novel and potent MAGL inhibitors if suitable substituents are placed in a proper manner.
Acknowledgments
The authors are thankful to the team of Schrodinger for providing software facility. One of the authors (Obaid Afzal) is grateful to the Council of Scientific and Industrial Research (CSIR), New Delhi, India, for providing financial assistance.
Footnotes
Source of Support: Nil
Conflict of Interest: None declared.
References
- 1.Dinh TP, Carpenter D, Leslie FM, Freund TF, Katona I, Sensi SL, et al. Brain monoglyceride lipase participating in endocannabinoid inactivation. Proc Nat Acad Sci USA. 2002;99:10819–24. doi: 10.1073/pnas.152334899. [DOI] [PMC free article] [PubMed] [Google Scholar]
- 2.Dinh TP, Kathuria S, Piomelli D. RNA interference suggests a primary role for monoacylglycerol lipase in the degradation of the endocannabinoid 2-arachidonoylglycerol. Mol Pharmacol. 2004;66:1260–4. doi: 10.1124/mol.104.002071. [DOI] [PubMed] [Google Scholar]
- 3.Ahn K, McKinney MK, Cravatt BF. Enzymatic pathways that regulate endocannabinoid signaling in the nervous system. Chem Rev. 2008;108:1687–707. doi: 10.1021/cr0782067. [DOI] [PMC free article] [PubMed] [Google Scholar]
- 4.Long JZ, Cravatt BF. The metabolic serine hydrolases and their functions in mammalian physiology and disease. Chem Rev. 2011;111:6022–63. doi: 10.1021/cr200075y. [DOI] [PMC free article] [PubMed] [Google Scholar]
- 5.Di Marzo V, Bisogno T, DePetrocellis L. Endocannabinoids and related compounds: Walking back and forth between plant natural products and animal physiology. Chem Biol. 2007;14:741–56. doi: 10.1016/j.chembiol.2007.05.014. [DOI] [PubMed] [Google Scholar]
- 6.Kano M, Ohno-Shosaku T, Hashimotodani Y, Uchigashima M, Watanabe M. Endocannabinoid-mediated control of synaptic transmission. Physiol Rev. 2009;89:309–80. doi: 10.1152/physrev.00019.2008. [DOI] [PubMed] [Google Scholar]
- 7.Chanda PK, Gao Y, Mark L, Btesh J, Strassle BW, Lu P, et al. Monoacylglycerol lipase activity is a critical modulator of the tone and integrity of the endocannabinoid system. Mol Pharmacol. 2010;78:996–1003. doi: 10.1124/mol.110.068304. [DOI] [PubMed] [Google Scholar]
- 8.Long JZ, Li W, Booker L, Burston JJ, Kinsey SG, Schlosburg JE, et al. Selective blockade of 2-arachidonoylglycerol hydrolysis produces cannabinoid behavioral effects. Nat Chem Biol. 2009;5:37–44. doi: 10.1038/nchembio.129. [DOI] [PMC free article] [PubMed] [Google Scholar]
- 9.Schlosburg JE, Blankman JL, Long JZ, Nomura DK, Pan B, Kinsey SG, et al. Chronic monoacylglycerol lipase blockade causes functional antagonism of the endocannabinoid system. Nat Neurosci. 2010;13:1113–9. doi: 10.1038/nn.2616. [DOI] [PMC free article] [PubMed] [Google Scholar]
- 10.Blankman JL, Simon GM, Cravatt BF. A comprehensive profile of brain enzymes that hydrolyze the endocannabinoid 2-arachidonoylglycerol. Chem Biol. 2007;14:1347–56. doi: 10.1016/j.chembiol.2007.11.006. [DOI] [PMC free article] [PubMed] [Google Scholar]
- 11.Savinainen JR, Yoshino M, Minkkila A, Nevalainen T, Laitinen JT. Characterization of binding properties of monoglyceride lipase inhibitors by a versatile fluorescence-based technique. Anal Biochem. 2010;399:132–4. doi: 10.1016/j.ab.2009.12.009. [DOI] [PubMed] [Google Scholar]
- 12.Nomura DK, Long JZ, Niessen S, Hoover HS, Ng SW, Cravatt BF. Monoacylglycerol lipase regulates a fatty acid network that promotes cancer pathogenesis. Cell. 2010;140:49–61. doi: 10.1016/j.cell.2009.11.027. [DOI] [PMC free article] [PubMed] [Google Scholar]
- 13.Mulvihill MM, Nomura DK. Therapeutic potential of monoacylglycerol lipase inhibitors. Life Sci. 2013;92:492–7. doi: 10.1016/j.lfs.2012.10.025. [DOI] [PMC free article] [PubMed] [Google Scholar]
- 14.Nomura DK, Morrison BE, Blankman JL, Long J, Kinsey SG, Marcondes MC, et al. Endocannabinoid hydrolysis generates brain prostaglandins that promote neuroinflammation. Science. 2011;334:809–13. doi: 10.1126/science.1209200. [DOI] [PMC free article] [PubMed] [Google Scholar]
- 15.Chen R, Zhang J, Wu Y, Wang D, Feng G, Tang YP, et al. Monoacylglycerol lipase is a therapeutic target for Alzheimer's disease. Cell Rep. 2012;2:1329–39. doi: 10.1016/j.celrep.2012.09.030. [DOI] [PMC free article] [PubMed] [Google Scholar]
- 16.Piro JR, Benjamin DI, Duerr JM, Pi Y, Gonzales C, Wood KM, et al. A dysregulated endocannabinoid-eicosanoid network supports pathogenesis in a mouse model of Alzheimer's disease. Cell Rep. 2012;1:617–23. doi: 10.1016/j.celrep.2012.05.001. [DOI] [PMC free article] [PubMed] [Google Scholar]
- 17.Kinsey SG, Long JZ, Cravatt BF, Lichtman AH. Fatty acid amide hydrolase and monoacylglycerol lipase inhibitors produce anti-allodynic effects in micethrough distinct cannabinoid receptor mechanisms. J Pain. 2010;11:1420–8. doi: 10.1016/j.jpain.2010.04.001. [DOI] [PMC free article] [PubMed] [Google Scholar]
- 18.Kinsey SG, Long JZ, O’Neal ST, Abdullah RA, Poklis JL, Boger D, et al. Blockade of endocannabinoid-degrading enzymes attenuates neuropathic pain. J Pharmacol Exp Ther. 2009;330:902–10. doi: 10.1124/jpet.109.155465. [DOI] [PMC free article] [PubMed] [Google Scholar]
- 19.Morera L, Labar G, Ortar G, Lambert DM. Development and characterization of endocannabinoid hydrolases FAAH and MAGL inhibitors bearing a benzotriazol-1-yl carboxamide scaffold. Bioorg Med Chem. 2012;20:6260–75. doi: 10.1016/j.bmc.2012.09.011. [DOI] [PubMed] [Google Scholar]
- 20.Samantha L, Cesare M, Aleksey K, Mattia S, Stefano M, Elena C, et al. SAR and QSAR study on 2-aminothiazole derivatives, modulators of transcriptional repression in Huntington's disease. Bioorg Med Chem. 2008;16:5695–703. doi: 10.1016/j.bmc.2008.03.067. [DOI] [PubMed] [Google Scholar]
- 21.Almerico AM, Tutone M, Lauria A. 3D-QSAR pharmacophore modeling and in silico screening of new Bcl-xl inhibitors. Eur J Med Chem. 2010;45:4774–82. doi: 10.1016/j.ejmech.2010.07.042. [DOI] [PubMed] [Google Scholar]
- 22.Narkhede SS, Degani MS. Pharmacophore refinement and 3DQSAR studies of histamine H3 antagonists. QSAR Comb Sci. 2007;26:744–53. [Google Scholar]
- 23.Lather V, Kristam R, Saini JS, Karthikeyan NA, Balaji VN. QSAR models for prediction of glycogen synthase kinase-3b inhibitory activity of indirubin derivatives. QSAR Comb Sci. 2008;27:718–28. [Google Scholar]
- 24.Mahipal, Tanwar OP, Karthikeyan C, Moorthy NS, Trivedi P. 3D-QSAR of aminophenyl benzamide derivatives as histone deacetylase inhibitors. Med Chem Res. 2010;6:277–85. doi: 10.2174/157340610793358846. [DOI] [PubMed] [Google Scholar]
- 25.New York, NY: 2013. Phase, version 3.5, Schrödinger, LLC. [Google Scholar]
- 26.Dixon SL, Smondyrev AM, Knoll EH, Rao SN, Shaw DE, Friesner RA. PHASE: A new engine for pharmacophore perception, 3D QSAR model development, and 3D database screening: 1. Methodology and preliminary results. J Comput Aided Mol Des. 2006;20:647–71. doi: 10.1007/s10822-006-9087-6. [DOI] [PubMed] [Google Scholar]
- 27.Shah UA, Deokar HS, Kadam SS, Kulkarni VM. Pharmacophore generation and atom-based 3D-QSAR of novel 2-(4-methylsulfonylphenyl) pyrimidines as COX-2inhibitors. Mol Divers. 2010;14:559–68. doi: 10.1007/s11030-009-9183-3. [DOI] [PubMed] [Google Scholar]
- 28.Schalk-Hihi C, Schubert C, Alexander R, Bayoumy S, Clemente JC, Deckman I, et al. Crystal structure of a soluble form of human monoglyceride lipase in complex with an inhibitor at 1.35 Å resolution. Protein Sci. 2011;20:670–83. doi: 10.1002/pro.596. [DOI] [PMC free article] [PubMed] [Google Scholar]


