

Abstract
Objective
To explore the relative efficiency of dialysis facilities in the United States and identify factors that are associated with efficiency in the production of dialysis treatments.
Data Sources/Study Setting
Medicare cost report data from 4,343 free-standing dialysis facilities in the United States that offered in-center hemodialysis in 2010.
Study Design
A cross-sectional, facility-level retrospective database analysis, utilizing data envelopment analysis (DEA) to estimate facility efficiency.
Data Collection/Extraction Methods
Treatment data and cost and labor inputs of dialysis treatments were obtained from 2010 Medicare Renal Cost Reports. Demographic data were obtained from the 2010 U.S. Census.
Principal Findings
Only 26.6 percent of facilities were technically efficient. Neither the intensity of market competition nor the profit status of the facility had a significant effect on efficiency. Facilities that were members of large chains were less likely to be efficient. Cost and labor savings due to changes in drug protocols had little effect on overall dialysis center efficiency.
Conclusions
The majority of free-standing dialysis facilities in the United States were functioning in a technically inefficient manner. As payment systems increasingly employ capitation and bundling provisions, these institutions will need to evaluate their efficiency to remain competitive.
Keywords: Dialysis market, efficiency, data envelopment analysis
More than ever, health care providers in the United States are facing the challenge of meeting a growing demand for health care services in an environment of increasing pressures on funding. Not only are hospitals, doctors, and other health care providers being asked to do more with less, but they are also being held to higher standards of quality of care as conditions of payment. The Centers for Medicare and Medicaid Services is at the forefront of this movement to tie health care outcomes to reimbursement; “pay for performance” is the new mantra for the emerging payment models now being rolled out for the Medicare program.
Pay for performance was extended to Medicare's end-stage renal disease (ESRD) program via a Prospective Payment System and Quality Incentive Program (QIP) for dialysis providers, implemented in January 2011 (Centers for Medicare and Medicaid Services 2010a; Swaminathan et al. 2012). Costs of the Medicare ESRD program have sky-rocketed from just $229 million in 1973 to nearly $33 billion by 2010 (Swaminathan et al. 2012; United States Renal Data System 2012). This rapid spending growth led to a series of payment reforms, and Medicare payments per dialysis treatment dropped dramatically in real dollar terms, falling to just 27 percent of the initial 1974 payment by 2005, after adjusting for inflation (DeOreo 2007). Facilities that provide dialysis services have had to continually adjust to decreasing payments despite rising costs of treatment. Declining payments have encouraged dialysis providers to improve efficiency, but the challenge today is to produce an ever higher quality of care while minimizing costs.
Health care efficiency is measured by comparing the costs and quantity of resource inputs (labor, capital, and equipment) with outputs (e.g., number of treatments, quality-adjusted life years) (Palmer and Torgerson 1999). Technical efficiency considers whether any waste can be eliminated without worsening any input or output (Cooper, Seiford, and Zhu 2004). This definition is applied on a relative basis, so that a facility is considered technically efficient if the performances of other facilities do not show that some of its inputs or outputs can be improved without worsening some of its other inputs or outputs. Productive efficiency considers the maximum absolute output that can be produced from a fixed set of inputs without consideration for whether the output produced maximizes social benefit. Allocative efficiency is concerned with the production of only those types and quantity of outputs that are optimal to society as a whole and is achieved at the point where marginal benefit is equal to marginal cost.
Efficiency in dialysis is best viewed from the perspective of technical efficiency, as dialysis providers are confronted with a relatively fixed patient base for which they produce a fixed number of outputs. Therefore, the challenge is to produce these outputs with minimal input costs. One area in which dialysis center clinicians are seeking opportunities for cost savings without compromising quality is through the implementation of alternative anemia drug therapies. The management of anemia is an important component in the routine care provided to most patients in a dialysis clinic, and the management and administration of anemia drugs is labor intensive (Schiller et al. 2008). Recent studies suggest that switching patients to less frequent dosing of erythropoiesis-stimulating agents (ESAs) could result in labor and cost savings (Saueressig et al. 2008; Schiller et al. 2008). However, because 90 percent of dialysis patients visit their facility three times per week (United States Renal Data System 2012) and the intravenous administration of ESAs is integrated into the delivery of the dialysis dose, the savings achieved through less frequent ESA dosing may be too small to translate into greater facility efficiency.
Understanding efficiency is one way to evaluate the performance of dialysis facilities. Medicare has announced plans to include efficiency measures in the ESRD QIP in the near future, while acknowledging that they are not aware of any appropriate efficiency measures for the ESRD population (Centers for Medicare and Medicaid Services 2012). Indeed, analysis of the efficiency of dialysis providers in the United States, and knowledge of factors impacting efficiency, has been limited to only a few studies. The most notable is the work of Ozgen and Ozcan, who studied the relative technical efficiency of dialysis facilities using Data Envelopment Analysis (DEA) (Ozgen and Ozcan 2002). They studied 1997 cost data for 791 free-standing dialysis centers and found that the majority of the facilities were not operating efficiently. No more recent studies of U.S. dialysis facility efficiency are currently available.
Given the dramatic changes in the U.S. dialysis industry since the 1990s, an analysis of more recent data is needed to reassess the state of efficiency in the industry. As such, this study builds on the dialysis efficiency studies of Ozgen and Ozcan (2002) and re-estimated the relative efficiency of U.S. free-standing dialysis centers, based on the most recent data available. A second objective of this study was to assess whether reduced labor and supply costs resulting from a change to less frequent ESA dosing would affect efficiency.
Methods
Data Sources
This was a retrospective, cross-sectional study of the relative efficiency of U.S. free-standing dialysis facilities for the year 2010. The study dataset was developed from the 2010 Medicare Renal Cost Reports (Centers for Medicare and Medicaid Services 2010b), the 2010 US Census public use files (US Census Bureau 2012), and Medicare's Dialysis Facility Compare database (Centers for Medicare and Medicaid Services 2011).
Study Population and Final Study Cohort
The 2010 Renal Cost Reports database included 4,957 ESRD providers. Five facilities in Guam, The Marianas Islands, and the U.S. Virgin Islands were excluded, and 82 providers that provided no in-center hemodialysis treatments were also excluded. Thus, the initial study population was trimmed to 4,870 free-standing hemodialysis centers in the 50 U.S. states, Puerto Rico, and the District of Columbia that performed at least one maintenance or training hemodialysis session in 2010, as reported in their Medicare cost report. To promote comparability of the types of operations conducted by facilities in the sample, facilities were excluded if they were hospital-based dialysis centers, or if they provided only home therapy, or only peritoneal dialysis. Facilities that reported use of a different anemia management drug than the most common drug typically dosed three times per week were also excluded. Facilities reporting no treatments in any modality, no supply costs, no fixed costs, and/or no full-time employee (FTE) nursing staff, or facilities that had outlier data for costs or number of treatments per patient, were excluded from the study. A total of 527 facilities (10.8 percent) were excluded, resulting in a final study cohort of 4,343 facilities. Table1 summarizes the exclusions for missing data and outliers.
Table 1.
Study Cohort of Free-Standing Dialysis Facilities
| Population of Free-Standing Hemodialysis Facilities in United States and Puerto Rico with 2010 Cost Reports† | 4,870 |
|---|---|
| Missing data | |
| No treatments reported in any modality | −9 |
| No supply costs reported | −6 |
| No epoetincosts (used Aranesp exclusively) | −24 |
| No nurse FTEs (RNs or LPNs) reported | −333 |
| Total eligible facilities with reported treatments, nurse FTEs, supply, and epoetin costs | 4,498 |
| Outliers | |
| No fixed costs reported | −1 |
| Variable (nonstaff) costs of >$400 per treatment | −8 |
| A&G costs of <$5 per treatment or >$200 per treatment | −19 |
| Total cost per treatment <$100 or >$1,000 | −29 |
| Outlier on treatments per patient‡ | −98 |
| Total facilities excluded for outlier values (3.5% of eligible facilities) | −155 |
| Final cohort | 4,343 |
| Total facilities excluded from the starting population (10.8%) | 527 |
Five facilities in Guam, the Marianas Islands, and the U.S. Virgin Islands were excluded. Eighty-two providers that provided no in-center hemodialysis treatments were also excluded.
Definition of treatment per patient outliers: >365 peritoneal or home dialysis sessions per patient, or <30 or >200 maintenance hemodialysis sessions per patient.
A&G, administrative and general; FTEs, full-time equivalents; LPNs, licensed practical nurses; RNs, registered nurses.
Data Envelopment Analysis
The key outcome measure in this study was the technical efficiency score of each dialysis facility. A facility is said to be technically efficient if it is producing the maximum output from the minimum quantity of inputs, such as labor, capital, and technology. The efficiency score was obtained using DEA, which is a nonparametric statistical technique that uses data on the actual performance of comparable units—in this case dialysis facilities—to search for optimal combinations of inputs and outputs that define an efficiency “frontier.” The technique then assigns a relative efficiency score between 0 and 1 to each facility, which indicates the distance of the facility from the efficiency frontier (score of 1.0). Efficiency scores are proportional; that is, a score of .50 is twice the distance from the efficiency frontier than a score of .75. The maximum output that a facility should generate from a set of inputs is estimated from the best performers in the group. This defines the appropriate benchmark for evaluating the relative efficiency of facilities (Bryce, Engberg, and Wholey 2000). Facilities that are on the efficiency frontier are considered efficient relative to the population of facilities being analyzed.
For this study, a single output measure was constructed, based on standardizing all dialysis sessions of varying length and type to 4-hour hemodialysis session equivalents. Most in-center dialysis is maintenance hemodialysis, typically provided as a thrice-weekly dose of 4-hour duration. However, dialysis centers report numerous types of dialysis treatments (e.g., training sessions, peritoneal dialysis sessions, or home therapy weeks). To standardize all outputs to a common measure, each in-center dialysis session was converted to 4-hour equivalents, and each home dialysis week was converted to three 4-hour hemodialysis session equivalents.
Cost inputs included in the DEA model were capital-related net expenses for buildings, fixtures, and movable equipment; capital-related net expenses for dialysis machine-related cost; net expenses for operation and maintenance of plant and equipment; drug costs; supply costs; and administrative and other general costs. Labor inputs included the number of physician, nurse, technician, and other clinical staff FTEs that were working in the dialysis facility in 2010. Non-clinical (e.g., administrative and maintenance) labor inputs were captured in the administrative and other general cost input. To assess the robustness of the DEA model, sensitivity analyses were conducted by examining several different sets of cost inputs. Models were run with and without ESA drug costs and with and without capital costs (both of which were excluded in the Ozgen and Ozcan model) (Ozgen and Ozcan 2002).
The study used a variable-returns-to-scale (VRS) DEA model in examining the technical efficiency of dialysis facilities. A VRS model assumes that outputs may increase or decrease in response to changes in the input(s); in other words, the average productivity at the most productive facility size may not be attainable for larger or smaller facilities. Another key design criterion in the implementation of the DEA methodology is whether the model is input or output oriented. As dialysis facilities are assumed to have more control over the inputs used to produce dialysis outputs than opportunity to change the number of outputs, an input-oriented model was used. The use of an input-oriented VRS model to compute efficiency scores is described in detail in Ozgen and Ozcan (2002). DEA scores were calculated using the xIDEA add-in for Microsoft Excel (www.prodtools.com).
Regression Analysis
The DEA method assumes that facilities operate under identical organizational and environmental conditions (Sexton et al. 1989). However, differences in these conditions can lead to variation in efficiency scores across facilities. To account for such effects, a second-stage statistical analysis was conducted in which the efficiency scores derived from the DEA were used in assigning each dialysis facility to an efficiency category, and then observations on category membership were used as the dependent variable in a multinomial ordered logit regression on determinants of efficiency to analyze the probability of being in various efficiency states. The individual dialysis facility was the unit of analysis. For the dependent variable, the efficiency scores of dialysis centers were categorized into four qualitative groupings of relative efficiency, from most inefficient to efficient, as follows: (<.7) most inefficient, (.7 to <.9) moderately inefficient, (.9 to <1.0) least inefficient, and (1.0) efficient. These cutoffs were selected after sensitivity analysis, which demonstrated the robustness of the model in describing the predictors of efficiency through a range of dependent variable definitions. The multinomial ordered logit methodology uses the hypothesized determinants of efficiency to estimate an index that determines the most likely efficiency category to which an individual facility belongs. The index measures how changing levels of determinants affect the category of efficiency to which a dialysis facility belongs.
The multinomial logit model included the general sociodemographic population characteristics of race, age, education, ethnicity, income, geographic region, and location to control for differences in the market characteristics of external demand and supply across dialysis providers, as well as facility organizational and market share characteristics (organization size, for-profit status, market concentration, and percent for profit in local market area). Regressions were run using STATA IC 12 statistical software (StataCorp LP College Station, TX, USA).
Scenario Analysis: Effect on Efficiency of Reduced Nursing and Supply Costs
In light of the current dialysis industry focus on the costs and outcomes of evolving trends in ESA dosing (Besarab, Frinak, and Yee 2009; Charytan 2010; Singh 2010; Teehan and Benz 2011; Coyne 2012; Freburger et al. 2012; Hackbarth 2012; Pisoni et al. 2012), and the opportunities for labor and supply costs savings of switching to less frequent ESA dosing as outlined by Schiller et al. (2008) and Saueressig et al. (2008), additional DEA models were run to simulate the reduced nursing FTE and supply costs that could be theoretically achieved by switching to less frequent ESA dosing. The results of these models were then contrasted with the results of the baseline DEA model to assess any efficiency gains that might be achieved due to a switch in ESAs. Simulated reductions in labor and cost inputs were based on a time and motion study by Schiller et al. (2008), who estimated that switching to once-monthly ESAs would save 3.23 minutes of staff time and $1.035 in supply costs per treatment, relative to thrice-weekly ESA dosing. The baseline DEA inputs for nursing labor and supply costs were reduced by these estimates for each unit of output in our model. Price parity was assumed between the ESA drugs.
Results
A total of 4,343 dialysis facilities were included in the study cohort. Means, medians, and standard deviations (SDs) are shown in Table2 for each input/output variable used in the baseline DEA model, and for each facility characteristic and control variable used in the multinomial logit model. The U.S. dialysis market in 2010 was dominated by the two largest chains, which owned 78 percent of all free-standing dialysis facilities. Nearly 93 percent of all free-standing facilities were for-profit, and over 75 percent were located in urban areas. Nearly half of all facilities were located in the South census region. There was substantial variation in the size of facilities indicated by the large SDs of the input and output variables. The mean and SD of the number of annual treatments (4-hour hemodialysis session equivalents) was 9,893 and 7,078, respectively. The mean (SD) number of nurse FTEs employed was 4.2 (3.6). ESA drug costs were the second largest input cost after administrative and general.
Table 2.
Characteristics of Free-Standing Dialysis Facilities in 2010
| Variable | Number (n = 4,343) | Mean (%) | Median | SD |
|---|---|---|---|---|
| Outputs | ||||
| Annual 4-hour hemodialysis equivalent sessions | 11,444 | 9,893 | 7,078 | |
| Inputs | ||||
| Labor inputs | ||||
| Physician FTEs | 0.05 | 0.00 | 0.47 | |
| Nursing FTEs | 4.24 | 3.00 | 3.59 | |
| Technician FTEs | 6.01 | 5.00 | 4.68 | |
| Other clinical FTEs | 0.70 | 0.00 | 1.81 | |
| Capital and operating expenses | ||||
| Capital costs (buildings and fixtures) | $ 210,148 | $ 188,883 | $ 137,816 | |
| Dialysis machine costs | $ 99,790 | $ 90,817 | $ 58,292 | |
| Operations and maintenance | $ 89,218 | $ 76,908 | $ 60,865 | |
| Non-ESA drug costs | $ 207,779 | $ 178,630 | $ 143,996 | |
| ESA drug costs | $ 486,166 | $ 429,927 | $ 314,696 | |
| Supply costs | $ 270,519 | $ 202,287 | $ 230,627 | |
| Administrative and general | $ 561,915 | $ 505,499 | $ 296,749 | |
| Other costs | $ 48,770 | $ 33,124 | $ 72,680 | |
| Market competition | ||||
| Hirschman–Herfindahl index† | 4,343 | 0.53 | 0.44 | 0.28 |
| % For profits in market‡ | 4,343 | 89.2% | 95.4% | 18.5% |
| Facility characteristics | ||||
| Not affiliated-independent | 331 | (7.6) | ||
| Affiliated with small chain§ | 247 | (5.7) | ||
| Affiliated with medium-sized chain¶ | 378 | (8.7) | ||
| Affiliated with large chain‖ | 3,387 | (78.0) | ||
| For-profit | 4,030 | (92.8) | ||
| Non-profit | 313 | (7.2) | ||
| Control factors | ||||
| % Minority (County) | 4,343 | 39.1% | 37.6% | 22.3% |
| % Hispanic (County) | 4,343 | 16.1% | 8.4% | 18.2% |
| % African American (County) | 4,343 | 17.5% | 12.3% | 15.8% |
| % Below poverty line (County) | 4,343 | 11.5% | 11.1% | 5.5% |
| Median income (County) | 4,343 | $50,682 | $48,234 | $13,440 |
| %≥Age 65 (County) | 4,343 | 13.2% | 12.7% | 3.4% |
| % Education <9 years (County) | 4,343 | 6.6% | 5.4% | 4.0% |
| Northeast region | 555 | (12.8) | ||
| Midwest region | 936 | (21.6) | ||
| South region | 2,059 | (47.4) | ||
| West region | 793 | (18.3) | ||
| Rural | 422 | (9.7) | ||
| Suburban | 643 | (14.8) | ||
| Urban | 3,278 | (75.5) | ||
The Hirschman–Herfindahl index (HHI) is a measure of market concentration, constructed by summing the squared market shares of all dialysis firms in a given metropolitan/micropolitan statistical area (MSA), or county for non-MSA facilities (Whinston 2006). The market share for each firm was measured as the proportion of total dialysis treatments produced by the facilities owned by a firm to the total number of dialysis treatments furnished by all facilities, including hospital-based facilities, in a given market.
For each local dialysis market, defined by the MSA or county where the dialysis center is located, the percentage of for-profit dialysis facilities was calculated, including hospital-based facilities.
Chain of 49 or fewer units.
50+ units, but not one of the two largest chains.
Affiliated with one of the two largest chains—DaVita or Fresenius.
FTEs, full-time equivalents; SD, standard deviation.
Data Envelopment Analysis
Figure1 shows the distribution of raw efficiency scores from the baseline DEA model. About one-quarter (26.6 percent) of facilities were “efficient” (scores = 1.0). The mean (SD) score was .78 (.17) with a median score of .77. The scores for the inefficient facilities were approximately normally distributed around the .65 to .70 category. Very few facilities (.5 percent) scored below .40. The mean and median efficiency score for inefficient facilities was .70, which means that inefficient facilities should have been able to produce outputs using 30 percent less inputs.
Figure 1.
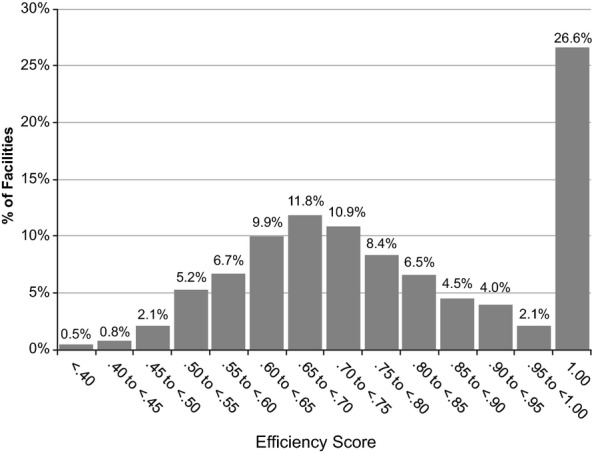
Distribution (Frequency Percentages) on Raw Efficiency Scores of Baseline Data Envelopment Analysis Model
Multinomial Logit Analysis
Table3 presents the results of the multinomial logit model and goodness-of-fit measures. The model was specified, so that the default baseline facility was a for-profit, large dialysis organization-affiliated, urban dialysis clinic in the South, and results relate to deviations from that baseline. All of the variables indicating region, dialysis organization size, and urban location exhibit statistical significance at the .01 level. Relative to a baseline facility, a facility located in the Northeast was 44 percent less likely to be efficient, and a facility in the West region was 80 percent less likely to be efficient. However, the odds of being more efficient increased for a facility located in the Midwest region by 25 percent compared with a facility in the South. Being affiliated with smaller dialysis organizations and/or being located in rural and suburban areas had a strong positive effect on efficiency. For example, relative to a baseline facility, an independently owned facility was 3.7 times more likely to be efficient, and a rural facility was 2.8 times more likely to be efficient. Most of the environmental variables were not significant. The only exception was the percent of African American population of the county where the dialysis facility is located, which had a strong negative association with efficiency (p < .01).
Table 3.
Regression Model Results
| Variable | Coefficient (c) | Standard Error | e(c) |
|---|---|---|---|
| Northeast region | −0.814* | 0.104 | 0.443 |
| Midwest region | 0.222* | 0.079 | 1.249 |
| West region | −0.227* | 0.088 | 0.797 |
| Independent (unaffiliated) | 1.305* | 0.117 | 3.688 |
| Small dialysis organization | 0.858* | 0.131 | 2.358 |
| Medium dialysis organization | 0.433* | 0.129 | 1.542 |
| Rural | 1.035* | 0.118 | 2.815 |
| Suburban | 0.320* | 0.096 | 1.377 |
| Nonprofit | 0.386 | 0.369 | 1.471 |
| Percentage for-profit in market | 0.330 | 0.316 | 1.391 |
| Nonprofit × percentage for-profit | 0.057 | 0.465 | 1.059 |
| Hirschman–Herfindahl index | −0.010 | 0.143 | 0.990 |
| % African American in County | −1.123* | 0.212 | 0.325 |
| % Education <9 years, County | −0.002 | 0.008 | 0.998 |
| % ≥65 years old, County | −0.008 | 0.009 | 0.992 |
| Data envelopment analysis (DEA) category 1 (.0 to .7) upper bound | −0.357 | 0.321 | 0.700 |
| DEA category 2 (.7 to .9) upper bound | 1.007* | 0.321 | 2.737 |
| DEA category 3 (.9 to <1) upper bound | 1.326* | 0.321 | 3.766 |
| Observations | 4,343 | ||
| Goodness-of-Fit Measures | |||
| Log-Lik intercept only | −5,436.176 | Log-Lik full model | −5,198.809 |
| LR (15) | 474.735 | Prob> LR | 0.000 |
| McFadden's R2 | 0.044 | ML (Cox–Snell) R2 | 0.104 |
| McKelvey and Zavoina's R2 | 0.110 | Cragg–Uhler (Nagelkerke) R2 | 0.113 |
| AIC | 2.402 | Count R2 | 0.431 |
p < .01.
AIC, Akaike Information Criterion; LR, likelihood ratio; ML, maximum likelihood; Prob, probability.
Although a relatively large number of significant explanatory factors were found, the relatively low pseudo-R2 measures suggest that there remains a notable amount of heterogeneity in the efficiency measure that was not explained by the included explanatory factors. The Count R2 indicates that the specific efficiency category membership of over 43 percent of the facilities was precisely predicted. Overall, the data that were available allowed for the discovery of a number of important factors affecting efficiency of facilities, and a significant increase in explanatory power relative to a base intercept model.
Scenario Analysis
Figure2 shows the distribution of raw efficiency scores from the scenario where all facilities have reduced costs due to less frequent ESA dosing, with the distribution of scores from the baseline model. The average percentage reduction in nursing FTEs in the scenario was 6 percent and the average reduction in supply costs was 4 percent. The distributions from the two models are almost identical, indicating that if a change to less frequent ESA dosing were implemented across all free-standing dialysis facilities, the overall relative efficiency of these facilities would not change notably. The percentage of facilities at or near the efficiency frontier (efficiency score of .90 or above) was between 32 and 33 percent in both models. Between 15 and 16 percent have scores of less than .60. The correlation of efficiency scores between the baseline model and the scenario was very high, with an r2 of .995. The mean (SD) scores in the scenario were .78 (.17), which are nearly identical to the baseline model.
Figure 2.
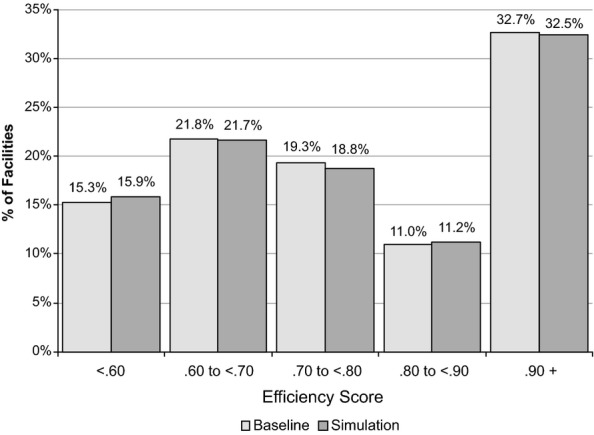
Distribution (Frequency Percentages) on Raw Efficiency Scores of the Baseline Data Envelopment Analysis Model and Simulation
A second scenario tested whether the advantage of reduced input costs would move the inefficient units to the efficiency frontier, and/or if the relatively efficient units from the baseline model would no longer be the most efficient. The scenario retained all the efficient units from the baseline model but assumed that all the inefficient facilities adopted the new lower costing therapy, so that the nursing FTEs and supply costs used for the efficient units were the same as the baseline model and the rest of the facilities used the reduced nursing FTE and supply costs. In this scenario, 60 previously inefficient facilities became efficient after switching to the new therapy, while all of the previously efficient units using the traditional therapy remained efficient. The percentage of facilities at the efficiency frontier changed marginally from 26.6 to 28.0 percent.
Sensitivity Analysis
For the DEA model, there were four different models estimated using different combinations of cost inputs. The baseline model used all fixed and variable cost inputs that were available from the study dataset. The second model excluded fixed capital costs, consistent with the approach used in Ozgen and Ozcan (2002). The third model excluded both fixed capital and dialysis machine costs, and included only variable costs. The fourth model included all fixed costs but excluded ESA drug costs, which were also excluded by Ozgen and Ozcan (2002). Differences in individual facility efficiency scores using these alternative sets of cost inputs were slight. For example, the r2 between the raw efficiency scores from the baseline model and the model without ESA drug costs was .963, and the r2 between the baseline model and the model excluding capital costs was .962. The inclusion or exclusion of even fairly large cost input categories like capital costs and ESA drug costs had very little effect on the distribution of efficiency scores.
Once the final DEA model was specified, 12 multinomial logit models were tested for goodness of fit, using three different specifications of the dependent variable, and four different sets of independent variables. For the dependent variable, the DEA efficiency scores were partitioned into (a) 10 levels of equal bandwidth (i.e., .0 to .1, .1 to .2,…, .9 to 1.0), and (b) into 2 four-category partitions: (.0 to .7, .7 to .9, .9 to <1.0, and 1.0) and (.0 to .5, .5 to .7, .7 to .9, and .9 to 1.0). For the independent variables, a number of transformations of the demographic variables were examined. For all the nonindicator-type variables, squared terms and log terms were defined. Differences between all the tested models were slight, but the Akaike Information Criterion for the final model presented in Table3 was relatively low in comparison to the other model specifications examined. In general, the indicator variables describing characteristics of facility ownership type, geographic region, and urbanicity in all the models were largely significant, while the environmental variables mostly were not.
Discussion
This study provides insights into relative efficiency in the provision of dialysis services and about the potential factors that affect efficiency, for free-standing dialysis centers in the United States. Although about one-quarter (26.6 percent) of these facilities may be considered efficient (score = 1.0), most facilities (73.4 percent) were relatively inefficient. These findings are largely consistent with the results of Ozgen and Ozcan (21.1 percent efficient) that applied the DEA technique to analyze efficiency in dialysis centers more than a decade ago (Ozgen and Ozcan 2002). In both studies, the percentage of facilities on the efficiency frontier was low compared with that found in other DEA studies of health care providers. For example, a study of U.S. urban hospitals found that 45 percent of hospitals were efficient (Ozcan and Luke 1993). Another study used DEA to analyze the efficiency of acute care nursing units in U.S. hospitals and found 40.4 percent were on the efficiency frontier (Mark et al. 2009). Efficiency of nursing homes was analyzed using DEA and an average DEA score of .869 was reported (DeLellis and Ozcan 2013), compared with a mean of .783 found for dialysis units in this study. This comparative analysis suggests that there is a greater opportunity for improvement in the technical efficiency of dialysis facilities than in other health care institutions.
This study found that organization size/chain affiliation had a significant (negative) association with efficiency; that is, the larger the organization, the less likely that the units in the organization will be efficient. This was also a finding in the dialysis study by Ozgen and Ozcan (2002). In contrast, size and chain affiliation was positively related to efficiency in a study of urban hospitals (Ozcan and Luke 1993). Ozcan and Luke also reported that having a higher percentage of patients with Medicare was strongly related to lower efficiency. As dialysis facilities treat predominantly Medicare patients, this factor may help explain why the dialysis industry appears less efficient than the urban hospitals. In a near single-payer system, dialysis facilities do not compete on price, which may result in little incentive to operate more efficiently.
Other major factors found to be significantly associated with the efficiency of dialysis centers were geographic region of the country and whether facilities were in urban or rural locations. Note that, while organization size may be somewhat within the power of facility owners to change, geographic location and urban versus rural location are factors that, for the most part, cannot be changed because of the localized nature of dialysis treatment. Environmental factors such as local market competition or the percentage of facilities in a local market that were for-profit were not found to be significant indicators of relative efficiency. Being nonprofit was positively associated with efficiency, but it was not significant. This is consistent with studies by both Ozcan and Luke (urban hospitals) and DeLellis and Ozcan (nursing homes), which found that not-for-profits were more likely to be efficient than for-profits. In contrast, Ozgen and Ozcan (2002) found that nonprofit ownership in dialysis centers was significantly negatively associated with efficiency.
In the study reported herein, the effects of a change to a less frequent ESA dosing regimen on dialysis facility efficiency were analyzed by estimating the administration time and supply cost savings that would be associated with once-monthly compared with thrice-weekly dosing, and altering the inputs to the DEA model accordingly. The reduced costs of this change in anemia management did not alter the distribution of efficiency scores in any appreciable way. This is understandable as anemia management staff time was less than 3 percent of total staff time and anemia treatment-related supply costs were less than 1 percent of total nonlabor costs. To alter efficiency statistics appreciably, it would be necessary to affect somewhat larger categories of cost. Furthermore, it is unlikely that real FTE savings could be achieved, as most facilities do not employ sufficient nursing staff to reduce by even a half FTE as a result of the anemia management time savings that might be realized. There may be other inefficiencies in the dialysis center that should be addressed before considering a change in anemia management to become more cost-efficient. For example, the time spent on managing patient laboratory testing, which consumes a substantial amount of staff resources (Vizethann 2012), or implementing protocols to reduce access site infections may be areas where operational and technical improvements could result in substantial reductions in cost and improvements in efficiency.
Limitations
Although the findings of this study provide informative insights into the technical efficiency of U.S. dialysis centers, the results should be interpreted with caution. Of the various statistical techniques available for frontier analysis in health care, the selection of DEA for this study was made to directly compare with the results of Ozgen and Ozcan (2002), and to reduce specification errors given the perceived questionable quality and non-normal distributional characteristics of the Medicare cost report data used. DEA is a robust and widely regarded methodology, but it has some drawbacks. First, the findings from a DEA study reflect relative efficiency, not absolute efficiency. Although the dialysis facilities in the sample that were operating at the highest level of efficiency compared with their peers were designated as efficient, DEA does not allow determination of operating efficiency according to any external standard. Secondly, the DEA technique has a weakness in that it does not impose an error term in the efficiency model and observed inefficiency is often attributed to poor management (Bryce, Engberg, and Wholey 2000). However, there may be other measurement errors due to factors such as unobserved variables, or output measure(s) may be underidentified. For example, in the definition of the output measure used in this study, it was not possible to account for variations in the quality of care. To the extent that quality varies in the production of dialysis services, this may be a missing contributory component in the input–output equation that determines efficiency. A facility may have been deemed efficient while providing a lower quality of care, or conversely, may use a higher number of inputs to produce higher quality outputs. There may also be differences in output units between dialysis provided in the facility versus self-administered dialysis performed at home, and some centers may appear more or less efficient because of a mix of in-center and home dialysis services. However, in our sample of facilities that provided in-center hemodialysis in 2010, only 9 percent of 4-hour session equivalents were provided in the home setting. As a result, we did not believe that creating a separate output measure was warranted, but this remains a limitation of this study.
A criticism of DEA is that, as a nonstochastic method, it is particularly sensitive to the problems of mismeasurement; one mismeasured firm may define the frontier for all firms based on erroneous data. Although our primary data source was government-audited cost reports, which should provide some assurances of data quality, extensive missing data and outlier edits were applied to the study dataset (as described in Table1) to minimize the potential for misreporting errors. The efficiency frontier in this study was defined by over one-quarter of all observations scoring 1.0, which provides further reassurance of the accuracy of the frontier definition.
Regarding the regression analysis, multinomial logistic regression assumes independence among the dependent variable choices. However, DEA efficiency scores cannot be independent of each other because the scores are relative, that is, the calculation of the efficiency score for each observation involves all the other observations (Xue and Harker 1999). Violation of this assumption can lead to meaningless predictions; for example, efficiency scores outside of the range of 0 to 1. Although this study did not encounter problems of this type, alternative statistical techniques that can be used to avoid such problems include fractional regression (Ramalho, Ramalho, and Henriques 2010) and bootstrapping (Simar and Wilson 1998).
Additional limitations were the absence of measures to adjust for variability in patient case mix across facilities, and the possibility of selection bias due to the fact that some facilities had to be excluded because of missing data. For the regression model, although efforts were made to specify a model that would reduce the potential for collinearity among the explanatory variables, our results may be biased due to endogeneity in the model (Orme and Smith 1996). Finally, estimated savings related to less frequent ESA dosing were based on theoretical estimates from two time and motion studies, which may not reflect actual savings. As this was a U.S.-specific study, in the free-standing dialysis facility setting only, findings about efficiencies that might be gained through switching to less frequent ESA dosing cannot be generalized to other countries, to other disease states such as oncology, or to the hospital-based dialysis setting. Extended ESA dose frequency may have benefits in other countries, treatment settings, or in the treatment of anemia in other diseases.
The incentives for cutting costs while maintaining quality continue to evolve in the Medicare ESRD program. Efficiency measures are under consideration for discussions relating to the ESRD QIP. In the new era of pay for performance, it will be important to continue to monitor dialysis center efficiency, and to concurrently investigate the use of efficiency models that incorporate quality of care dimensions as inputs, outputs, or both. The DEA approach is a methodology to consider in this discussion, along with a number of enhancements and possible improvements that might be pursued relative to the current model presented. Measures such as mortality rates, hospitalization rates, transfusion rates, and dialysis dose adequacy can be considered for inclusion if differences in quality of care in the production of dialysis services are to be understood and controlled for. Going forward, it will be important to examine the effects of the new ESRD prospective payment system on dialysis center efficiency by extending this work via a longitudinal study. Alternative modeling techniques such as stochastic frontier models or a Malmquist approach (Ozgen and Ozcan 2004) may be useful to consider. Lastly, to the extent that dialysis facilities modify practices in response to the availability of technology innovations such as longer acting ESAs, real-world data should be used in lieu of simulation to understand the effects of these changes.
Acknowledgments
Joint Acknowledgment/Disclosure Statement: This study was supported by Amgen Inc. The authors thank Mandy Suggitt, who provided editing support on behalf of Amgen Inc. JMS has received consulting and research fees from Amgen Inc. JM has received consulting fees from Prima Health Analytics to conduct statistical analysis on this study. SS and MG were employees of Amgen Inc. and had stock/stock options in Amgen Inc.
Disclosures: None.
Disclaimers: None.
Supporting Information
Additional supporting information may be found in the online version of this article:
Appendix SA1: Author Matrix.
References
- Besarab A, Frinak S, Yee J. What Is So Bad about a Hemoglobin Level of 12 to 13 g/dL for Chronic Kidney Disease Patients Anyway? Advances in Chronic Kidney Disease. 2009;16(2):131–42. doi: 10.1053/j.ackd.2008.12.007. doi:10.1053/j.ackd.2008.12.007. [DOI] [PubMed] [Google Scholar]
- Bryce CL, Engberg JB, Wholey DR. Comparing the Agreement among Alternative Models in Evaluating HMO Efficiency. Health Services Research. 2000;35(2):509–28. [PMC free article] [PubMed] [Google Scholar]
- Centers for Medicare and Medicaid Services. 2010a. . “ ESRD Prospective Payment System Final Rule, Regulation Number CMS-1418-F ” [accessed on August 12, 2010]. Available at http://edocket.access.gpo.gov/2010/pdf/2010-18466.pdf.
- Centers for Medicare and Medicaid Services. 2010b. . “ Renal Cost Reports ” [accessed on March 5, 2012]. Available at http://cms.gov/CostReports/Downloads/RenalFY2010.zip.
- Centers for Medicare and Medicaid Services. 2011. . “ Dialysis Facility Compare ” [accessed on November 9, 2011]. Available at http://data.medicare.gov/dataset/Dialysis-Facility-Compare-Listing-by-Facility/23ew-n7w9.
- Centers for Medicare and Medicaid Services. 2012. . “ ESRD Prospective Payment System 2013 Final Rule and QIP 2015 Final Rule, Regulation Number CMS-1352-F .” Available at http://www.ofr.gov/OFRUpload/OFRData/2012-26903_PI.pdf.
- Charytan C. Bundled-Rate Legislation for Medicare Reimbursement for Dialysis Services: Implications for Anemia Management with ESAs. Clinical Journal of the American Society of Nephrology. 2010;5(12):2355–62. doi: 10.2215/CJN.04820610. doi:10.2215/CJN.04820610. [DOI] [PubMed] [Google Scholar]
- Cooper WW, Seiford LM, Zhu J. Handbook on Data Envelopment Analysis. Boston, MA: Springer Kluwer Academic Publishers; 2004. [Google Scholar]
- Coyne DW. The Health-related Quality of Life Was Not Improved by Targeting Higher Hemoglobin in the Normal Hematocrit Trial. Kidney International. 2012;83:235–41. doi: 10.1038/ki.2012.76. [DOI] [PMC free article] [PubMed] [Google Scholar]
- DeLellis NO, Ozcan YA. Quality Outcomes among Efficient and Inefficient Nursing Homes: A National Study. Health Care Management Review. 2013;38(2):156–65. doi: 10.1097/HMR.0b013e31824bec38. , and . “ .” . doi:10.1097/HMR.0b013e31824bec38. [DOI] [PubMed] [Google Scholar]
- DeOreo PB. Finances of the Independent Dialysis Facility. Blood Purification. 2007;25(1):7–11. doi: 10.1159/000096390. doi:10.1159/000096390. [DOI] [PubMed] [Google Scholar]
- Freburger JK, Ng LJ, Bradbury BD, Kshirsagar AV, Brookhart MA. Changing Patterns of Anemia Management in US Hemodialysis Patients. The American Journal of Medicine. 2012;125(9):906–14. doi: 10.1016/j.amjmed.2012.03.011. , and . “ .” . doi:10.1016/j.amjmed.2012.03.011. [DOI] [PubMed] [Google Scholar]
- Hackbarth GM. 2012. . “ Medicare Payment Advisory Commission (MedPAC) Comment Letter on QIP Proposed Rule, File Code CMS-1352-P ” [accessed on September 4, 2012]. Available at http://www.medpac.gov/documents/08312012_ESRD_comment.pdf.
- Mark BA, Jones CB, Lindley L, Ozcan Y. An Examination of Technical Efficiency, Quality and Patient Safety in Acute Care Nursing Units. Policy, Politics & Nursing Practice. 2009;10(3):180–6. doi: 10.1177/1527154409346322. doi:10.1177/1527154409346322. [DOI] [PMC free article] [PubMed] [Google Scholar]
- Orme C, Smith P. The Potential for Endogeneity Bias in Data Envelopment Analysis. Journal of the Operational Research Society. 1996;47(1):73–83. doi:10.1057/palgrave.jors.0470107. [Google Scholar]
- Ozcan YA, Luke RD. A National Study of the Efficiency of Hospitals in Urban Markets. Health Services Research. 1993;27(6):719–39. [PMC free article] [PubMed] [Google Scholar]
- Ozgen H, Ozcan YA. A National Study of Efficiency for Dialysis Centers: An Examination of Market Competition and Facility Characteristics for Production of Multiple Dialysis Outputs. Health Services Research. 2002;37(3):711–32. doi: 10.1111/1475-6773.00045. doi:10.1111/1475-6773.00045. [DOI] [PMC free article] [PubMed] [Google Scholar]
- Ozgen H, Ozcan YA. Longitudinal Analysis of Efficiency in Multiple Output Dialysis Markets. Health Care Management Science. 2004;7(4):253–61. doi: 10.1007/s10729-004-7534-2. [DOI] [PubMed] [Google Scholar]
- Palmer S, Torgerson DJ. Economics Notes: Definitions of Efficiency. British Medical Journal. 1999;318(7191):1136. doi: 10.1136/bmj.318.7191.1136. doi:10.1136/bmj.318.7191.1136. [DOI] [PMC free article] [PubMed] [Google Scholar]
- Pisoni RL, Fuller DS, Bieber BA, Gillespie BW, Robinson BM. The DOPPS Practice Monitor for US Dialysis Care: Trends through August 2011. American Journal of Kidney Diseases. 2012;60(1):160–5. doi: 10.1053/j.ajkd.2012.04.001. doi:10.1053/j.ajkd.2012.04.001. [DOI] [PubMed] [Google Scholar]
- Ramalho EA, Ramalho JJS, Henriques PD. Fractional Regression Models for Second Stage DEA Efficiency Analyses. Journal of Productivity Analysis. 2010;34(3):239–55. doi:10.1007/s11123-010-0184-0. [Google Scholar]
- Saueressig U, Kwan JTC, De Cock E, Sapède C. Healthcare Resource Utilization for Anemia Management: Current Practice with Erythropoiesis-stimulating Agents and the Impact of Converting to Once-Monthly C.E.R.A. Blood Purification. 2008;26(6):537–46. doi: 10.1159/000171873. doi:10.1159/000171873. [DOI] [PubMed] [Google Scholar]
- Schiller B, Doss S, De Cock E, Del Aguila MA, Nissenson AR. Costs of Managing Anemia with Erythropoiesis-stimulating Agents during Hemodialysis: A Time and Motion Study. Hemodialysis International Symposium on Home Hemodialysis. 2008;12(4):441–9. doi: 10.1111/j.1542-4758.2008.00308.x. [DOI] [PubMed] [Google Scholar]
- Sexton TR, Leiken AM, Nolan AH, Liss S, Hogan A, Silkman RH. Evaluating Managerial Efficiency of Veterans Administration Medical Centers Using Data Envelopment Analysis. Medical Care. 1989;27(12):1175–88. doi: 10.1097/00005650-198912000-00009. [DOI] [PubMed] [Google Scholar]
- Simar L, Wilson PW. Sensitivity Analysis of Efficiency Scores: How to Bootstrap in Nonparametric Frontier Models. Management Science. 1998;44(1):49–61. doi:10.1287/mnsc.44.1.49. [Google Scholar]
- Singh AK. Does TREAT Give the Boot to ESAs in the Treatment of CKD Anemia? Journal of the American Society of Nephrology. 2010;21(1):2–6. doi: 10.1681/ASN.2009111127. doi:10.1681/ASN.2009111127. [DOI] [PubMed] [Google Scholar]
- Swaminathan S, Mor V, Mehrotra R, Trivedi A. Medicare's Payment Strategy for End-Stage Renal Disease Now Embraces Bundled Payment and Pay-For-Performance to Cut Costs. Health Affairs. 2012;31(9):2051–8. doi: 10.1377/hlthaff.2012.0368. doi:10.1377/hlthaff.2012.0368. [DOI] [PMC free article] [PubMed] [Google Scholar]
- Teehan G, Benz RL. An Update on the Controversies in Anemia Management in Chronic Kidney Disease: Lessons Learned and Lost. Anemia. 2011;2011:1–5. doi: 10.1155/2011/623673. doi:10.1155/2011/623673. [DOI] [PMC free article] [PubMed] [Google Scholar]
- United States Renal Data System. Annual Data Report: Atlas of Chronic Kidney Disease and End-stage Renal Disease in the United States. Bethesda, MD: National Institute of Diabetes and Digestive and Kidney Diseases; 2012. , Vol. 2. [accessed on September 28, 2012]. Available at http://www.usrds.org/adr.aspx. [DOI] [PubMed] [Google Scholar]
- US Census Bureau. 2012. . “ American Factfinder Download Center ” [accessed on April 3, 2012]. Available at http://factfinder.census.gov/servlet/DownloadDatasetServlet?lang=en.
- Vizethann J. Advancement in Laboratory Services Since the Bundle. Renal Business Today. 2012 . “ .” [accessed on September 6, 2012.]. Available at http://www.renalbusiness.com/articles/2012/09/advancement-in-laboratory-services-since-the-bundle.aspx. [Google Scholar]
- Whinston MD. Lectures on Antitrust Economics. Cambridge, MA: The MIT Press; 2006. [Google Scholar]
- Xue M, Harker PT. Overcoming the Inherent Dependency of DEA Efficiency Scores: A Bootstrap Approach (No. 99-17) Philadelphia, PA: Wharton Financial Institutions Center; 1999. , and . “ .” [accessed on July 15, 2013]. Available at http://fic.wharton.upenn.edu/fic/papers/99/9917.pdf. [Google Scholar]
Associated Data
This section collects any data citations, data availability statements, or supplementary materials included in this article.
Supplementary Materials
Appendix SA1: Author Matrix.