

Abstract
Plastid-to-nucleus DNA transfer provides a rich genetic resource to the complexity of plant nuclear genome architecture. To date, the evolutionary route of nuclear plastid DNA (nupt) remain unknown in conifers. We have sequenced the complete plastomes of two yews, Amentotaxus formosana and Taxus mairei (Taxaceae of coniferales). Our comparative genomic analyses recovered an evolutionary scenario for plastomic reorganization from ancestral to extant plastomes in the three sampled Taxaceae genera, Amentotaxus, Cephalotaxus, and Taxus. Specific primers were designed to amplify nonsyntenic regions between ancestral and extant plastomes, and 12.6 kb of nupts were identified based on phylogenetic analyses. These nupts have significantly accumulated GC-to-AT mutations, reflecting a nuclear mutational environment shaped by spontaneous deamination of 5-methylcytosin. The ancestral initial codon of rps8 is retained in the T. nupts, but its corresponding extant codon is mutated and requires C-to-U RNA-editing. These findings suggest that nupts can help recover scenarios of the nucleotide mutation process. We show that the Taxaceae nupts we retrieved may have been retained because the Cretaceous and they carry information of both ancestral genomic organization and nucleotide composition, which offer clues for understanding the plastome evolution in conifers.
Keywords: plastome, Nupt, ancestral genome, genomic reorganization, taxaceae, conifer
Introduction
Plastids are cellular organelles descended from a free-living cyanobacterium (Martin et al. 2002). Their genomes (so-called plastomes) are extremely reduced with a large fraction of genes transferred to the nucleus. Transfer of plastid DNA to nuclear genomes is an ongoing process that increases the complexity of nuclear genomes (Timmis et al. 2004). Previous comparative genomic studies indicated that on average approximately 14% of the nuclear-encoded proteins were acquired from the cyanobacterial ancestor of plastids (Deusch et al. 2008). Transgenic experiments also demonstrated a high frequency of plastid-to-nucleus transfers with one event per 11,000 pollen grains or per 273,000 ovules (Sheppard et al. 2008).
Nuclear plastid DNA, termed nupts (Richly and Leister 2004), has been discovered in a large number of plant species (Smith et al. 2011). Nupts can contribute to nuclear exonic sequences (Noutsos et al. 2007) and plays an important role in plant evolution. Nupts may be initially inserted close to centromeres and then fragmented and distributed by transposable elements (Michalovova et al. 2013). The amount of nupts in plants is associated with the nuclear genome size and the number of plastids per cell (Smith et al. 2011; Yoshida et al. 2014).
Research of nupts remains limited to plant species with both nuclear and plastid genomes have been completely sequenced. In nuclear genomes, the arrangement of nupts resembled that of plastomes or consisted of mosaic DNA derived from both plastids and mitochondria (Leister 2005; Noutsos et al. 2005). Notably, a 131-kb nupt of rice was found to harbor a 12.4-kb inversion, which was considered to have taken place by homologous recombination in the plastome before the transfer (Huang et al. 2005). Recently, Rousseau-Gueutin et al. (2011) proposed a polymerase chain reaction (PCR)-based method to amplify nupts containing a specific ancestral sequence that was deleted from the plastomes of viable offspring. Hence, ancestral plastomic characteristics, such as unique indels and gene orders of specific fragments, may be retained in nupts. Construction of an ancestral plastomic organization should therefore yield valuable clues to retrieve nupts. If a plastomic inversion can distinguish an ancestral plastome from its current counterpart, appropriate primers based on the ancestral plastomic organization should be able to amplify the corresponding nupts that were transferred to the nucleus before the inversion (fig. 1).
Fig. 1.—
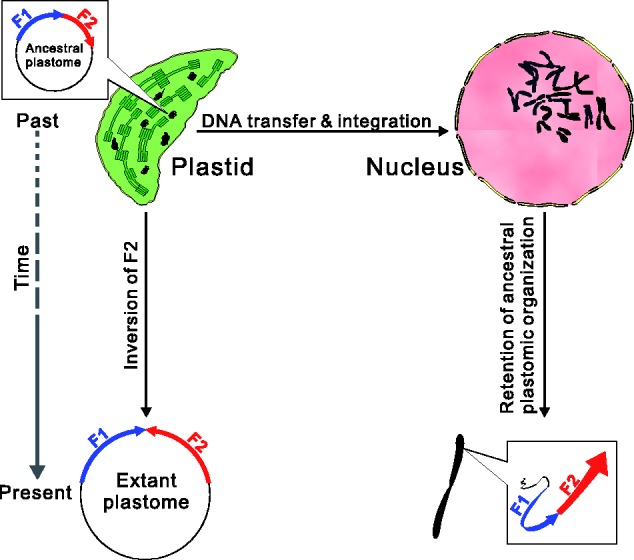
A schematic explanation for the amplification of ancestral plastomic DNAs transferred from plastids to the nucleus. Top left: An ancestral plastomic fragment that includes F1 and F2 subfragments with a head-to-tail arrangement was transferred to the nucleus (top right) in the past. After this transfer, an inversion of F2 occurred, which resulted in a head-to-head arrangement of F1 and F2 in the extant plastome. Primers based on distinctive arrangements between ancestral and extant plastomes can facilitate specific amplification of transferred ancestral plastomic fragments and avoid contaminants from amplification of the extant plastome.
Although the first known nupt was identified more than three decades ago (Timmis and Scott 1983), nupts of gymnosperms still remain poorly studied. Conifers, the most diverse gymnosperm group, possess huge nuclear genomes ranging from 8.3 to 64.3 pg (2C) (reviewed in Wang and Ran 2014) and may have integrated many nupts. The plastomes of conifers are highly rearranged, possibly due to their common loss of a pair of large-inverted repeats (IR) (Wicke et al. 2011; Wu and Chaw 2014). Numerous plastomic rearrangements have been identified and are useful in reconstructing phylogenetic relationships between taxa and inferring intermediate ancestral plastomes (Wu and Chaw 2014). Therefore, the conifer plastomes are well suited for evaluating the feasibility of retrieving nupts and surveying their evolution (fig. 1).
Taxaceae (yews) is the smallest family of conifers, consisting of 28 species in six genera, Amentotaxus, Austrotaxus, Cephalotaxus, Pseudotaxus, Taxus, and Torreya. They are mainly distributed in the northern hemisphere. Amentotaxus includes five species restricted to subtropical southeastern Asia, from Taiwan west across southern China to Assam in the eastern Himalayas and south to Vietnam (Cheng et al. 2000). Taxus includes seven species, best known for containing anticancer agent taxol. They commonly occur in the understory of moist temperate or tropical mountain forests (de Laubenfels 1988).
In this study, we aim to demonstrate our approach (fig. 1) for mining nupts in yews and to continue the understanding of the plastome evolution in conifers. To better reconstruct ancestral plastomes of yews, we sequenced two complete plastomes, one from each of the yew genera Amentotaxus and Taxus. The primers based on the recovered ancestral plastomic organization were used to amplify potential nupts. The origins of obtained nupt candidates were then examined by phylogenetic analyses and mutation preferences to ensure that they were indeed transferred plastomic DNA in the nucleus. Here, for the first time, we demonstrate that conifer nupts can be PCR amplified using our approach and that ancestral plastomic characteristics retained in nupts can be compared with extant ones, providing valuable information for understanding plastome evolution in conifers.
Materials and Methods
DNA Extraction, Sequencing, and Genome Assembly
Young leaves of Amentotaxus formosana and Taxus mairei were harvested in the greenhouse of Academia Sinica and Taipei Botanical Garden, respectively, then ground with liquid nitrogen. Total DNA was extracted by a hexadecyltrimethylammonium bromide (CTAB) method with 2% polyvinylpyrrolidone (Stewart and Via 1993). The DNA was qualified by a threshold of both 260/280 = 1.8–2.0 and 260/230 >1.7 for next-generation DNA sequencing on an Illumina GAII instrument at Yourgene Bioscience (New Taipei City, Taiwan). For each species, approximately 4 GB of 73-bp paired-end reads were obtained. These short reads were trimmed with a threshold of error probability <0.05 and then de novo assembled by use of CLC Genomic Workbench 4.9 (CLC Bio, Aarhus, Denmark). Contigs with sequence coverage of depth greater than 50× were blasted against the nr database of the National Center for Biotechnology Information (NCBI). Contigs with hits for plastome sequences with E value <10−10 were retained for subsequent analyses. Gaps between contigs were closed by PCR experiments with specific primers. PCR amplicons were sequenced on an ABI 3730xl DNA Sequencer (Life Technologies).
Genome Annotation and Sequence Alignment
Genome annotation involved use of Dual Organellar Genome Annotator (DOGMA) with the default option (Wyman et al. 2004). Transfer RNA genes were explored by using tRNA scan-SE 1.21 (Schattner et al. 2005). For each species, we aligned the annotated genes and their orthologous genes of other known conifer plastomes to confirm gene boundaries. Sequences were aligned using MUSCLE (Edgar 2004) implemented in MEGA 5.0 (Tamura et al. 2011).
Exploration of SNPs, Indels, and SSRs
For estimating the distribution of both single-nucleotide polymorphisms (SNPs) and indels between our newly sequenced plastome of T. mairei and the T. mairei voucher NN014, the two genomes were aligned by using VISTA (Frazer et al. 2004). The alignment was then manually divided into nonoverlapping bins of 200 bp according to the position of our newly sequenced T. mairei plastome. Both SNPs and indels in each bin were estimated by using DnaSP 5.10 (Librado and Rozas 2009). Simple sequence repeats (SSRs) of the T. mairei plastome were explored using SSRIT (Temnykh et al. 2001) with a threshold of repeat units >3.
Construction of Ancestral Plastomic Organization
We performed whole-plastomic alignments between the two yews under study and other conifers, Calocedrus formosana (NC_023121), Cephalotaxus wilsoniana (NC_016063), Cryptomeria japonica (NC_010548), Cunninghamia lanceolata (NC_021437), and Taiwania cryptomerioides (NC_016065), to detect locally collinear blocks (LCBs) using Mauve 2.3.1 (Darling et al. 2010). The yielded matrix of LCBs was used for constructing the putative ancestral plastomic organizations on MGR 2.03 (Bourque and Pevzner 2002), which seeks the minimal genomic rearrangements over all edges of a most parsimonious tree.
PCR Amplification, Cloning, and Sequencing
Ten pairs of specific primers used for amplification of nupt sequences were designed and their sequences and corresponding locations are in supplementary table S1, Supplementary Material online and figure 3. PCR amplification involved use of the long-range PCR Tag (TaKaRa LA Taq, Takara Bio Inc.) under the thermo-cycling condition 98 °C for 3 min, followed by 30 cycles of 98 °C for 15 s, 55 °C for 15 s, and 68 °C for 4 min, and a final extension at 72 °C for 10 min. Amplicons were checked by electrophoresis. Amplicons with expected lengths were collected and cloned into yT&A vectors (Yeastern Biotech Co., Taipei) that were then proliferated in Escherichia coli. Sequencing the proliferated amplicons involved M13-F and M13-R primers on an ABI 3730xl DNA Sequencer (Life Technologies).
Fig. 3.—

Hypothetical evolutionary scenarios for plastomic rearrangements in Taxaceae. Plastomes are circular but here are shown in gray horizontal bars (beginning at psbA) for pairwise comparisons. Color triangles within the gray horizontal bars denote LCBs with their relative orientations. Gray bars from top to bottom indicate the corresponding plastomes in the common ancestor of Taxaceae, intermediate ancestors, and extant representative species. Inversions between two plastomes are linked by orange curved lines. Ancestral gene orders before the occurrence of specific inversions are shown along tree branches. Primer pairs (black arrows) for amplification of the corresponding ancestral fragments are labeled: Tax-1 to 4 for Taxus mairei, Ame-1 to 2 for Amentotaxus formosana, and Cep-1 to 5 for Cephalotaxus wilsoniana (see supplementary table S1, Supplementary Material online, for primer sequences).
Phylogenetic Tree Analysis
Maximum-likelihood (ML) trees were inferred from sequences of potential nupts, their plastomic counterparts, and their orthologs of other gymnosperms using MEGA 5.0 (Tamura et al. 2011) under a GTR + G (four categories) model. Supports for nodes of trees were evaluated by 1,000 bootstrap replications.
Calculation of Mutations in Nupts and Their Plastomic Counterparts
The sequence for each nupt was aligned with the homologous plastome sequences for A. formosana, Ce. wilsoniana, T. maire, and Cu. lanceolata using MUSCLE (Edgar 2004). To precisely calculate the mutational preference in nupts, all ambiguous sites and gaps were removed from our alignments. Nucleotide divergence between nupts and their plastomic counterparts were derived from mutations in nupts or their plastomic counterparts. A mutation of a nupt or the plastomic counterpart was recognized when the corresponding site of the plastomic counterpart or nupt was identical to that of at least two other taxa. For example, a specific aligned site has “T”, “C”, “C”, “C”, and “C” in Cep-2 nupt, Ce. wilsoniana, A. formosana, T. maire, and Cu. lanceolata, respectively (also see the aligned position 32 in supplementary fig. S5, Supplementary Material online). This site would be recognized as a nonsynonymous mutation from “C” to “T” in the Cep-2 nupt as the corresponding amino acid change from alanine to valine.
Genome Map and Statistical Analyses
The plastome map of T. mairei was drawn using Circos (http://circos.ca/, last accessed August 9, 2014). All statistical tests, including Pearson’s correlation test and Student’s t-test, involved use of Microsoft Excel 2010.
Results
Plastomic Evolution of T. mairei toward Reduction and Compaction
The plastomes of A. formosana (AP014574) and T. mairei (AP014575) are circular molecules with AT contents of 64.17% and 65.32%, respectively. The T. mairei (128,290 bp) plastome has lost five genes (rps16, trnA-UGC, trnG-UCC, trnI-GAU, and trnS-GGA) compared with that of A. formosana (136,430 bp), which leads to a relatively smaller plastome size. The coding regions occupy 61.27% of the plastome length in A. formosana and 64.18% in T. mairei. The gene density was estimated to be 0.88 and 0.90 (genes/kb) for the plastome of A. formosana and T. mairei, respectively. In addition, the other two published plastomes for Taxaceae species, Ce. wilsoniana (NC_016063) and Ce. oliveri (NC_021110), are 136,196 and 134,337 bp, respectively. Altogether, these data suggest that the plastome of T. mairei has evolved toward reduction and compaction.
Dot-plot analysis (supplementary fig. S1, Supplementary Material online) reveal three genomic rearrangements between the plastomes of A. formosana and T. mairei, including a relocated fragment of approximately 18 kb from psbK to trnC-GCA, a relocated fragment of approximately 16 kb from trnD-GUC to trnT-UGU, and an inverse fragment of approximately 18 kb from 5'rps12 to infA. However, the two plastomes share a unique inverted repeat pair that contains trnQ-UUG in each copy, hereafter termed “trnQ-IR” (supplementary fig. S1, Supplementary Material online).
Intraspecies Variations in the Plastomes of T. mairei
To date, the plastomes of three T. mairei individuals (T. mairei voucher NN014: NC_020321, T. mairei voucher SNJ046: JN867590, and T. mairei voucher WC052: JN867591) have been published. Together with our newly sequenced plastome of T. mairei, these four plastomes vary slightly in size ranging from 127,665 to 128,290 bp. A neighbor-joining tree inferred from the whole-plastomic alignment between these four individuals and A. formosana is shown in supplementary figure S2, Supplementary Material online. The tree topology indicates that although the plastome size of SNJ046 and WC052 is similar to that of NN014, SNJ046, and WC052 form a sister clade to our locally sampled T. mairei.
We also performed a pairwise genome comparison between our T. mairei and voucher NN014 because the latter was designated as the reference sequence (RefSeq) in NCBI GenBank. We detected 858 SNPs and 218 indels. Supplementary figure S3, Supplementary Material online, shows that the intergenic spacers and coding regions contained nearly equal numbers of SNPs. Most of the indels were found in the intergenic spacers. We found 33 indels in the coding regions, but none caused frameshifts. Figure 2 illustrates the distribution of SNPs, indels, and SSRs in the plastome of our sampled T. mairei. Interestingly, the abundance of SSRs was positively correlated with that of SNPs (Pearson, r = 0.52, P < 0.01), with no correlation between SSRs and indels (Pearson, r = 0.02, P = 0.89). In legumes, the region that contains ycf4, psaI, accD, and rps16 was found to be hypermutable (Magee et al. 2010). In the plastome of T. mairei, three 200-bp bins that locate in the sequence of 5′clpP (position 55,001–55,200), that of 5′ycf1 (pos. 124,201–124,400), and the intergenic spacer between rrn16 and rrn23 (pos. 96,801–97,000) contained the highest sum of SNPs, indels, and SSRs (fig. 2). Therefore, these loci can be considered intraspecies mutational hotspots in T. mairei and can be potentially high-resolution DNA barcodes in the study of population genetics.
Fig. 2.—

Distribution of SNPs, indels, and SSRs in the plastomes of Taxus mairei. The outermost circle is the plastome map of T. mairei (AP014575) with genes that are transcribed counter-clockwise (outer boxes) and clockwise (inner boxes), respectively. The immediately next circle denotes a scale of 5-kb units beginning at psbA gene (the 3 o’clock position). In the gray zone, three histograms from outer to inner are 1) counts of SNPs, 2) counts of indels, and 3) total indel lengths within nonoverlapping 200-bp bins across the entire plastome. Triangles mark locations of SSRs.
Retrieval of Ancestral Plastome Sequences in Taxaceae
A matrix with 20 LCBs was generated on the basis of whole-plastome alignments between the sampled three Taxaceae and four Cupressaceae species. This matrix of LCBs was then used in reconstructing ancestral plastomic organization. The most parsimonious tree with the corresponding ancestral plastomic organization is shown in supplementary figure S4, Supplementary Material online and figure 3, and that the three Taxaceae species form a monophyletic clade whereas A. formosana is closer to Ce. wilsoniana than to T. mairei. This topology is in good agreement with the recent molecular review of the conifer phylogeny by Leslie et al. (2012). Figure 3 shows the detailed evolutionary scenario of plastomic rearrangements with the intermediate ancestral plastomes in the three examined Taxaceae species. By comparing the ancestral and extant plastomes, one, three, and two inversions might have occurred in A. formosana, Ce. wilsoniana and T. mairei, respectively, after they had diverged from their common ancestor. Specific primer pairs were used for amplifying the corresponding ancestral fragments that differ from the extant plastomes in genomic organization (fig. 3). Five (Ame-2, Cep-2, Cep-5, Cep-6, and Tax-4) out of the ten primer pairs were able to produce amplicons totaling 16.6 kb (see supplementary table S2, Supplementary Material online, for accession numbers).
Characteristics of Potential Nupt Amplicons
The obtained PCR amplicons were sequenced and annotated (supplementary table S2, Supplementary Material online). With the exception of chlB of Cep-2, all putative protein-coding genes contain no premature stop codons. The coding sequence (CDS) of each amplicon was aligned with its plastomic counterparts and orthologs of other cupressophytes, Ginkgo and Cycas. We used ML trees inferred from concatenated CDSs to examine the origins of these PCR amplicons, with Ginkgo and Cycas as the outgroup (fig. 4). In each tree, the plastomic sequences were divided into three groups (i.e., the Cupressaceae clade, the Taxaceae clade, and the clade comprising Araucariaceae and Podocarpaceae). Notably, the placements of our PCR amplicons are incongruent among the four trees. For example, both Ame-2 and Cep-2 were clustered with their plastomic counterparts (fig. 4A). In contrast, Cep-5, Cep-6, and Tax-4 were placed remotely from their individual plastomic counterparts, indicating that they originated via horizontal transfer (fig. 4B–D).
Fig. 4.—

Origin of the obtained PCR amplicons examined by ML phylogenetic analyses. PCR amplicons are labeled “PCR,” and their plastomic counterparts and orthologs of other gymnosperms are labeled “pt.” Taxa of the same conifer family are in the same color. Cycas and Ginkgo together are the outgroup. Bootstrapping values assessed with 1,000 replicates are shown along branches.
The ancestral plastomic organization that we used to design primers for amplification of Ame-2 and Cep-2 was rearranged by a 34-kb inversion flanked by trnQ-IRs. This trnQ-IR is 564 and 549 bp for A. formosana and Ce. wilsoniana, respectively. IRs of similar sizes can mediate homologous recombination in the conifer plastomes (Tsumura et al. 2000; Wu et al. 2011; Yi et al. 2013; Guo et al. 2014). As a result, if the trnQ-IR-mediated isomeric plastome is present in our sampled taxa, our PCR approach may also be able to amplify isomeric plastomic fragments. Ame-2 has 100% sequence identity with its plastomic counterpart (fig. 4A) in the CDS, which strongly suggests its origin as an isomeric plastome. Cep-2 differs from its plastomic counterpart by several mutations, including two premature stop codons in chlB, of which one of the two cannot be replaced by neither U-to-C nor C-to-U RNA-editing (supplementary fig. S5, Supplementary Material online). Therefore, the origin of Cep-2 is from a horizontal transfer rather than an isomeric plastome.
Evolution of Nupt Sequences in Taxaceae
The sequence identity between the four nupts and their plastomic counterparts ranges from 61.71% to 99.08% (table 1). In fact, differences in aligned sites between nupts and their plastomic counterparts are derived from two types of mutations. One is the mutation in nupts and the other is that in plastomes. As shown in table 1, with the exception of Tax-4, all nupts accumulated more mutations than their plastomic counterparts. The low sequence identity between Tax-4 and its plastome sequences (61.71% in table 1) may be due to the unusually increased mutations in the latter. In all nupts except Cep-5, at least one potential protein-coding gene had the ratio of nonsynonymous (dn)/synonymous (ds) mutations >1, which reflects relaxed functional constraints in nupts. Figure 5 illustrates nucleotide mutation classes in nupts and their corresponding plastome sequences. We excluded the plastomic counterpart of Cep-2 from calculation because we observed only one mutation in the sequence. In all nupts, transitional mutations comprise over 50% of the total mutations. The mutation of G to A and its complement C to T (denoted GC-to-AT in fig. 5) had the highest frequency in both nupts and plastome sequences. To examine which of the mutation classes is statistically predominant, we compared the two most abundant classes of mutations. In nupts, the frequency was higher for GC-to-AT than AT-to-GC mutations (t-test, P = 0.018). However, GC-to-AT and AT-to-GC mutations did not differ in plastome sequences (t-test, P = 0.379), suggesting different mutational environments between nupts and their corresponding plastome sequences.
Table 1.
Mutations in Nupts and Their Plastomic Counterparts
| Nupt | Identitya | Lengthb | Number of Mutations |
|||
|---|---|---|---|---|---|---|
| (%) | (bp) | Total | Potential Protein-Coding Gene | dn | ds | |
| Cep-2 | 99.08 | 2,961 | 29 (1) | chlB | 19 (0) | 7 (1) |
| rps4 | 0 (0) | 2 (0) | ||||
| Cep-5 | 88.15 | 3,380 | 117 (75) | psbA | 2 (4) | 16 (10) |
| chlL | 3 (4) | 24 (17) | ||||
| chlN | 12 (15) | 38 (42) | ||||
| Cep-6 | 89.84 | 2,207 | 100 (67) | psbA | 0 (2) | 14 (12) |
| matK | 45 (37) | 29 (10) | ||||
| Tax-4 | 61.71 | 1,466 | 42 (135) | rpl14 | 2 (2) | 0 (3) |
| rps8 | 5 (9) | 3 (12) | ||||
| infA | 4 (26) | 1 (22) | ||||
| rpl36 | 0 (1) | 1 (1) | ||||
| rps11 | 13 (10) | 14 (9) | ||||
Note.—Numbers in parentheses indicate mutations in corresponding plastomic sequences; dn, nonsynonymous; ds, synonymous.
aRefers to sequence identity between nupts and their plastomic counterparts. Gaps were included in calculating identity.
bRefers to lengths of unambiguous alignments where gaps and ambiguous sites were excluded. These alignments were used for calculating mutations.
Fig. 5.—
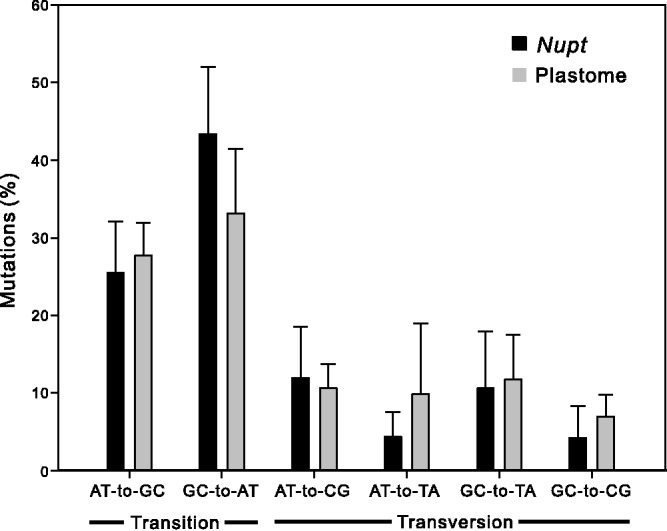
Percentage of nucleotide mutation classes in nupts and their plastomic counterparts. Types of mutations are divided into six classes. For example, the class AT-to-GC denotes the pooled percentage of the A-to-G mutations and its complement T-to-C. Data are mean ± SD.
Ages of Nupts in Taxaceae
Molecular dating of sequences highly depends on mutation rates. Unfortunately, mutation rates in the nuclear genomes of Taxaceae species have not been directly measured. The nupts identified in this study were expected to evolve neutrally. The 4-fold degenerated site is a useful indicator in measuring the rate of neutral evolution (Graur and Li 2000). In nuclear genomes of conifers, the mutation rate at the 4-fold degenerate sites was estimated to be 0.64 × 10⁻⁹ per site per year (Buschiazzo et al. 2012). In the nupts Cep-2, Cep-5, Cep-6, and Tax-4, we found 29, 117, 100, and 42 mutations among 2,961, 3,380, 2,207, and 1,466 sites, respectively (table 1). Therefore, the ages of Cep-2, Cep-5, Cep-6, and Tax-4 were estimated to be approximately 15.3, 54.1, 70.8, and 44.8 Myr, respectively.
Discussion
Labile Plastomes of Yew Family and Their Impact on Phylogenetic Studies
The phylogenetic relationships among Amentotaxus, Cephalotaxus, and Taxus have not been resolved. Recent molecular studies placed Amentotaxus as sister to Taxus (e.g., Cheng et al. 2000; Mao et al. 2012) or to Cephalotaxus (e.g., Leslie et al. 2012). We found that a 34-kb inversion from trnT to psbK distinguished A. formosana and Ce. wilsoniana from T. mairei (fig. 3), which suggests that A. formosana is closer to Ce. wilsoniana than to T. mairei. However, the plastome of another Taxus species, T. chinensis (Zhang et al. 2014), cannot be distinguished from those of A. formosana and Ce. wilsoniana by this 34-kb inversion. Of note, this 34-kb inversion is flanked by a pair of trnQ-IR sequences. We found that the trnQ-IR sequence is commonly present in A. formosana (564 bp), Ce. wilsoniana (549 bp), T. mairei (248 bp), and T. chinensis (248 bp).
The presence of the trnQ-IR pair was able to generate isomeric plastomes in Ce. oliveri (Yi et al. 2013) and four Juniperus species (Guo et al. 2014). In Pinaceae, inverted repeats larger than 0.5 kb could trigger plastomic isomerization, and retention of an isomer was species- or population-specific (Tsumura et al. 2000; Wu et al. 2011). Indeed, figure 4A revealed that Ame-2 was likely a PCR amplicon derived from the trnQ-IR-mediated isomeric plastome of A. formosana. Therefore, with the presence of an isomeric plastome, the synapomorphic character—the 34-kb inversion—in figure 3 might be a false positive result caused by insufficient sampling. Nonetheless, our data also suggest that isomeric plastomes be treated cautiously when using genomic rearrangements in phylogenetic estimates.
Disruption of the plastomic operons is rare in seed plants (Jansen and Ruhlman 2012). We found that the S10 operon of T. mairei was separated into two gene clusters (rpl23-rps8 and infA-rpoA) by an 18-kb inversion (fig. 3). Because the transcriptional direction of the S10 operon is from rpl23 to rpoA (Jansen and Ruhlman 2012), the gene cluster infA-rpoA in T. mairei likely has to acquire a novel promoter sequence for transcription. Disruption of the S10 operon was previously reported in the plastome of Geraniaceae (Guisinger et al. 2011). However, the evolutionary consequence of plastomic operon disruption has never been studied. In the plastome of T. mairei, we detected prominently elevated mutations in the two separated gene clusters of the S10 operon as compared with their relative nupts (table 1). Interestingly, two (i.e., infA and rps11 in table 1) out of the three protein-coding genes on the plastomic gene-cluster infA-rpoA had dn/ds ratios >1. Whether disruption of the S10 operon results in positive selection of these two genes requires further investigation.
Benefits and Cautions of PCR-Based Approach in Investigating Nupts
Explosive growth of available sequenced nuclear genomes offers great opportunities for investigating nuclear organellar DNA (norgs). The amount of norgs could vary depending on the use of different assembly versions of genomes and search strategies (Hazkani-Covo et al. 2010). A PCR-based approach, such as that of Rousseau-Gueutin et al. (2011) and ours, is free from this problem encountered in genome assembly. The nupts we amplified and report here are of course a few examples of conifer nupts. However, considering the huge nuclear genome of conifers whose sequencing and assembly require much cost and effort, our PCR-based approach provides a cost-effective way for studying the evolution of nupts.
Using a threshold of >70% sequence identity, Smith et al. (2011) extracted nupts of about 50 kb from the nuclear genome of Arabidopsis. The amount of Arabidopsis nupts decreased to approximately 17.6 kb when the threshold of sequence identity was increased to 90% (Yoshida et al. 2014). It seems that identification of possible nupts is largely influenced by the thresholds. Setting high thresholds might limit the exploration of nupts to only relatively recent transfers (Yoshida et al. 2014). Clearly, the problem of setting thresholds is absent from our PCR-based approach. In this study, sequence identity between nupts and their plastomic counterparts ranged from 61.71% to 99.08% (table 1). Thus, one or three of the four presented nupts would not be obtained if we had considered the thresholds of Smith et al. (2011) or Yoshida et al. (2014), respectively.
Only five of our ten primer pairs worked well, and one amplified the DNA fragment of isomeric plastomes rather than nupts. This low success rate may be due to the unsuitable primers used in our PCR experiments. Multiple primer pairs for a specific locus may improve amplification of nupts, as noted by Rousseau-Gueutin et al. (2011). Plastid-to-mitochondrion DNA transfers are frequent in seed plants (Wang et al. 2007). Because the mitochondrial genome of Taxaceae spp. is currently unavailable, the possibility that our PCR products were amplicons of mitochondrial plastid DNA could not be ruled out. The phylogenetic tree approach was previously used to examine horizontal DNA transfers (Bergthorsson et al. 2003; Rice et al. 2013), but our tree analyses in figure 4 could not distinguish the transfer events between plastid-to-nucleus and plastid-to-mitochondrion origins. The mutation rate of nuclear genomes is higher than that of plastomes in plants (Wolfe et al. 1987). All of our amplified nupts, except Tax-4, had more mutation sites than their plastomic counterparts (table 1). Disruption of the S10 operon is likely associated with the elevated mutation in the plastomic counterpart of Tax-4, as mentioned earlier. Additionally, among our nupts, the AT-to-GC mutation was predominant (fig. 5). These data are similar to the findings for nupts in rice and Nicotiana (Huang et al. 2005; Rousseau-Gueutin et al. 2011), which reflects a nuclear-specific circumstance shaped by spontaneous deamination of 5-methylcytosin.
Nupts Are Molecular Footprints for Studying Plastomic Evolution
Although mutation rates are relatively low in plant organellar genomes, norgs can serve as “molecular fossils” for genomic rearrangements (Leister 2005). Similarly, the Taxaceae nupts identified in this study do retain the ancestral plastomic organization. In other words, nupts are footprints that are valuable in reconstructing the evolutionary history of plastomic organization and rearrangements.
Dating the age of nupts is critical for elucidating the evolution of nupts. For example, the estimated ages of Cep-2, Cep-5, and Cep-6 nupts are 15.3, 54.1, and 70.8 Myr, respectively. Remarkably, these ages conflict with the scenario of plastomic rearrangements because the transfer of Cep-2 predated those of both Cep-5 and Cep-6 (fig. 3). Two plastomic forms derived from trnQ-IR-mediated homologous recombination coexist in an individual of Ce. oliveri (Yi et al. 2013). This trnQ-IR is also present in the plastome of Ce. wilsoniana as previously mentioned. We suspect that in Ce. wilsoniana, the younger Cep-2 nupt might originate from a transferred fragment of the trnQ-IR-mediated isomeric plastome.
Most importantly, nupts can also help in probing RNA-editing sites and improving gene annotations. Figure 6 clearly reveals that the previously annotated rps8 of T. mairei (vouchers NN014, WC052, and SNJ046) is truncated. Our newly predicted initial codon, “ACG,” locates 48 bp upstream of the previously predicted site. This ACG initial codon was predicted to be corrected to “AUG” via a C-to-U RNA-editing because the corresponding sequence of Tax-4 nupt and other conifers retain a normal initial codon of “ATG” (fig. 6). These data also imply that in T. mairei, the transfer of Tax-4 nupt predates the T-to-C mutation at the second codon position in the initial codon of rps8.
Fig. 6.—
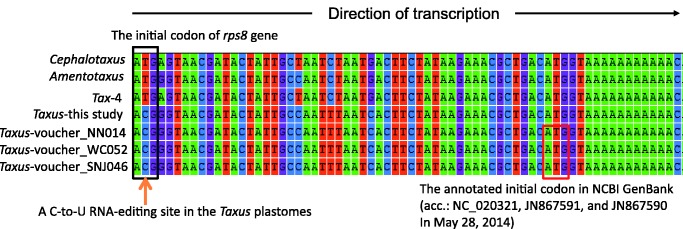
Alignment of seven rps8 sequences. The left orange arrow highlights a specific C-to-U RNA-editing site at the second codon position of the initial codon in the four sampled Taxus. mairei plastomes. A normal initial codon, ATG (black rectangle), was common among Cephalotaxus, Amentotaxus, and Tax-4. These data imply the creation of the “ACT” RNA-editing site after the transfer of Tax-4. The red rectangle denotes the initial codon annotated in the sequences from NCBI GenBank.
In conclusion, we have shown that plastomic rearrangement events provide useful information for amplifying nupts. Because avoiding the amplification of isomeric plastomic or mitochondrial DNA is difficult, examining the origins of PCR amplicons was a prerequisite in this proposed PCR-based study. In angiosperms such as Nicotiana, nupts were experimentally demonstrated to be eliminated quickly from the nuclear genome (Sheppard and Timmis 2009). However, we show that the oldest conifer nupt has been retained for 70.8 Myr (i.e., since the Cretaceous period). With an increase of available plastomes in conifers, comparative genome analyses are expected to reveal more plastomic rearrangements. Using our approach, we are beginning to understand the evolution of nupts in diverse conifer species without the need to sequence and assemble their huge nuclear genomes.
Supplementary Material
Supplementary tables S1–S2 and figures S1–S5 are available at Genome Biology and Evolution online (http://gbe.oxfordjournals.org/).
Acknowledgments
This work was supported by research grants from the National Science Council, Taiwan (NSC 100-2621-B-001-003-MY3) and from the Investigator’s Award of Academia Sinica to S.-M.C., and a doctoral student fellowship of jointed doctoral program by National Taiwan University and Academia Sinica to C.-Y.H., and a postdoctoral fellowship of Academia Sinica to C.-S.W. The authors thank two anonymous reviewers’ helpful comments on the manuscript. The authors are indebted to Dr Isheng Tsai for his critical reading and editing of this revised version.
Literature Cited
- Bergthorsson U, Adams KL, Thomason B, Palmer JD. Widespread horizontal transfer of mitochondrial genes in flowering plants. Nature. 2003;424:197–201. doi: 10.1038/nature01743. [DOI] [PubMed] [Google Scholar]
- Bourque G, Pevzner PA. Genome-scale evolution: reconstructing gene orders in the ancestral species. Genome Res. 2002;12:26–36. [PMC free article] [PubMed] [Google Scholar]
- Buschiazzo E, Ritland C, Bohlmann J, Ritland K. Slow but not low: genomic comparisons reveal slower evolutionary rate and higher dN/dS in conifers compared to angiosperms. BMC Evol Biol. 2012;12:8. doi: 10.1186/1471-2148-12-8. [DOI] [PMC free article] [PubMed] [Google Scholar]
- Cheng Y, Nicolson RG, Tripp K, Chaw SM. Phylogeny of Taxaceae and Cephalotaxaceae genera inferred from chloroplast matK gene and nuclear rDNA ITS region. Mol Phylogenet Evol. 2000;14:353–365. doi: 10.1006/mpev.1999.0710. [DOI] [PubMed] [Google Scholar]
- Darling AE, Mau B, Perna NT. progressiveMauve: multiple genome alignment with gene gain, loss and rearrangement. PLoS One. 2010;5:e11147. doi: 10.1371/journal.pone.0011147. [DOI] [PMC free article] [PubMed] [Google Scholar]
- de Laubenfels David J. 1988. Coniferales. In flora malesiana, Series I, Vol. 10. Dordrecht: Kluwer Academic. p. 337-453. [Google Scholar]
- Deusch O, et al. Genes of cyanobacterial origin in plant nuclear genomes point to a heterocyst-forming plastid ancestor. Mol Biol Evol. 2008;25:748–761. doi: 10.1093/molbev/msn022. [DOI] [PubMed] [Google Scholar]
- Edgar RC. MUSCLE: multiple sequence alignment with high accuracy and high throughput. Nucleic Acids Res. 2004;32:1792–1797. doi: 10.1093/nar/gkh340. [DOI] [PMC free article] [PubMed] [Google Scholar]
- Frazer KA, Pachter L, Poliakov A, Rubin EM, Dubchak I. VISTA: computational tools for comparative genomics. Nucleic Acids Res. 2004;32:W273–W279. doi: 10.1093/nar/gkh458. [DOI] [PMC free article] [PubMed] [Google Scholar]
- Graur D, Li WH. Fundamentals of molecular evolution. Sunderland (MA): Sinauer Associates; 2000. [Google Scholar]
- Guisinger MM, Kuehl JV, Boore JL, Jansen RK. Extreme reconfiguration of plastid genomes in the angiosperm family Geraniaceae: rearrangements, repeats, and codon usage. Mol Biol Evol. 2011;28:583–600. doi: 10.1093/molbev/msq229. [DOI] [PubMed] [Google Scholar]
- Guo W, et al. Predominant and substoichiometric isomers of the plastid genome coexist within Juniperus plants and have shifted multiple times during cupressophyte evolution. Genome Biol Evol. 2014;6:580–590. doi: 10.1093/gbe/evu046. [DOI] [PMC free article] [PubMed] [Google Scholar]
- Hazkani-Covo E, Zeller RM, Martin W. Molecular poltergeists: mitochondrial DNA copies (numts) in sequenced nuclear genomes. PLoS Genet. 2010;6:e1000834. doi: 10.1371/journal.pgen.1000834. [DOI] [PMC free article] [PubMed] [Google Scholar]
- Huang CY, Grünheit N, Ahmadinejad N, Timmis JN, Martin W. Mutational decay and age of chloroplast and mitochondrial genomes transferred recently to angiosperm nuclear chromosomes. Plant Physiol. 2005;138:1723–1733. doi: 10.1104/pp.105.060327. [DOI] [PMC free article] [PubMed] [Google Scholar]
- Jansen RK, Ruhlman TA. Plastid genomes in seed plants. In: Bock R, Knoop V, editors. Genomics of chloroplasts and mitochondria. Netherlands. Springer; 2012. pp. 103–126. [Google Scholar]
- Leister D. Origin, evolution and genetic effects of nuclear insertions of organelle DNA. Trends Genet. 2005;21:655–663. doi: 10.1016/j.tig.2005.09.004. [DOI] [PubMed] [Google Scholar]
- Leslie AB, et al. Hemisphere-scale differences in conifer evolutionary dynamics. Proc Natl Acad Sci U S A. 2012;109:16217–16221. doi: 10.1073/pnas.1213621109. [DOI] [PMC free article] [PubMed] [Google Scholar]
- Librado P, Rozas J. DnaSP v5: a software for comprehensive analysis of DNA polymorphism data. Bioinformatics. 2009;25: 1451–1452. doi: 10.1093/bioinformatics/btp187. [DOI] [PubMed] [Google Scholar]
- Magee AM, et al. Localized hypermutation and associated gene losses in legume chloroplast genomes. Genome Res. 2010;20:1700–1710. doi: 10.1101/gr.111955.110. [DOI] [PMC free article] [PubMed] [Google Scholar]
- Mao K, et al. Distribution of living Cupressaceae reflects the breakup of Pangea. Proc Natl Acad Sci U S A. 2012;109:7793–7798. doi: 10.1073/pnas.1114319109. [DOI] [PMC free article] [PubMed] [Google Scholar]
- Martin W, et al. Evolutionary analysis of Arabidopsis, cyanobacterial, and chloroplast genomes reveals plastid phylogeny and thousands of cyanobacterial genes in the nucleus. Proc Natl Acad Sci U S A. 2002;99:12246–12251. doi: 10.1073/pnas.182432999. [DOI] [PMC free article] [PubMed] [Google Scholar]
- Michalovova M, Vyskot B, Kejnovsky E. Analysis of plastid and mitochondrial DNA insertions in the nucleus (NUPTs and NUMTs) of six plant species: size, relative age and chromosomal localization. Heredity. 2013;111:314–320. doi: 10.1038/hdy.2013.51. [DOI] [PMC free article] [PubMed] [Google Scholar]
- Noutsos C, Kleine T, Armbruster U, DalCorso G, Leister D. Nuclear insertions of organellar DNA can create novel patches of functional exon sequences. Trends Genet. 2007;23:597–601. doi: 10.1016/j.tig.2007.08.016. [DOI] [PubMed] [Google Scholar]
- Noutsos C, Richly E, Leister D. Generation and evolutionary fate of insertions of organelle DNA in the nuclear genomes of flowering plants. Genome Res. 2005;15:616–628. doi: 10.1101/gr.3788705. [DOI] [PMC free article] [PubMed] [Google Scholar]
- Rice DW, et al. Horizontal transfer of entire genomes via mitochondrial fusion in the angiosperm Amborella. Science. 2013;342:1468–1473. doi: 10.1126/science.1246275. [DOI] [PubMed] [Google Scholar]
- Richly E, Leister D. NUPTs in sequenced eukaryotes and their genomic organization in relation to NUMTs. Mol Biol Evol. 2004;21:1972–1980. doi: 10.1093/molbev/msh210. [DOI] [PubMed] [Google Scholar]
- Rousseau-Gueutin M, Ayliffe MA, Timmis JN. Conservation of plastid sequences in the plant nuclear genome for millions of years facilitates endosymbiotic evolution. Plant Physiol. 2011;157:2181–2193. doi: 10.1104/pp.111.185074. [DOI] [PMC free article] [PubMed] [Google Scholar]
- Schattner P, Brooks AN, Lowe TM. The tRNAscan-SE, snoscan and snoGPS web servers for the detection of tRNAs and snoRNAs. Nucleic Acids Res. 2005;33:W686–W689. doi: 10.1093/nar/gki366. [DOI] [PMC free article] [PubMed] [Google Scholar]
- Sheppard AE, et al. Transfer of plastid DNA to the nucleus is elevated during male gametogenesis in tobacco. Plant Physiol. 2008;148:328–336. doi: 10.1104/pp.108.119107. [DOI] [PMC free article] [PubMed] [Google Scholar]
- Sheppard AE, Timmis JN. Instability of plastid DNA in the nuclear genome. PLoS Genet. 2009;5:e1000323. doi: 10.1371/journal.pgen.1000323. [DOI] [PMC free article] [PubMed] [Google Scholar]
- Smith DR, Crosby K, Lee RW. Correlation between nuclear plastid DNA abundance and plastid number supports the limited transfer window hypothesis. Genome Biol Evol. 2011;3:365–371. doi: 10.1093/gbe/evr001. [DOI] [PMC free article] [PubMed] [Google Scholar]
- Stewart CN, Jr, Via LE. A rapid CTAB DNA isolation technique useful for RAPD fingerprinting and other PCR applications. Biotechniques. 1993;14:748–750. [PubMed] [Google Scholar]
- Tamura K, et al. MEGA5: molecular evolutionary genetics analysis using maximum likelihood, evolutionary distance, and maximum parsimony methods. Mol Biol Evol. 2011;28:2731–2739. doi: 10.1093/molbev/msr121. [DOI] [PMC free article] [PubMed] [Google Scholar]
- Temnykh S, et al. Computational and experimental analysis of microsatellites in rice (Oryza sativa L.): frequency, length variation, transposon associations, and genetic marker potential. Genome Res. 2001;11:1441–1452. doi: 10.1101/gr.184001. [DOI] [PMC free article] [PubMed] [Google Scholar]
- Timmis JN, Ayliffe MA, Huang CY, Martin W. Endosymbiotic gene transfer: organelle genomes forge eukaryotic chromosomes. Nat Rev Genet. 2004;5:123–135. doi: 10.1038/nrg1271. [DOI] [PubMed] [Google Scholar]
- Timmis JN, Scott NS. Sequence homology between spinach nuclear and chloroplast genomes. Nature. 1983;305:65–67. [Google Scholar]
- Tsumura Y, Suyama Y, Yoshimura K. Chloroplast DNA inversion polymorphism in populations of Abies and Tsuga. Mol Biol Evol. 2000;17:1302–1312. doi: 10.1093/oxfordjournals.molbev.a026414. [DOI] [PubMed] [Google Scholar]
- Wang D, et al. Transfer of chloroplast genomic DNA to mitochondrial genome occurred at least 300 MYA. Mol Biol Evol. 2007;24:2040–2048. doi: 10.1093/molbev/msm133. [DOI] [PubMed] [Google Scholar]
- Wang XQ, Ran JH. Evolution and biogeography of gymnosperms. Mol Phylogenet Evol. 2014;75C:24–40. doi: 10.1016/j.ympev.2014.02.005. [DOI] [PubMed] [Google Scholar]
- Wicke S, Schneeweiss GM, dePamphilis CW, Müller KF, Quandt D. The evolution of the plastid chromosome in land plants: gene content, gene order, gene function. Plant Mol Biol. 2011;76:273–297. doi: 10.1007/s11103-011-9762-4. [DOI] [PMC free article] [PubMed] [Google Scholar]
- Wolfe KH, Li WH, Sharp PM. Rates of nucleotide substitution vary greatly among plant mitochondrial, chloroplast, and nuclear DNAs. Proc Natl Acad Sci U S A. 1987;84:9054–9058. doi: 10.1073/pnas.84.24.9054. [DOI] [PMC free article] [PubMed] [Google Scholar]
- Wyman SK, Jansen RK, Boore JL. Automatic annotation of organellar genomes with DOGMA. Bioinformatics. 2004;20:3252–3255. doi: 10.1093/bioinformatics/bth352. [DOI] [PubMed] [Google Scholar]
- Wu CS, Chaw SM. Highly rearranged and size-variable chloroplast genomes in conifers II clade (cupressophytes): evolution towards shorter intergenic spacers. Plant Biotechnol J. 2014;12:344–353. doi: 10.1111/pbi.12141. [DOI] [PubMed] [Google Scholar]
- Wu CS, Lin CP, Hsu CY, Wang RJ, Chaw SM. Comparative chloroplast genomes of Pinaceae: insights into the mechanism of diversified genomic organizations. Genome Biol Evol. 2011;3:309–319. doi: 10.1093/gbe/evr026. [DOI] [PMC free article] [PubMed] [Google Scholar]
- Yi X, Gao L, Wang B, Su YJ, Wang T. The complete chloroplast genome sequence of Cephalotaxus oliveri (Cephalotaxaceae): evolutionary comparison of Cephalotaxus chloroplast DNAs and insights into the loss of inverted repeat copies in gymnosperms. Genome Biol Evol. 2013;5:688–698. doi: 10.1093/gbe/evt042. [DOI] [PMC free article] [PubMed] [Google Scholar]
- Yoshida T, Furihata HY, Kawabe A. Patterns of genomic integration of nuclear chloroplast DNA fragments in plant species. DNA Res. 2014;21:127–140. doi: 10.1093/dnares/dst045. [DOI] [PMC free article] [PubMed] [Google Scholar]
- Zhang Y, et al. The complete chloroplast genome sequence of Taxus chinensis var. mairei (Taxaceae): loss of an inverted repeat region and comparative analysis with related species. Gene. 2014;540:201–209. doi: 10.1016/j.gene.2014.02.037. [DOI] [PubMed] [Google Scholar]
Associated Data
This section collects any data citations, data availability statements, or supplementary materials included in this article.