


Abstract
DNaseI footprinting is an established assay for identifying transcription factor (TF)–DNA interactions with single base pair resolution. High-throughput DNase-seq assays have recently been used to detect in vivo DNase footprints across the genome. Multiple computational approaches have been developed to identify DNase-seq footprints as predictors of TF binding. However, recent studies have pointed to a substantial cleavage bias of DNase and its negative impact on predictive performance of footprinting. To assess the potential for using DNase-seq to identify individual binding sites, we performed DNase-seq on deproteinized genomic DNA and determined sequence cleavage bias. This allowed us to build bias corrected and TF-specific footprint models. The predictive performance of these models demonstrated that predicted footprints corresponded to high-confidence TF–DNA interactions. DNase-seq footprints were absent under a fraction of ChIP-seq peaks, which we show to be indicative of weaker binding, indirect TF–DNA interactions or possible ChIP artifacts. The modeling approach was also able to detect variation in the consensus motifs that TFs bind to. Finally, cell type specific footprints were detected within DNase hypersensitive sites that are present in multiple cell types, further supporting that footprints can identify changes in TF binding that are not detectable using other strategies.
INTRODUCTION
The identification and characterization of eukaryotic transcriptional regulatory regions to understand complex gene expression patterns has long been hampered by large genome sizes and regulatory elements that can act over large distances. The recent integration of high-throughput experimental and computational approaches has made it possible to characterize functionally important regions via the identification of chromatin states using a variety of histone modifications (1,2).
A complementary and unbiased approach to identify candidate regulatory regions has been the mapping of accessible chromatin by DNase-seq, which identifies DNase hypersensitive (DHS) sites across the genome. DHS sites typically span a few hundred bases and have been shown to overlap all types of known regulatory elements, including promoters, enhancers, insulators, locus control regions, active histone modifications and the majority of transcription factor binding sites (TFBSs) (3–7). The reduction of the entire genome to a set of small putatively functional DHS sites has enabled computational approaches that decode condition-specific expression patterns, for instance by building models that can distinguish the expression of genes based on the sequence features in nearby regulatory regions (8–10).
A wealth of genome-wide association evidence supports the notion that these noncoding regions of the genome are relevant to disease risk (11–14). Elucidating the mechanism of these diseases will require formal understanding of how noncoding sequence variation impacts gene expression levels. To accomplish this goal, it is necessary to know the exact location of where regulatory interactions occur at base-pair resolution, such as binding of transcription factors (TFs) to specific DNA elements. For decades, DNase footprinting—the identification of regions of local DNA protection from DNase cleavage—has been the method of choice to identify TFBS. However, this method is laborious and only focuses on a single small region of the genome (15). With sufficient sequencing coverage now available, DNase-seq has the potential to pinpoint DNase footprints all across the genome by locating relative depletion of DNase-seq signal at a candidate-binding site compared to the flanking DNA. Depending on the precise interaction of a TF with its cognate-binding site, footprints for different factors differ from each other and display distinct cleavage profiles (8,16). This observation raises the possibility of learning TF-specific footprint models through intersection of ChIP and DNase data from the same cellular state, and using these data to predict binding sites for these TFs in other cell types and conditions where only DNase-seq data have been collected.
This application of DNase-seq has spurred a number of studies for predicting functional TFBS from three directions, which make different assumptions but are often not clearly distinguished. The simplest method assesses only the number of DNase-seq reads that surround a candidate-binding site (17). While robust, this method does not reflect the footprint shape and specific DNase-seq cleavage profiles around the binding site. A second strategy uses a variety of approaches to model and identify footprints (18–21). These de novo approaches generally assume that all TF-binding events lead to similar generic footprint shapes, and do not generally require knowledge of the sequence specificity for each TF. A third method integrates DNase signal strength and shape with conservation and other sequence features, all within a relatively large window size (200 bp), to identify footprints via a hierarchical mixture model (16). While this method utilizes DNase footprint shape, its predictions are also driven by other features such as general chromatin accessibility across the entire window and sequence conservation.
One factor that complicates the use of DNase to reliably detect footprints is its sequence cleavage bias, which was originally described over 30 years ago (22) and has been recently revisited in the context of genome-wide studies (23–25). Here, we describe a method that solely models DNase footprint shape in a high resolution, TF-specific manner. Focusing on a small window (50 bp) surrounding candidate-binding sites, this method simultaneously accounts for DNase sequence cleavage bias to distinguish true footprints from background effects. Together, this allows us to identify high-confidence TFBSs at high resolution. Further, we demonstrate advantages of footprinting in addition to chromatin immunoprecipitation on untangling direct and indirect binding and pinpointing TFBS at single-nucleotide resolution.
MATERIALS AND METHODS
Scanning the genome for candidate-binding sites
To identify candidate-binding locations of TFs, we scan the human genome (hg19 assembly) using position weight matrices (PWMs). PWMs model the occurrence frequency of each base pair independently within a TFBS, with a typical size of ∼10 nucleotides for a eukaryotic TF. To eliminate zero entries in PWMs, we add pseudo counts (0.0005) to each entry in the PWM. We slide a window of the size of each PWM across the genome and measure the similarity of each window to the TF-binding motif using PWM log-likelihood scoring (26), calculating the log likelihood ratio of that nucleotide being generated by the PWM as opposed to a background frequency model. In this scoring scheme, we call windows that are assigned a positive score as ‘sequence motif matches.’ For the background frequency model, we use a first order Markov model that is estimated from a 500-bp window centered at the currently considered window. Compared to a fixed zero-order background model for whole human genome, the local background model allows us to more realistically account for nucleotide fluctuations across genomic domains, and accounts for higher order nucleotide dependencies such as CpG islands (27).
We use a set sequence motif matches with high scores to identify an initial set of candidate-binding sites that will be classified as bound versus unbound by the footprint models. To start from a consistent number across all TFs, we used the 50 000 top-scoring candidate-binding sites for each PWM to build the initial stringent set, instead of using a numeric threshold on PWM scores, which typically results in different number of candidate-binding sites for each TF (16). To ensure that the initial stringent candidate sets contained meaningful and significant sequence matches, we sampled log-likelihood scores from both genomic background model and PWM model. Using this approach, we noted that PWM score threshold consistently corresponded to P values less than 10−4 across all factors (Supplementary Table S1). We also built a set of relaxed set of sequence motif matches at TF-specific, typically less stringent thresholds, using the same sampling approach. For the relaxed threshold, we used a PWM score threshold that corresponds to P values of 10−2.
For protein binding microarray (PBM) based candidate-binding site discovery, we utilized E2F1 universal PBM data. We scanned the genome for two consecutive 8-mers that both have an E-score of 0.4 or higher (28–30). This approach was used to scan for E2F1 sequence motifs in E2F1 ChIP-seq peaks for experiments conducted in the MCF7 cell line.
DNase-seq assay and sequence bias of DNase
To quantify the DNase I sequence-dependent cleavage bias, we performed DNase-seq experiments using deproteinized DNA from K562 and MCF7 cell lines. K562 or MCF7 cells were cultured in Roswell Park Memorial Institute (RPMI-1640) or Dulbecco's modified Eagle's media (DMEM) + 10% fetal bovine serum (FBS), respectively. Deproteinized genomic DNA was isolated from ∼20 million cells using a DNeasy Blood and Tissue kit (Qiagen). Isolated total DNA was then subjected to two phenol-chloroform extractions followed by ethanol precipitation to ensure removal of bound protein. DNase-seq experiments were performed essentially as previously described (31) with the following modifications: DNase I digestions were performed in 120-μl solution with ∼50 μg of deproteinized DNA. DNase digestions were stopped by addition of 50-mM ethylene diamine tetraacetic acid (EDTA) and 15-min incubation at 75°C. Digestions performed with 1.2 and 2.4 U total DNase I were selected based on 0.8% agarose gel sizing to be similar to typical DNase-seq assay digestions and pooled for the two cell lines separately. Libraries were constructed from pooled digests as described and sequenced on the Illumina HiSeq2000 platform with 50-bp single-end reads at the Duke Sequencing and Analysis Core Resource. This protocol generates essentially fixed-length 20 bp insert fragments due to MmeI cleavage of DNA 20 bp from the MmeI recognition site included in the first ligated linker. Therefore, the first 20 bp of reads were aligned against hg19 assembly using Burrows–Wheeler aligner, allowing up to two mismatches and multireads mapping up to four locations. Aligned reads were further processed through a pipeline to remove potential PCR artifacts to match standard DNase-seq analysis previously applied to all Duke generated DNase-seq libraries and as described previously in (4,31). This resulted in approximately 140 million mapped reads per cell line.
After sequencing tags were aligned, we counted the number of DNA 6-mers centered at each DNase cleavage site (between the third and fourth base pair) and calculated the relative frequency of each 6-mer. These relative frequencies are normalized by the relative frequency of each 6-mer in the human genome and genomic relative frequencies are corrected for regions that are mappable using our DNase-seq protocol. This ratio is called cleavage propensity of the 6-mer. As there is no chromatin structure or TF-binding events in such deproteinized cell lines, any deviation from one indicates an increased or decreased propensity of DNaseI cleavage for a 6-mer.
We use cleavage propensity values to generate the background signal profile around a set of motif matches that would solely result from DNase sequence bias. More specifically, DNase-seq signal at each base pair is estimated as cleavage propensity of the 6-mer centered at the current position (i.e. corresponding to the fourth base of the 6-mer). For a set of sequence motif matches, we first obtain the DNA sequence surrounding each sequence motif match. We estimate the aggregate sequence bias background signal around that set of motif matches by iterating over each base pair and each sequence motif match.
Identification of DHS sites
The single-cut DNase-seq protocol used here yields data at base-pair resolution by virtue of direct ligation of the first sequencing linker to cleaved, blunt ended DNA fragments. Mapping sequencing tags to the genome leads to discrete numbers of DNase cleavage events within the library at each position in the genome. To identify DHS sites that display an enrichment of DNase cleavage, we use the F-seq peak calling algorithm (32).
Aggregate DNase-seq profiles
Aggregate DNase-seq plots centered around set of genomic loci are obtained by summing the number of DNase-seq tags at each position over each loci. Generally each loci is a region around sequence motif match and these plots are centered around sequence motif with a fixed window size, showing the total number of DNase-seq reads that mapped to each position relative to sequence motif.
For clustering, we use DNase-seq read profiles in a window (± 25 nt) around positions of interest. In the case of candidate TFBSs, where M is the length of the motif, these 50 + M long integer vectors make up a 50 + M by N matrix, where N is the number of candidate TFBSs. These vectors are clustered using K-means algorithm, with Pearson correlation as distance metric. Pearson correlation was used instead of Euclidian distance since DNase-seq coverage differs between different regions of the genome. The ‘Kmeans’ function from the R package ‘amap’ was used for this analysis. A similar analysis was previously performed for analyzing androgen receptor DNase footprints (33).
Modeling of DNase-seq footprints
DNase-I footprints reflect the propensity of a DNase cleavage at each position at and around the TFBS; with low probability of DNase cleavage at the binding site due to protection of TF and a high probability of cleavage surrounding the binding site. To capture different positional propensity of cleavage due to TF–DNA interaction, we modeled the relative probability of a DNase cleavage at each position using a TF-specific multinomial distribution. For training and testing our models, we used ENCODE Duke DNase-seq data from GM12878 cell type (34).
Any given candidate TFBS identified by a PWM match may be bound or unbound in the particular condition for which we have data. At bound locations, we assume to observe a footprint; unbound locations should not resemble the footprint and are therefore represented by a background model, which is also modeled by a multinomial distribution.
While many motif matches in ChIP-seq peaks are enriched for footprints, some resemble the background component. DNase-seq signal around remaining motif matches that are not in ChIP-seq peaks follow the opposite trend, being enriched for background component. Since motif matches are made of a mixture of footprint and background, we used a multinomial mixture model to learn both models simultaneously. Even with ChIP data as a starting point, a mixture model is able to correctly assign motif matches in ChIP-seq peaks that do not have a footprint-like signal to the background, while estimating the parameters of footprint model, allowing us to arrive at a cleaner footprint model. Representing the DNase-seq signal in an M base pair wide window around a motif match as sample X, then
 |
For a two-component mixture model, with λ representing the mixing weights, and θfp and θbg are the parameters of footprint and background multinomials. We estimate mixing weights and parameters of background and footprint multinomials using the Expectation Maximization algorithm. To initialize θfp, we calculate maximum likelihood estimates from aggregate DNase-seq counts around motif matches in ChIP-seq peaks for multinomial model. For θbg, we either set the parameters as the maximum likelihood estimates from the 6-mer DNase sequence bias cleavage frequencies, or allow it to be estimated de novo.
We used a two component mixture to learn θfp while θbg was fixed at maximum likelihood estimate from deproteinized naked DNA DNase-seq profile. To learn the de novo background profile, we used a three component mixture because EM has a tendency to fit two symmetric footprints in a two component mixture. In the three component mixture, two components that make up the footprint were combined together to learn the final footprint model. The combined footprint model is obtained by calculating the weighted average of two footprint models, using mixture weights. Background component is chosen automatically as the component with most mass at the sequence motif since footprint models have less mass at sequence motif.
For assessing the accuracy of footprint model as a predictive model of TF binding, we use a 4-fold cross-validation scheme. After footprint and background parameters are trained, we calculate a footprint log-likelihood ratio (FLR) for each motif match in our test set;
 |
FLR measures how similar DNase-seq signal around each motif match to footprint model. As the resolution of ChIP-seq does not allow resolving closely spaced motif matches, we use the highest FLR value of all the motif matches (both stringent and relaxed sets) within a ChIP-seq peak. For this task, we used ENCODE uniform pipeline set of blacklist filtered ChIP-seq peaks called by SPP peak caller (35,36) available at (http://www.broadinstitute.org/∼anshul/projects/encode/rawdata/peaks_spp/mar2012/distinct/idrOptimalBlackListFilt/). For ChIP-seq peak enrichment values, we used the signal enrichment value reported by the peak caller.
To allow for a fair comparison, we follow the same evaluation for the D-s score. Following (17), we assess accuracy using two metrics: the area under the receiver operating characteristic curve (auROC) and the sensitivity at 1% false positive rate. We built footprint models for 21 different TFs for which ChIP data and PWMs were already available for Tier 1 ENCODE cell types (Supplementary Table S2). For comparison of FLR and D-s score distributions from different cell types, we used subsamples with equal number of DNase-seq reads for a fair comparison.
An R implementation of our model is available at http://ohlerlab.mdc-berlin.de/software.
Discovery of cobinding elements
For each TF with a footprint model, potential cobinding factors were identified by querying for overlapping ChIP-seq peaks of other DNA binding proteins, such as RNA Polymerase II and P300. A set of ENCODE uniform pipeline processed ChIP-seq peaks were utilized for this analysis. Two ChIP-seq peaks are overlapping if the intersection of two ChIP-seq peaks is at least 1bp long. For each TF, we assigned a footprint score to each ChIP-seq peak of that TF, as defined by the maximum of FLR value of all sequence motif matches under the peak.
For each TF in the set of 21 TFs that have footprint models, ChIP-seq peaks that contain a stringent sequence motif match are sorted according to FLR and overlapping ChIP-seq peaks of all other DNA-binding proteins (i.e. we call this set of proteins associated binders) are identified. To discover if overlapping ChIP-seq peaks of other factors are enriched at peaks with large FLR values (peaks with a DNase-seq footprint) or small FLR values (peaks without a DNase-seq footprint), we used two-sample Kolmogorov–Smirnoff (K–S) test. Specifically, we calculate the significance of the hypothesis that the distribution of FLR scores of ChIP-seq peaks is significantly different from the distribution of FLR scores of ChIP-seq peaks that only overlap with peaks of another associated binder. One-sided tests are performed to discover binders that associate with footprint enriched peaks versus footprint depleted peaks. Binders that associate with footprint enriched and depleted peaks are called direct and indirect associations, respectively.
Data
All DNase-seq datasets have been deposited in Gene Expression Omnibus under accession numbers GSE32970. Deproteinized DNase-seq is available under accession number GSE61105 and universal PBM dataset is available under accession number GSE61854.
RESULTS
At least four different scenarios arise when searching for bona fide DNase footprints at candidate TF-binding sites, which we define as DNA sequences that match the sequence preferences of a specific TF (i.e. a sequence motif match). We provide examples of these scenarios using NRSF ChIP-seq and DNase-seq data from the GM12878 lymphoblastoid cell line (37,38). First, true positives are sequence motif matches that overlap both a DNase footprint and a ChIP-seq peak for a TF associated with the sequence motif. These are highly likely to represent direct binding sites (Figure 1A). Second, true negatives are sequence motif matches without a DNase-seq footprint that do not map in a ChIP-seq peak (Figure 1B). Third, ChIP may not have the resolution to tell apart which one of two sequence motif matches is indeed bound, but this may be resolved by the presence of a footprint (Figure 1C). Fourth, sequence motif matches that overlap ChIP-seq peaks but do not exhibit a DNase-seq footprint (Figure 1D) may represent weak or indirect binding of TFs, long-range chromatin looping (39) or simply artifacts due to false-positive ChIP-seq peak calls (40,41). Together, these scenarios illustrate the challenges of identifying footprints and the motivation behind our modeling approach.
Figure 1.
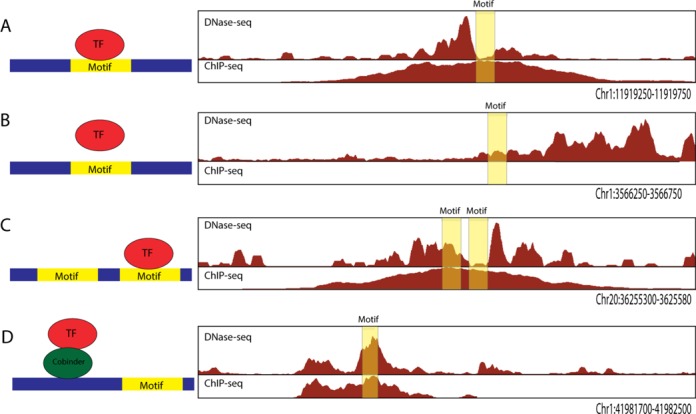
Scenarios relevant to identifying DNase footprints. On the right, representative examples of DNase-seq data from GM12878 cell type and ChIP-seq data for NRSF from ENCODE (34). The location of sequence motif match for the TF NRSF is indicated with a yellow box. On the left, a schematic representation of TF–DNA interaction is shown and whether a footprint is detected or not detected at the motif match. (A) A DNase footprint centered at the motif maps within a ChIP-seq peak indicating a direct binding event. (B) A motif that maps within a DHS site, but has no appreciable ChIP-seq signal, nor footprint, indicating no interaction between TF and sequence motif match. (C) Multiple sequence motif matches within a DHS site may only have a single footprint, showing that TF may be more likely to interact with one of the motif matches. (D) ChIP-seq peak with a sequence motif match that does not have a footprint suggests a possible indirect binding event.
ChIP-seq sites display a heterogeneous mixture of DNase digestion profiles
To show that DNase-seq generates unique digestion profiles that are TF-specific, we generated aggregate DNase-seq profiles by summing DNase signal centered on sequence motif matches within ChIP-seq peaks. This is exemplified by three well-studied TFs, including CCCTC binding factor (CTCF) - (Figure 2A), STAF (Figure 2B) and NRF1 (Figure 2C). Unexpectedly, we observed that a simple unsupervised k-means clustering of these aggregate DNase-seq profiles leads to two distinct aggregate DNase-seq profiles: one with an obvious peak/trough/peak footprint shape, and a second more flattened signal that retains a distinct shape in the absence of a footprint (Figure 2D). This indicates that while each TF has its own distinct DNase footprint shape visible in aggregate plots, aggregate plots are a mixture of footprint digestion profiles and a background digestion profiles.
Figure 2.
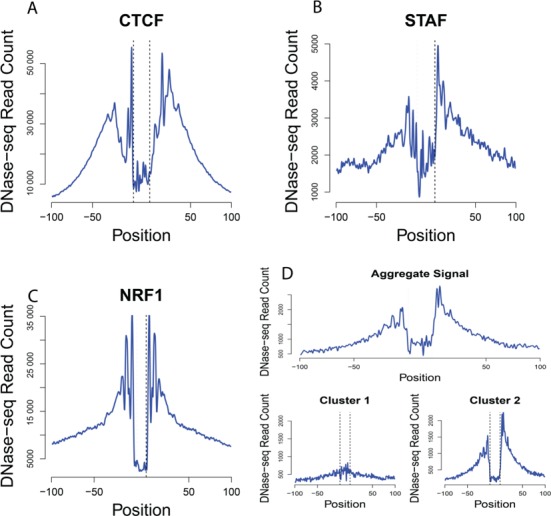
Aggregate DNase plots identify distinct TF-binding profiles. Aggregate DNase-seq signal was calculated for motifs that map within ChIP-seq peaks for (A) CTCF, (B) STAF (ZNF143) and (C) NRF1. Note that each TF displays variation of general footprint shapes, indicating that footprint detection requires a TF-specific approach. (D) Top panel shows aggregate DNase-seq signal centered on REST motif matches that map within REST ChIP-seq peaks. K-means clustering of the REST aggregate plot (top) identifies two types of DNase aggregate profiles (bottom). Cluster 1 identifies subset of REST-binding sites that does not display depletion of DNase signal, while Cluster 2 represents REST-binding sites with depletion of DNase-seq signal.
Sequence bias of DNase-seq is protocol specific
We hypothesized that background profile observed in the k-means clustering reflected recently reported intrinsic cleavage biases of DNase I (23,25), which may affect a portion of the DNase-seq aggregate profiles (24). To accurately separate footprint profile from background bias profile, we measured the intrinsic sequence cleavage bias of DNaseI by performing DNase-seq (Song and Crawford, 2010) on deproteinized genomic DNA from K562 and MCF7 cells, and calculated cleavage propensity values for all possible DNA 6-mers. Cleavage propensity values represent any positive or negative cleavage bias of DNase I, compared to what would be expected from the prevalence of each 6-mer across the genome. These cleavage propensities ranged over two orders of magnitude and were highly reproducible between genomic DNA isolated from the two cell lines (0.99 Spearman correlation), ruling out possible cell type specific biases such as different DNA methylation patterns (Figure 3A). We also estimated cleavage propensities on a published DNase-seq data set generated from deproteinized IMR90 cell genomic DNA (23) that used an alternative DNase-seq protocol (19,42). We observed that the 6-mer cleavage propensities between DNase-seq protocols were far less correlated (Figure 3B, 0.75 Spearman correlation), suggesting that the two protocols each display significant differences in sequence bias (25). Therefore, accurately modeling footprints using different DNase-seq protocols will likely require using protocol-specific deproteinized DNase-seq datasets. For this study, we limited the modeling and analysis to data that use the single cut, high molecular weight DNase-seq protocol (31).
Figure 3.
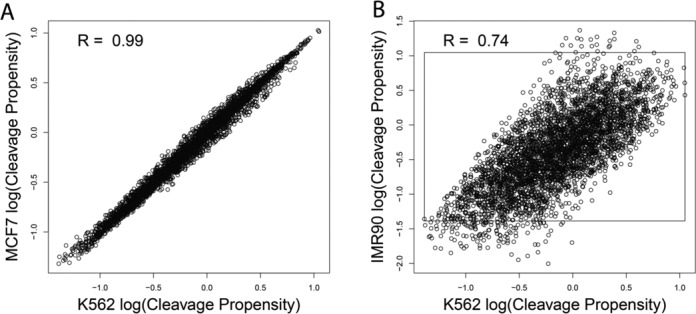
DNase-seq displays cleavage bias that is protocol specific. (A) Scatter plot of cleavage propensities of all possible DNA 6-mers (log10 scale) for deproteinized genomic DNA from MCF7 and K562 cell lines using the single hit high molecular weight DNase-seq protocol (31). (B) Scatter plot comparing cleavage propensities of 6mers from deproteinized genomic DNA from K562 using the single hit DNase-seq protocol versus deproteinized genomic DNA from IMR90 cell line using an independent two hit small molecular weight DNase-seq protocol (42). The inset box represents maximum and minimum cleavage propensity values for single hit DNase-seq protocol performed on K562 cell line. Spearman correlation is indicated in each plot.
DNase footprints are an aggregation of a footprint and background profiles
The observations described thus far motivated us to develop TF-specific footprint models to assess the predictive accuracy of DNase-seq footprinting alone. These models also take DNase cleavage bias into account. Specifically, this method would not include additional chromatin accessibility or genomic features that may indicate the general presence of a regulatory region (Figure 4). Following the footprint modeling strategy used in earlier approaches such as CENTIPEDE (16), our models sought to reflect the relative propensity of DNase-I cleavage at each position around sequence motif matches using factor-specific multinomial distributions. In addition, to accurately quantify the extent of DNase sequence bias, we incorporated a separate nonuniform background model that accounts for variability in signal profiles in the absence of functional footprints at candidate binding sites. This intrinsic sequence bias background model is estimated from the DNase-seq profile that would result from the selected DNA sequences alone, i.e. the relative cleavage propensity of each 6-mer surrounding the sequence motif matches (Figure 3A).
Figure 4.
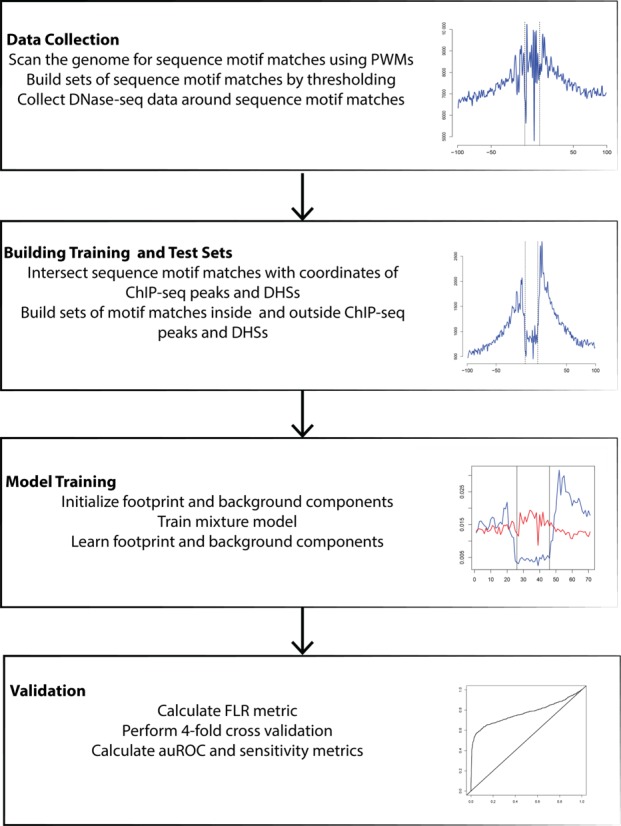
Workflow of binary classification scheme.
To train these models, we used expectation-maximization (EM), which is an unsupervised training algorithm for mixture modeling. As Figure 1A and D illustrate, ChIP-seq data do not distinguish between true- and false-positives, or in other words, direct from indirect binding. We therefore used ChIP-seq data to initialize the true positive motif set, but allow the model to reassign motifs to the background should they display evidence of being derived from cleavage bias. This approach ensures that bound sequence motif matches that follow the background DNase profile were excluded from training of the footprint model, leading to a cleaner footprint model.
Importantly, to avoid conflating the DNase-seq signal in the larger genomic region with the one at an individual site, we use a relatively small window (± 25 bp) around the motif match. This is a more targeted approach compared to previous approaches that opted for a 200 bp or larger window (16,17). We expect the smaller window to better exclude influences from neighboring footprints from the same or different TFs.
DNase footprints predict direct binding events with high sensitivity
To assess the performance of using footprint models alone to predict TF binding at candidate-binding sites, we set up a binary classification scheme using ChIP-seq data as the gold standard (Figure 4). To discover candidate binding sites (sequence motif matches), we scanned the human genome (hg19) using 21 PWMs from the JASPAR and TRANSFAC databases (Supplementary Table S2). These PWMs were largely chosen based on their availability of ChIP-seq data from more than one cell type. Following model training with EM algorithm, each sequence motif match in the test set is assigned a footprint score based on the log-odds ratio of footprint and background components. We call this log-odds ratio the footprint likelihood ratio (FLR). In the case of multiple sequence motif matches within a single ChIP-seq peak (Figure 1C), we assigned the highest FLR value to each of the sequence motif matches.
We next compared the performance of FLR footprinting scores against the simple D-s score of overall DNase hypersensitivity (17), which is defined as the number of DNase-seq reads within a 200-bp window around the sequence motif match. Therefore, the D-s score predicts binding without modeling the footprint. We again used the highest D-s score in cases of multiple sequence motif matches within a single ChIP-seq peak. D-s has been reported to perform as well as CENTIPEDE (17), which predicts whether a sequence motif match is bound by jointly modeling the DNase footprint, overall DNase hypersensitivity with a 200-bp window and other static genomic features such as conservation. We did not compare performance of FLR to CENTIPEDE since CENTIPEDE models multiple features over a larger window and our objective is to quantify the predictive power of DNase-seq footprinting alone. We could not also compare performance against another recent footprint metric (20) because of the unavailability of parts of software implementation. Following previous comparisons (Cuellar-Partida et al. (17)), we evaluated the predictive performance via the auROC and the sensitivity at 1% false-positive rate (FPR) threshold. AuROC assesses how well the classifier separates positives from negatives across different thresholds, whereas the sensitivity at 1% FPR assesses the classifiers’ ability to identify true positives at a relatively low level of false positives.
For most factors, the majority of unbound sequence motif matches map outside DHS sites. By definition, D-s score separates sequence motif matches within DHS sites from those that fall outside of DHS sites. Thus, as anticipated, D-s outperformed our pure footprint model in terms of auROC and sensitivity when we consider all genome wide sequence motif matches (Supplementary Figure S1). Due to the generally low coverage of DNase-seq signal outside DHS sites, FLR cannot perform well since this model requires DNase-seq coverage at multiple positions in a four times narrower window (50 versus 200 bp) without aggregating the signal. Limiting the classification of sequence motif matches to those occurring only within DHS sites, the two approaches perform comparably, with D-s score still outperforming FLR in auROC (Figure 5A), but FLR outperforming D-s in terms of sensitivity at 1% FPR (Figure 5B). Thus, while D-s is reliable in generally distinguishing bound from unbound sequence motif matches, there is a subset of bound sequence motif matches exhibiting strong DNase footprints that lead to higher sensitivity at 1% FPR using the FLR.
Figure 5.
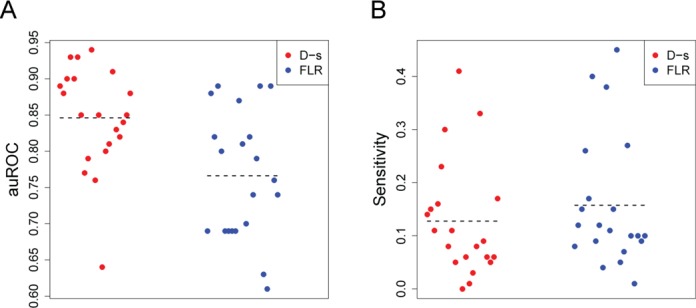
Comparison of FLR to general D-s score. Motif matches for 21 TFs that map within DHS sites were compared to ChIP-seq data to calculate (A) auROC and (B) sensitivity at 1% false-positive rate for FLR and D-s scores. Each TF is indicated as a circle, dashed lines represent the means.
Predictive performance of FLR and D-s score varied between the 21 TFs, and between different transcriptional factor families (Table 1). For instance, some of the best scoring FLR footprints belonged to zinc finger family members (e.g., CTCF, NRSF, NRF1), which are typically characterized by unique sequence preferences corresponding to high information content PWMs. In contrast, other factors that are part of the basic helix–loop–helix TF family (e.g. Max, C-Myc) tend to bind variations of a core motif such as the E box. Therefore, learning specific footprints for members of such families is more difficult since scanning the genome with a PWM that corresponds to one family member inevitably introduces matches to other family members, confounding the model. Another challenge for high resolution motif based footprint models is that the sequence motif for certain TFs may not be correct. For E2F1, a TF that binds to a motif very similar to E2F4, scanning the genome with 8-mers from PBM experiments yields an aggregate DNase-seq plot with much deeper trough compared to the PWM scan (Supplementary Figure S2). This demonstrates that 8-mers from PBM experiments are better suited to discover candidate-binding sites for some TFs, and further illustrates that accurate footprinting can be dependent on the class of TF and the accuracy of the known sequence motif.
Table 1. auROC and Sensitivity at 1% FPR values for D-s and FLR for each TF.
| AUC | Sensitivity at 1% FPR | |||||||||
|---|---|---|---|---|---|---|---|---|---|---|
| Whole genome | DHS | Whole genome | DHS | |||||||
| TF | Negative | Positive | D-s | FLR | D-s | FLR | D-s | FLR | D-s | FLR |
| E2F4 | 49 532 | 468 | 0.99 | 0.68 | 0.89 | 0.69 | 0.72 | 0.45 | 0.14 | 0.08 |
| NFY-A | 48 565 | 1435 | 0.99 | 0.95 | 0.88 | 0.88 | 0.63 | 0.72 | 0.15 | 0.12 |
| NFY-B | 46 397 | 3603 | 0.98 | 0.86 | 0.9 | 0.82 | 0.77 | 0.67 | 0.11 | 0.15 |
| NRF1 | 46 282 | 3718 | 0.99 | 0.9 | 0.93 | 0.89 | 0.8 | 0.85 | 0.16 | 0.26 |
| RFX5 | 49 811 | 189 | 0.98 | 0.81 | 0.9 | 0.8 | 0.77 | 0.64 | 0.23 | 0.17 |
| ZNF143 | 49 130 | 870 | 0.99 | 0.63 | 0.93 | 0.69 | 0.9 | 0.53 | 0.3 | 0.4 |
| BHLHE40 | 47 651 | 2349 | 0.97 | 0.7 | 0.85 | 0.69 | 0.64 | 0.43 | 0.08 | 0.09 |
| USF1 | 49 585 | 415 | 0.97 | 0.7 | 0.77 | 0.69 | 0.59 | 0.35 | 0.11 | 0.12 |
| USF2 | 49 724 | 276 | 0.96 | 0.73 | 0.79 | 0.69 | 0.59 | 0.35 | 0.05 | 0.04 |
| YY1 | 47 905 | 2095 | 0.99 | 0.87 | 0.94 | 0.87 | 0.85 | 0.62 | 0.41 | 0.38 |
| CTCF | 29 570 | 20 430 | 0.95 | 0.73 | 0.76 | 0.81 | 0.38 | 0.5 | 0 | 0.11 |
| MEF2A | 48 823 | 1177 | 0.97 | 0.73 | 0.85 | 0.7 | 0.56 | 0.37 | 0.06 | 0.15 |
| NRSF | 47 566 | 2434 | 0.81 | 0.69 | 0.64 | 0.82 | 0.11 | 0.32 | 0.01 | 0.45 |
| PAX5 | 49 401 | 599 | 0.94 | 0.76 | 0.8 | 0.74 | 0.46 | 0.37 | 0.03 | 0.05 |
| PU1 | 48 731 | 1269 | 0.94 | 0.82 | 0.81 | 0.79 | 0.41 | 0.38 | 0.08 | 0.07 |
| SP1 | 49 678 | 322 | 1 | 0.9 | 0.91 | 0.89 | 0.89 | 0.74 | 0.33 | 0.27 |
| SRF | 49 134 | 866 | 0.94 | 0.61 | 0.83 | 0.63 | 0.53 | 0.28 | 0.09 | 0.1 |
| TCF3 | 49 749 | 251 | 0.99 | 0.65 | 0.82 | 0.61 | 0.67 | 0.36 | 0.06 | 0.01 |
| ZEB1 | 49 960 | 40 | 1 | 0.99 | 0.84 | 0.89 | 0.92 | 0.82 | 0.05 | 0.1 |
| C-MYC | 49 668 | 332 | 0.99 | 0.82 | 0.85 | 0.76 | 0.69 | 0.52 | 0.06 | 0.09 |
| MAX | 49 317 | 683 | 0.99 | 0.76 | 0.88 | 0.74 | 0.79 | 0.53 | 0.17 | 0.1 |
ChIP-seq peaks without a DNase footprint suggests weak or indirect binding
The success of footprinting methods will clearly depend on the amount of data available to detect local DNase patterns. This trend is illustrated in a tripartite structure of the auROC curves (Supplementary Figure S3). After a quick rise in true positives for high FLR scores, the performance quickly flattens out; indicating that for a considerable subset of candidate sites there is not sufficient data to make a clear call as to whether a footprint is detected. As evidenced by the sudden rise of true positive rate at high false-positive rates, the FLR mixture models identify a third subset of ChIP-seq peaks that do not exhibit a DNase footprint, even though they map within a DHS site.
To ensure sequence bias was not a driving factor for this distribution of scores, we ranked sequence motif matches according to FLR and estimated the DNase-seq signal that would result purely from DNase sequence bias using cleavage propensity values. Estimated signal was similar for upper and lower quintiles of FLR ranked sequence motif matches, showing that the footprint profile is not caused by sequence bias itself (Supplementary Figure S4).
We investigated possible reasons for the lack of footprints at sequence motif matches that are ChIP-seq positive. For this analysis we adopted a ChIP-seq peak-centric rather than motif-centric approach and used the maximum FLR score found within each peak. ChIP-seq peaks without a sequence motif match were excluded from this analysis. For all TFs we analyzed, there is a positive correlation (ranging from 0.07 to 0.54, Spearman) between FLR and ChIP-seq enrichment value. Sorting ChIP-seq peaks according to FLR in descending order shows a consistent decrease of the median ChIP-seq enrichment for all factors (Figure 6A). This trend suggests that direct physical interaction between the TF and candidate binding site is reflected by higher FLR scores within stronger ChIP-seq signals. Absence of the footprint (as measured by lower FLR scores) indicates lack of TF–DNA interaction and the resulting protection from DNase cleavage. Absence of a footprint in ChIP-seq peaks may be explained by indirect binding events (possible recruitment by cobinding partners) or weaker interactions between the TF and the sequence motif match; these explanations are elaborated in the rest of this section.
Figure 6.
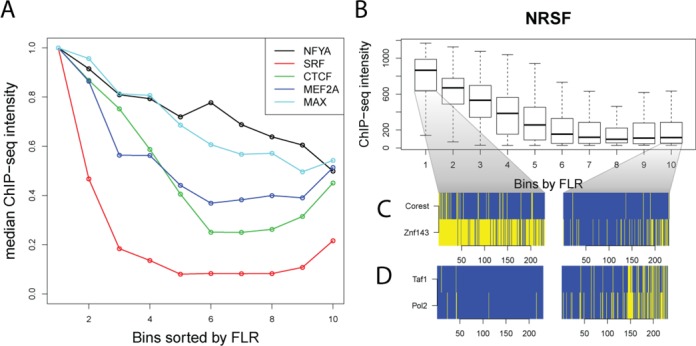
Footprint scores indicate mode of TF interaction. (A) Median ChIP-seq intensity scores of ChIP-seq peaks of five factors, sorted by FLR footprint scores in descending order and divided into 10 bins. The highest FLR scores are in the first bin. Note footprint score correlates with ChIP-seq signal, with the exception of the weakest footprinting scores where they are inversely correlated. (B) Boxplots of NRSF ChIP-seq intensity scores across footprint scores. (C) A heat-map showing overlapping ChIP-seq peaks for the top and bottom 10% highest and lowest footprint scores. CoRest and Znf143 binding is enriched for the strongest NRSF footprints (left) and are depleted in the weakest NRSF footprints (right). (D) Conversely, Taf1 and Pol2 binding is depleted for the strongest NRSF footprints (left), and enriched for the weakest NRSF footprints (right).
To further explore whether high FLR scores indicate direct interactions, whereas low scores are indicative of indirect binding, we compared footprint enriched and depleted ChIP-seq peaks to ChIP-seq data from 83 other DNA-binding proteins. We characterized significant associations with footprint-enriched and -depleted peaks as direct associations and indirect associations, respectively. For example, NRSF ChIP-seq peaks (Figure 6B) enriched with strong NRSF footprints were associated with binding to CoRest (K-S test, P < 1.4e − 12) and Znf143 (P < 5e 71; Figure 6C) occupied sites. CoRest is a known coregulator of NRSF (43). For NRSF ChIP-seq peaks that are depleted for NRSF footprints, a significant association was detected for PolII (P < 1.4e − 20) and TBP associated factor 1 Taf1 (P < 2.9 –15; Figure 6D). We performed a similar analysis for CTCF ChIP-seq peaks that are enriched for strong CTCF footprints, and a significant direct association was detected for YY1 (P < 7e − 171) and ZNF143 (P < 7e − 117). Both YY1 and ZNF143 have been previously documented to bind together with CTCF (44,45). CTCF ChIP-seq peaks that do not contain strong CTCF footprints are also enriched for PolII (P < 1.4e − 7) and Taf1 (P < 1.5e − 7). For CTCF and NRSF, the indirect association with PolII and Taf1 may indicate indirect binding or chromatin looping with the basal promoter machinery that result in a TF-DNA interaction detected by ChIP-seq, but does not leave a footprint. Interestingly, many of these binding sites with the weakest FLR footprint scores have a modest increase in ChIP-seq intensities relative to FLR footprints with stronger scores (Figure 6), indicating that this indirect interaction with the basal machinery is stable. Another possible explanation for this observation are possible ChIP-seq data artifacts; recent studies have reported that regions in the yeast genome going through active transcription are enriched for unrelated TFs, indicating that some ChIP enrichments are due to nonfunctional binding (40,41).
Footprint enriched associations are factor-specific as expected; however we detected significant (threshold P < 5 − e2, Bonferroni correction) indirect associations with P300 for seven factors and Ikzf1 for five factors (Supplementary Table S3). P300 is a well-known transcription co-activator often marking sites with enhancer activity by acting as an acetyl-transferase to increase histone acetylation levels, promote relaxation of local chromatin structure and recruit transcriptional machinery (46,47) whereas Ikzf1 is associated with chromatin remodeling proteins (48). Indirect association with P300 suggests a similar mechanism where active transcription may introduce artifacts into ChIP-seq data, whereas Ikzf1 association indicates we may not be able to detect footprints in regions of active chromatin remodeling.
DNase footprints detect microarchitecture changes in chromatin landscape
The above analyses support that ChIP-seq data likely represents a combination of both direct and indirect binding, which cannot be distinguished using ChIP-seq data alone. While overall DNase hypersensitivity (e.g. measured by D-s) and DNase footprints (e.g. measured by FLR) present themselves as equally good predictors of TF-binding events across the genome (Figure 5), there is a trade-off between the two approaches. Specifically, while D-s is a good indicator of any binding event (either direct or indirect) around the sequence motif match, FLR has the potential to distinguish between indirect and direct binding events. This becomes important in situations where differential TF-binding event does not change the overall chromatin accessibility, but does change chromatin microarchitecture.
To explore this scenario, we used DNase-seq data from different cell types for which it is known that specific TFs are differentially expressed. We first compared DNase-seq data from the medulloblastoma cell line D721 and the lymphoblastoid cell line GM12878. In medulloblastoma cells, the NRSF repressor is not expressed, which results in expression of neuronal genes (49). In GM12878 cells, the presence of NRSF actively represses these genes. We identified NRSF sequence motif matches that mapped within DHS sites that are present in both cell lines. Within these regions, we detected that the NRSF footprint was often only detectable in GM12878 cells at individual loci (Figure 7A), and at all potential NRSF-binding sites (Figure 7B). We computed the overall distribution of FLR and D-s scores for NRSF sequence motif matches that map in DHS sites that are present in both cell types (Figure 7C). When comparing NRSF motif matches between GM12878 and D721 cell types, we only observed a significantly different distribution of FLR scores (K-S test, P < 3.15e − 12) while D-s score differences were not significant (P < 0.4). This indicates that there is a class of regulatory elements (i.e. DHS sites present in multiple cell types) where the D-s statistic is not optimal for accurately identifying differential TF-binding sites.
Figure 7.
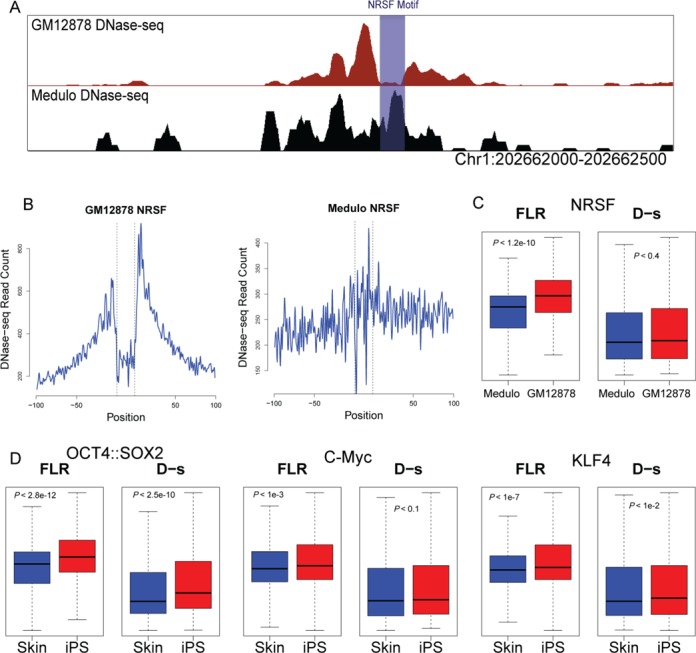
Cell type specific footprints in shared DHS sites. (A) Representative example of DNase-seq data from GM12878 and Medulloblastoma (D721) cell lines. This DHS site is present in both cell types, but a clear footprint for NRSF is only detected in GM12878 at the sequence motif match (B) Aggregate DNase-seq signal around NRSF motifs in GM12878 (left) and medulloblastoma (right) cell lines indicate that NRSF does not leave a footprint in the medulloblastoma cell line. (C) Boxplots showing distribution of FLR and D-s scores in GM12878 and Medulloblastoma cell lines for the NRSF motif in DHS sites that are present in both cell types. Distribution of FLR scores displays a difference between GM12878 and Medulloblastoma, whereas D-s scores displays no difference. (D) Similar boxplots showing distributions of FLR and D-s to identify differential footprint scores between skin fibroblasts and iPSc cells for OCT4, Sox2, C-Myc and KLF4 Yamanaka factors. FLR scores were more sensitive to changes in TF binding between two cell types, reflected by smaller P values indicated in each box and Supplementary Table S4.
To test whether this advantage of FLR was specific to NRSF, we also compared DHS sites from skin fibroblasts that were transformed into induced pluripotent stem cells (iPSCs) by overexpression of Oct4, Sox2, Klf4 and c-Myc Yamanaka factors (50). When we compared the DHS sites that were present in both the iPSC lines and the parental skin fibroblast cell lines, the difference between the two cell types was more significant for FLR footprint scores for each of the four Yamanaka factors than D-s scores (Figure 7D and Supplementary Table S4).
The ability of FLR to distinguish a change in binding events in shared DHS sites therefore appears to be a distinct advantage of FLR over a more general statistic that only captures overall DNase hypersensitivity in a large window around the sequence motif match. In cases where the disappearance of a footprint does not abolish a DHS site, our footprint model can be used to detect subtle but functionally significant changes in the chromatin microarchitecture landscape.
Unsupervised EM training can identify de novo DNase bias
To illustrate the robustness and flexibility of the TF-specific mixture modeling approach, we evaluated how well it would allow us to separate bound from unbound sites, even in the absence of the intrinsic sequence bias detected using the deproteinized naked DNA DNase-seq data, using unsupervised EM training of mixture components. Rather than using two mixture components for a footprint and background, we often observed that the EM algorithm frequently split the foreground footprint signal into two separate footprints, one with a stronger DNase-seq signal upstream of the motif and another with stronger DNase-seq signal downstream of the motif (Supplementary Figure S5). In these cases, we combined the two separate de novo foreground footprint components, and learned a distinct de novo background model from the third component (as explained in materials and methods section).
We next compared both de novo foreground footprint and background model components to the previously described intrinsic sequence bias background model. For most of the TFs analyzed, the de novo background model had a higher Pearson correlation to intrinsic sequence bias background model than foreground footprint model (Figure 8A). The foreground footprint model largely correlated negatively or very weakly with the sequence bias background, indicating that EM was able to identify a distinct, nonbackground subset of footprints that is clearly not due to sequence bias (Figure 8A, upper left quadrant). However, some factors did not allow for a clear separation between the foreground footprint and de novo background model, with respect the intrinsic sequence bias (Figure 8A, upper right quadrant). This may be due to these TFs either leaving weak footprints, or that binding sites for these TFs strongly resemble the cutting bias preferences of DNaseI. Furthermore, using de novo background instead of intrinsic sequence bias background yields a slightly better performance for the classification pipeline on the average, suggesting that de novo background is a better estimation of the true background signal than using the intrinsic sequence bias background (Supplementary Table S5).
Figure 8.
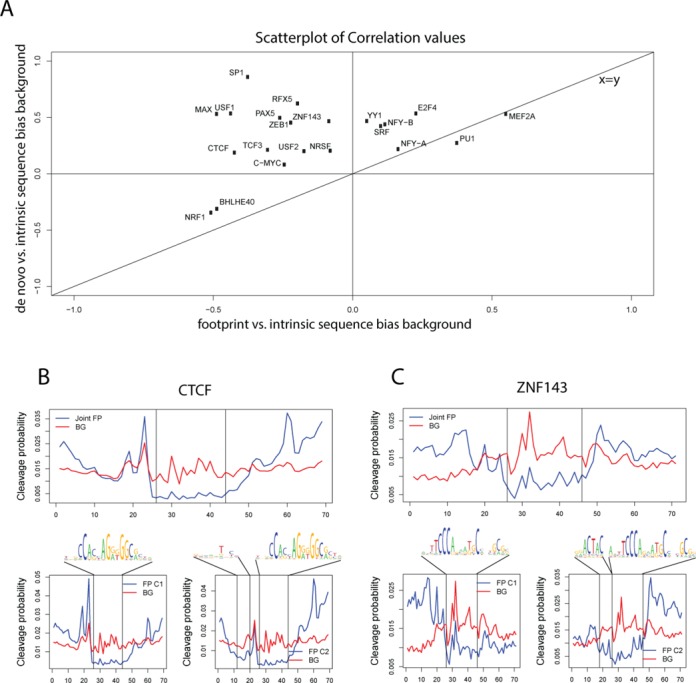
EM footprint components distinguish background bias and footprints, as well as alternate motif usage. (A) Correlation of intrinsic DNase-seq sequence bias profile (generated from deproteinized naked DNA DNase-seq) compared to the de novo foreground footprint component (X axis) and de novo background component (Y axis) of multinomial mixture model. For 19 TFs the de novo background component learned by mixture model correlates more with intrinsic sequence bias model. The majority of de novo foreground footprint models correlate negatively with intrinsic sequence bias model. (B) Combined footprint model for CTCF against the de novo background component in the upper panel and the two footprint components (C1 and C2) that make up the footprint in the lower two panels, with the sequence logo associated with each component for CTCF. Vertical lines delimit the PWM we used for this factor. An additional motif associated with the depletion in second footprint component can be seen upstream of the main motif. (C) Similarly for ZNF143, extended motif corresponds to a bigger footprint for the second component.
DNase footprints can identify variants of the main sequence motif
While the two foreground footprint components were symmetric for most TFs, we found that this was not the case for CTCF and ZNF143. For these factors, we detected some foreground components that exhibited an extended footprint profile beyond the core motif (Figure 8B and C). These extended footprints suggest additional interactions within a subset of the TF-binding sites. Building extended PWMs on the sets of sequence motifs that make up each footprint component, we found a variant of the main CTCF motif (Figure 8B) that has been reported by previous footprint studies (18), ChIP-seq (51) and ChIP-exo experiments (52). We detected a similar extended motif for ZNF143 that has not been previously characterized (Figure 8C). As these factors are members of the zinc finger family, it is not surprising to find extended variants of the main motif, which can be bound by additional domains that do not make contact with the core sequence motif. This finding demonstrates the usefulness of unsupervised mixture models in which footprint model components reflect different modes of binding and can detect ways that certain TFs interacts with either the core or extended consensus motif.
DISCUSSION
Since the advent of next generation sequencing assays, DNase hypersensitivity and DNase footprinting via DNase-seq has been widely used as predictors of TF-binding locations in various organisms and cell types. A variety of approaches for sequence motif-based or de novo discovery of DNase footprints have been developed with differences in their definition of a DNase footprint (16,18,20,21). However, since some of these methods incorporate data that are independent of the footprint, the extent of how well footprinting alone predicts TF–DNA interactions has been unclear. Furthermore, sequence bias in DNase-seq data has recently been documented in multiple studies (23,25), and has even called into question the overall ability to identify footprints in DNase data (24).
In this study, we have modeled and thoroughly assessed the predictive performance of DNase-seq footprints for 21 TFs using models that learn distinct- and factor-specific footprint shapes with signal depletion centered on sequence motif matches, and include a background model to account for DNase sequence bias. We have shown that sequence motif centered footprints are not always present when the TFs are cross-linked to DNA, indicating weaker or indirect TF/DNA binding. Aggregate DNase-seq profiles at motif matches are therefore a mixture of background and footprint profiles, which likely explains the imperfect predictive performance of footprinting. Finally, we have shown that the overall footprint shape is generally not dependent on the bias of DNase enzymatic cleavage and is more likely caused by direct TF binding. Following the findings of (17), raw DNase accessibility is a comparable predictor for genome-wide TF binding and is able to generally discern bound motifs from unbound ones. However, we show a class of regulatory elements where overall DNase accessibility does not accurately reflect changes in binding to specific factors, indicating that single-nucleotide resolution footprint models are needed to accurately identify these types of binding events.
Although ChIP-seq is a well-established method to query protein–DNA interaction in a genome-wide manner, the extent to which ChIP-seq peaks result from direct binding or are confounded by indirect binding or noise is unknown (39–41,53). Here, characterizing ChIP-seq peaks based on the presence/absence of a footprint, we were able to resolve functional differences within the ChIP-seq data, such as indirect binding events in the vicinity of sequence match that may result from active transcription around the candidate-binding site (40,41). Another possible explanation for ChIP peaks without footprints may be the spatial closeness of two ChIP-seq peaks due to 3D conformation of the genome (39). In the current state, footprint models may not yet be advanced enough to replace specific ChIP data, but given the complexity of binding landscape and architecture of the genome, we propose that DNase-seq footprints may be used in combination with ChIP-seq to distinguish high confidence direct binding events at high resolution.
Finally, for two of the TFs evaluated here, the mixture modeling detected more than one distinct footprint profile, coinciding with differences in sequence motifs and suggesting the effect of different binding modes. While we used traditional PWMs that represent all binding sites of a TF in unison, motif variations and differential binding modes may exist, backed by in vitro PBM experiments (28) and ChIP-seq experiments (51,52). Further, we show that predictive performance of footprinting is higher for TFs with highly specific sequence motifs and we show a case where PWM model fails to accurately pinpoint candidate-binding sites associated with the factor, confounding our high-resolution footprint model. These findings suggest joint learning of DNA sequence and DNase-seq footprint is a promising next step to more accurately detect and characterize TF–DNA interactions in vivo.
SUPPLEMENTARY DATA
Supplementary Data are available at NAR Online.
Acknowledgments
We thank Raluca Gordan for helpful discussions and Josh Schipper for sharing universal protein-binding microarray experiments for E2F1 factor.
FUNDING
Human Frontier Science Program [RGY0093/2012 to U.O.]; National Institutes of Health [U54-HG004563 to G.E.C.] Funding for open access charge: Human Frontier Science Program [RGY0093/2012 to U.O.].
Conflict of interest statement. None declared.
REFERENCES
- 1.Ernst J., Kheradpour P., Mikkelsen T.S., Shoresh N., Ward L.D., Epstein C.B., Zhang X., Wang L., Issner R., Coyne M., et al. Mapping and analysis of chromatin state dynamics in nine human cell types. Nature. 2011;473:43–49. doi: 10.1038/nature09906. [DOI] [PMC free article] [PubMed] [Google Scholar]
- 2.Hoffman M.M., Buske O.J., Wang J., Weng Z., Bilmes J.A., Noble W.S. Unsupervised pattern discovery in human chromatin structure through genomic segmentation. Nat. Methods. 2012;9:473–476. doi: 10.1038/nmeth.1937. [DOI] [PMC free article] [PubMed] [Google Scholar]
- 3.Crawford G.E., Holt I.E., Mullikin J.C., Tai D., Blakesley R., Bouffard G., Young A., Masiello C., Green E.D., Wolfsberg T.G., et al. Identifying gene regulatory elements by genome-wide recovery of DNase hypersensitive sites. Proc. Natl. Acad. Sci. U.S.A. 2004;101:992–997. doi: 10.1073/pnas.0307540100. [DOI] [PMC free article] [PubMed] [Google Scholar]
- 4.Boyle A.P., Davis S., Shulha H.P., Meltzer P., Margulies E.H., Weng Z., Furey T.S., Crawford G.E. High-resolution mapping and characterization of open chromatin across the genome. Cell. 2008;132:311–322. doi: 10.1016/j.cell.2007.12.014. [DOI] [PMC free article] [PubMed] [Google Scholar]
- 5.Thurman R.E., Rynes E., Humbert R., Vierstra J., Maurano M.T., Haugen E., Sheffield N.C., Stergachis A.B., Wang H., Vernot B., et al. The accessible chromatin landscape of the human genome. Nature. 2012;489:75–82. doi: 10.1038/nature11232. [DOI] [PMC free article] [PubMed] [Google Scholar]
- 6.Consortium E.P., Birney E., Stamatoyannopoulos J.A., Dutta A., Guigo R., Gingeras T.R., Margulies E.H., Weng Z., Snyder M., Dermitzakis E.T., et al. Identification and analysis of functional elements in 1% of the human genome by the ENCODE pilot project. Nature. 2007;447:799–816. doi: 10.1038/nature05874. [DOI] [PMC free article] [PubMed] [Google Scholar]
- 7.Gross D.S., Garrard W.T. Nuclease hypersensitive sites in chromatin. Annu. Rev. Biochem. 1988;57:159–197. doi: 10.1146/annurev.bi.57.070188.001111. [DOI] [PubMed] [Google Scholar]
- 8.Natarajan A., Yardimci G.G., Sheffield N.C., Crawford G.E., Ohler U. Predicting cell-type-specific gene expression from regions of open chromatin. Genome Res. 2012;22:1711–1722. doi: 10.1101/gr.135129.111. [DOI] [PMC free article] [PubMed] [Google Scholar]
- 9.Dong X., Greven M.C., Kundaje A., Djebali S., Brown J.B., Cheng C., Gingeras T.R., Gerstein M., Guigo R., Birney E., et al. Modeling gene expression using chromatin features in various cellular contexts. Genome Biol. 2012;13:R53. doi: 10.1186/gb-2012-13-9-r53. [DOI] [PMC free article] [PubMed] [Google Scholar]
- 10.Sheffield N.C., Thurman R.E., Song L., Safi A., Stamatoyannopoulos J.A., Lenhard B., Crawford G.E., Furey T.S. Patterns of regulatory activity across diverse human cell types predict tissue identity, transcription factor binding, and long-range interactions. Genome Res. 2013;23:777–788. doi: 10.1101/gr.152140.112. [DOI] [PMC free article] [PubMed] [Google Scholar]
- 11.Lappalainen T., Sammeth M., Friedlander M.R., t Hoen P.A., Monlong J., Rivas M.A., Gonzalez-Porta M., Kurbatova N., Griebel T., Ferreira P.G., et al. Transcriptome and genome sequencing uncovers functional variation in humans. Nature. 2013;501:506–511. doi: 10.1038/nature12531. [DOI] [PMC free article] [PubMed] [Google Scholar]
- 12.Kasowski M., Kyriazopoulou-Panagiotopoulou S., Grubert F., Zaugg J.B., Kundaje A., Liu Y., Boyle A.P., Zhang Q.C., Zakharia F., Spacek D.V., et al. Extensive variation in chromatin states across humans. Science. 2013;342:750–752. doi: 10.1126/science.1242510. [DOI] [PMC free article] [PubMed] [Google Scholar]
- 13.Maurano M.T., Humbert R., Rynes E., Thurman R.E., Haugen E., Wang H., Reynolds A.P., Sandstrom R., Qu H., Brody J., et al. Systematic localization of common disease-associated variation in regulatory DNA. Science. 2012;337:1190–1195. doi: 10.1126/science.1222794. [DOI] [PMC free article] [PubMed] [Google Scholar]
- 14.Hindorff L.A., Sethupathy P., Junkins H.A., Ramos E.M., Mehta J.P., Collins F.S., Manolio T.A. Potential etiologic and functional implications of genome-wide association loci for human diseases and traits. Proc. Natl. Acad. Sci. U.S.A. 2009;106:9362–9367. doi: 10.1073/pnas.0903103106. [DOI] [PMC free article] [PubMed] [Google Scholar]
- 15.Galas D.J., Schmitz A. DNAse footprinting: a simple method for the detection of protein-DNA binding specificity. Nucleic Acids Res. 1978;5:3157–3170. doi: 10.1093/nar/5.9.3157. [DOI] [PMC free article] [PubMed] [Google Scholar]
- 16.Pique-Regi R., Degner J.F., Pai A.A., Gaffney D.J., Gilad Y., Pritchard J.K. Accurate inference of transcription factor binding from DNA sequence and chromatin accessibility data. Genome Res. 2011;21:447–455. doi: 10.1101/gr.112623.110. [DOI] [PMC free article] [PubMed] [Google Scholar]
- 17.Cuellar-Partida G., Buske F.A., McLeay R.C., Whitington T., Noble W.S., Bailey T.L. Epigenetic priors for identifying active transcription factor binding sites. Bioinformatics. 2012;28:56–62. doi: 10.1093/bioinformatics/btr614. [DOI] [PMC free article] [PubMed] [Google Scholar]
- 18.Boyle A.P., Song L., Lee B.K., London D., Keefe D., Birney E., Iyer V.R., Crawford G.E., Furey T.S. High-resolution genome-wide in vivo footprinting of diverse transcription factors in human cells. Genome Res. 2011;21:456–464. doi: 10.1101/gr.112656.110. [DOI] [PMC free article] [PubMed] [Google Scholar]
- 19.Hesselberth J.R., Chen X., Zhang Z., Sabo P.J., Sandstrom R., Reynolds A.P., Thurman R.E., Neph S., Kuehn M.S., Noble W.S., et al. Global mapping of protein-DNA interactions in vivo by digital genomic footprinting. Nat. Methods. 2009;6:283–289. doi: 10.1038/nmeth.1313. [DOI] [PMC free article] [PubMed] [Google Scholar]
- 20.Neph S., Vierstra J., Stergachis A.B., Reynolds A.P., Haugen E., Vernot B., Thurman R.E., John S., Sandstrom R., Johnson A.K., et al. An expansive human regulatory lexicon encoded in transcription factor footprints. Nature. 2012;489:83–90. doi: 10.1038/nature11212. [DOI] [PMC free article] [PubMed] [Google Scholar]
- 21.Piper J., Elze M.C., Cauchy P., Cockerill P.N., Bonifer C., Ott S. Wellington: a novel method for the accurate identification of digital genomic footprints from DNase-seq data. Nucleic Acids Res. 2013;41:e201. doi: 10.1093/nar/gkt850. [DOI] [PMC free article] [PubMed] [Google Scholar]
- 22.Dingwall C., Lomonossoff G.P., Laskey R.A. High sequence specificity of micrococcal nuclease. Nucleic Acids Res. 1981;9:2659–2673. doi: 10.1093/nar/9.12.2659. [DOI] [PMC free article] [PubMed] [Google Scholar]
- 23.Lazarovici A., Zhou T., Shafer A., Dantas Machado A.C., Riley T.R., Sandstrom R., Sabo P.J., Lu Y., Rohs R., Stamatoyannopoulos J.A., et al. Probing DNA shape and methylation state on a genomic scale with DNase I. Proc. Natl. Acad. Sci. U.S.A. 2013;110:6376–6381. doi: 10.1073/pnas.1216822110. [DOI] [PMC free article] [PubMed] [Google Scholar]
- 24.He H.H., Meyer C.A., Hu S.S., Chen M.W., Zang C., Liu Y., Rao P.K., Fei T., Xu H., Long H., et al. Refined DNase-seq protocol and data analysis reveals intrinsic bias in transcription factor footprint identification. Nat. Methods. 2014;11:73–78. doi: 10.1038/nmeth.2762. [DOI] [PMC free article] [PubMed] [Google Scholar]
- 25.Koohy H., Down T.A., Hubbard T.J. Chromatin accessibility data sets show bias due to sequence specificity of the DNase I enzyme. PloS One. 2013;8:e69853. doi: 10.1371/journal.pone.0069853. [DOI] [PMC free article] [PubMed] [Google Scholar]
- 26.Stormo G.D. DNA binding sites: representation and discovery. Bioinformatics. 2000;16:16–23. doi: 10.1093/bioinformatics/16.1.16. [DOI] [PubMed] [Google Scholar]
- 27.Megraw M., Pereira F., Jensen S.T., Ohler U., Hatzigeorgiou A.G. A transcription factor affinity-based code for mammalian transcription initiation. Genome Res. 2009;19:644–656. doi: 10.1101/gr.085449.108. [DOI] [PMC free article] [PubMed] [Google Scholar]
- 28.Badis G., Berger M.F., Philippakis A.A., Talukder S., Gehrke A.R., Jaeger S.A., Chan E.T., Metzler G., Vedenko A., Chen X., et al. Diversity and complexity in DNA recognition by transcription factors. Science. 2009;324:1720–1723. doi: 10.1126/science.1162327. [DOI] [PMC free article] [PubMed] [Google Scholar]
- 29.Gordan R., Murphy K.F., McCord R.P., Zhu C., Vedenko A., Bulyk M.L. Curated collection of yeast transcription factor DNA binding specificity data reveals novel structural and gene regulatory insights. Genome Biol. 2011;12:R125. doi: 10.1186/gb-2011-12-12-r125. [DOI] [PMC free article] [PubMed] [Google Scholar]
- 30.Berger M.F., Philippakis A.A., Qureshi A.M., He F.S., Estep P.W., 3rd, Bulyk M.L. Compact, universal DNA microarrays to comprehensively determine transcription-factor binding site specificities. Nat. Biotechnol. 2006;24:1429–1435. doi: 10.1038/nbt1246. [DOI] [PMC free article] [PubMed] [Google Scholar]
- 31.Song L., Crawford G.E. DNase-seq: a high-resolution technique for mapping active gene regulatory elements across the genome from mammalian cells. Cold Spring Harb. Protoc. 2010;2010 doi: 10.1101/pdb.prot5384. doi:10.1101/pdb.prot5384. [DOI] [PMC free article] [PubMed] [Google Scholar]
- 32.Boyle A.P., Guinney J., Crawford G.E., Furey T.S. F-Seq: a feature density estimator for high-throughput sequence tags. Bioinformatics. 2008;24:2537–2538. doi: 10.1093/bioinformatics/btn480. [DOI] [PMC free article] [PubMed] [Google Scholar]
- 33.Tewari A.K., Yardimci G.G., Shibata Y., Sheffield N.C., Song L., Taylor B.S., Georgiev S.G., Coetzee G.A., Ohler U., Furey T.S., et al. Chromatin accessibility reveals insights into androgen receptor activation and transcriptional specificity. Genome Biol. 2012;13:R88. doi: 10.1186/gb-2012-13-10-r88. [DOI] [PMC free article] [PubMed] [Google Scholar]
- 34.Consortium E.P., Bernstein B.E., Birney E., Dunham I., Green E.D., Gunter C., Snyder M. An integrated encyclopedia of DNA elements in the human genome. Nature. 2012;489:57–74. doi: 10.1038/nature11247. [DOI] [PMC free article] [PubMed] [Google Scholar]
- 35.Landt S.G., Marinov G.K., Kundaje A., Kheradpour P., Pauli F., Batzoglou S., Bernstein B.E., Bickel P., Brown J.B., Cayting P., et al. ChIP-seq guidelines and practices of the ENCODE and modENCODE consortia. Genome Res. 2012;22:1813–1831. doi: 10.1101/gr.136184.111. [DOI] [PMC free article] [PubMed] [Google Scholar]
- 36.Kharchenko P.V., Tolstorukov M.Y., Park P.J. Design and analysis of ChIP-seq experiments for DNA-binding proteins. Nat. Biotechnol. 2008;26:1351–1359. doi: 10.1038/nbt.1508. [DOI] [PMC free article] [PubMed] [Google Scholar]
- 37.Song L., Zhang Z., Grasfeder L.L., Boyle A.P., Giresi P.G., Lee B.K., Sheffield N.C., Graf S., Huss M., Keefe D., et al. Open chromatin defined by DNaseI and FAIRE identifies regulatory elements that shape cell-type identity. Genome Res. 2011;21:1757–1767. doi: 10.1101/gr.121541.111. [DOI] [PMC free article] [PubMed] [Google Scholar]
- 38.Johnson D.S., Mortazavi A., Myers R.M., Wold B. Genome-wide mapping of in vivo protein-DNA interactions. Science. 2007;316:1497–1502. doi: 10.1126/science.1141319. [DOI] [PubMed] [Google Scholar]
- 39.Mercer T.R., Edwards S.L., Clark M.B., Neph S.J., Wang H., Stergachis A.B., John S., Sandstrom R., Li G., Sandhu K.S., et al. DNase I-hypersensitive exons colocalize with promoters and distal regulatory elements. Nat. Genet. 2013;45:852–859. doi: 10.1038/ng.2677. [DOI] [PMC free article] [PubMed] [Google Scholar]
- 40.Teytelman L., Thurtle D.M., Rine J., van Oudenaarden A. Highly expressed loci are vulnerable to misleading ChIP localization of multiple unrelated proteins. Proc. Natl. Acad. Sci. U.S.A. 2013;110:18602–18607. doi: 10.1073/pnas.1316064110. [DOI] [PMC free article] [PubMed] [Google Scholar]
- 41.Park D., Lee Y., Bhupindersingh G., Iyer V.R. Widespread Misinterpretable ChIP-seq Bias in Yeast. PloS One. 2013;8:e83506. doi: 10.1371/journal.pone.0083506. [DOI] [PMC free article] [PubMed] [Google Scholar]
- 42.John S., Sabo P.J., Canfield T.K., Lee K., Vong S., Weaver M., Wang H., Vierstra J., Reynolds A.P., Thurman R.E. Genome-scale mapping of DNase I hypersensitivity. Curr. Protoc. Mol. Biol. 2013;2013 doi: 10.1002/0471142727.mb2127s103. doi:10.1002/0471142727.mb2127s103. [DOI] [PMC free article] [PubMed] [Google Scholar]
- 43.Andres M.E., Burger C., Peral-Rubio M.J., Battaglioli E., Anderson M.E., Grimes J., Dallman J., Ballas N., Mandel G. CoREST: a functional corepressor required for regulation of neural-specific gene expression. Proc. Natl. Acad. Sci. U.S.A. 1999;96:9873–9878. doi: 10.1073/pnas.96.17.9873. [DOI] [PMC free article] [PubMed] [Google Scholar]
- 44.Schwalie P.C., Ward M.C., Cain C.E., Faure A.J., Gilad Y., Odom D.T., Flicek P. Co-binding by YY1 identifies the transcriptionally active, highly conserved set of CTCF-bound regions in primate genomes. Genome Biol. 2013;14:R148. doi: 10.1186/gb-2013-14-12-r148. [DOI] [PMC free article] [PubMed] [Google Scholar]
- 45.Karczewski K.J., Tatonetti N.P., Landt S.G., Yang X., Slifer T., Altman R.B., Snyder M. Cooperative transcription factor associations discovered using regulatory variation. Proc. Natl. Acad. Sci. U.S.A. 2011;108:13353–13358. doi: 10.1073/pnas.1103105108. [DOI] [PMC free article] [PubMed] [Google Scholar]
- 46.Li B., Carey M., Workman J.L. The role of chromatin during transcription. Cell. 2007;128:707–719. doi: 10.1016/j.cell.2007.01.015. [DOI] [PubMed] [Google Scholar]
- 47.Ogryzko V.V., Schiltz R.L., Russanova V., Howard B.H., Nakatani Y. The transcriptional coactivators p300 and CBP are histone acetyltransferases. Cell. 1996;87:953–959. doi: 10.1016/s0092-8674(00)82001-2. [DOI] [PubMed] [Google Scholar]
- 48.Tijchon E., Havinga J., van Leeuwen F.N., Scheijen B. B-lineage transcription factors and cooperating gene lesions required for leukemia development. Leukemia. 2013;27:541–552. doi: 10.1038/leu.2012.293. [DOI] [PubMed] [Google Scholar]
- 49.Chen Z.F., Paquette A.J., Anderson D.J. NRSF/REST is required in vivo for repression of multiple neuronal target genes during embryogenesis. Nat. Genet. 1998;20:136–142. doi: 10.1038/2431. [DOI] [PubMed] [Google Scholar]
- 50.Takahashi K., Yamanaka S. Induction of pluripotent stem cells from mouse embryonic and adult fibroblast cultures by defined factors. Cell. 2006;126:663–676. doi: 10.1016/j.cell.2006.07.024. [DOI] [PubMed] [Google Scholar]
- 51.Schmidt D., Schwalie P.C., Wilson M.D., Ballester B., Goncalves A., Kutter C., Brown G.D., Marshall A., Flicek P., Odom D.T. Waves of retrotransposon expansion remodel genome organization and CTCF binding in multiple mammalian lineages. Cell. 2012;148:335–348. doi: 10.1016/j.cell.2011.11.058. [DOI] [PMC free article] [PubMed] [Google Scholar]
- 52.Rhee H.S., Pugh B.F. Comprehensive Genome-wide Protein-DNA Interactions Detected at Single-Nucleotide Resolution. Science. 2012;147:1408–1419. doi: 10.1016/j.cell.2011.11.013. [DOI] [PMC free article] [PubMed] [Google Scholar]
- 53.Gordan R., Hartemink A.J., Bulyk M.L. Distinguishing direct versus indirect transcription factor–DNA interactions. Genome Res. 2009;19:2090–2100. doi: 10.1101/gr.094144.109. [DOI] [PMC free article] [PubMed] [Google Scholar]
Associated Data
This section collects any data citations, data availability statements, or supplementary materials included in this article.