


Abstract
The THSC/TREX-2 complex of Saccharomyces cerevisiae mediates the anchoring of transcribed genes to the nuclear pore, linking transcription elongation with mRNA export and genome stability, as shown for specific reporters. However, it is still unknown whether the function of TREX-2 is global and the reason for its relevant role in genome integrity. Here, by studying two TREX-2 representative subunits, Thp1 and Sac3, we show that TREX-2 has a genome-wide role in gene expression. Both proteins show similar distributions along the genome, with a gradient disposition at active genes that increases towards the 3′ end. Thp1 and Sac3 have a relevant impact on the expression of long, G+C-rich and highly transcribed genes. Interestingly, replication impairment detected by the genome-wide accumulation of the replicative Rrm3 helicase is increased preferentially at highly expressed genes in the thp1Δ and sac3Δ mutants analyzed. Therefore, our work provides evidence of a function of TREX-2 at the genome-wide level and suggests a role for TREX-2 in preventing transcription–replication conflicts, as a source of genome instability derived from a defective messenger ribonucleoprotein particle (mRNP) biogenesis.
INTRODUCTION
During transcription from RNA polymerase II (RNAPII), the nascent pre-mRNA is bound by RNA-binding proteins and undergoes a series of processing steps, including 5′-end capping, splicing and 3′-end cleavage and polyadenylation (1). This leads to the formation of the messenger ribonucleoprotein particle (mRNP), which is co-transcriptionally exported to the cytoplasm through the nuclear pore complex (NPC) (2). A variety of factors participate in mRNP export in Saccharomyces cerevisiae, including the conserved THO complex, the heterogeneous nuclear ribonucleoproteins (hnRNPs) Nab2 and Npl3, the export receptor Mex67-Mtr2 and the NPC-associated THSC/TREX-2 complex. The current view is that these factors act in a sequential process that guides the mRNA to the NPC to be exported to the cytoplasm (3). In this sense, increasing evidences suggest that highly transcribed genes and some inducible genes are recruited to the nuclear envelope upon transcriptional activation in yeast and higher eukaryotes (4). In agreement with the gene gating hypothesis (5), the positioning of transcribed genes to the proximity of the NPC is dependent on a variety of factors, including those involved in transcription initiation and mRNA export (6–11).
The yeast THSC/TREX-2 complex (TREX-2 from now on), composed by Sac3, Thp1, Sus1, Cdc31 and Sem1, is an important mediator of mRNA export that provides an anchoring of transcribed genes to the NPC (12–17). Sac3, the largest subunit of the complex, acts as a platform with different interaction domains. Whereas its N-terminus associates with Thp1 and Sem1 to form an mRNA-binding module, as well as with the export receptor Mex67, its C-terminus interacts with Sus1, Cdc31 and the Nup1 nucleoporin, providing anchoring to the NPC (13,18–21). This organization is highly conserved from yeast to human cells (18,19,22,23). In addition to TREX-2, Sus1 is also a component of the histone H2B deubiquitinylation module of the SAGA complex, involved in transcription initiation of some yeast genes (15,24). It has been shown that Thp1, Sac3 and Sus1 are required for proper relocation of active genes to the NPC upon transcriptional activation (6,8,10). Cdc31 is the yeast homolog of the human centrins, functions in the duplication of the spindle pole body and is important for mRNA export (14,25). Finally, Sem1 is a common component of the 19S regulatory particle of the 26S proteasome, the COP9 signalosome and TREX-2, and is also important for transcription initiation and mRNA export (16,17).
In addition to the export of mRNAs, the yeast TREX-2 complex plays a role in transcription elongation, as has been shown using artificial reporters such as the G+C-rich gene lacZ or a G-less-based run-on (GLRO) assay (12,26,27). This function is common to other mRNA export factors such as the THO complex (28), and THO mutants show a genome-wide down-regulation of long, G+C-rich and highly expressed genes (29). Interestingly, recent works have demonstrated that several mRNA export factors associate with the chromatin of transcribed genes all over the genome (29–31), suggesting a general role of these proteins in transcription. However, no evidence exists for a genome-wide function of TREX-2 in transcription, and whether or not its components bind to genes remains unknown.
An important feature of yeast TREX-2 mutants is their high level of transcription-associated hyperrecombination (TAR), which supports a connection among mRNA export, transcription and genome instability (12,16,26,32). The TAR phenotype is common to other mutants involved in transcription and mRNA export, such as THO, Sub2, Npl3 or Mex67, as well as other RNA processing mutants from yeast to human cells (30,33,34). TAR is believed to occur as a consequence of several mechanisms. First, a putatively stalled RNAPII would increase negative supercoiling behind transcription, leading to the accumulation of single-stranded DNA (ssDNA). This ssDNA is more susceptible to the action of nucleases, genotoxic agents and the human activation-induced cytidine deaminase (AID), as has been shown for TREX-2 and other related mutants (26,30,35). Second, transcription would constitute an obstacle for replication fork (RF) progression, leading to strong replication impairment at transcribed genes (29). However, there is no evidence connecting TAR and replication in TREX-2 mutants.
In this work, the genome-wide function of TREX-2 is analyzed. Thp1 and Sac3 mutations are shown by microarray analyses to lead to a down-regulation of long, G+C-rich and highly transcribed genes. Comparison of TREX-2 mutant expression profiles with those of THO mutants supports the idea that Thp1 and Sac3 act as a functional unit, playing a role in gene expression different from that of the THO complex. By ChIP-chip, we show that Thp1 and Sac3 bind to highly transcribed genes in a gradient manner towards their 3′ ends, similar to the THO subunit Hpr1. Interestingly, depletion of Thp1 or Sac3 leads to a strong genome-wide replication impairment detected by accumulation of the replicative Rrm3 helicase at highly transcribed genes and other regions that is stronger in sac3Δ cells. Taken together, our results provide evidence that Thp1 and Sac3 function in highly expressed genes all over the genome and help prevent transcription–replication collisions that cause genome instability.
MATERIALS AND METHODS
Yeast strains and molecular biology
Plasmids pCM184 and pCM184RNH1 were described previously (30,36). Yeast strains used in this study are listed in Supplementary Table S2. Yeast genetics and molecular biology methodologies, including protein extractions and westerns, were performed using standard procedures.
Microarray gene expression analysis
Microarray determination of total RNA was performed using the Affymetrix platform, as previously described (29). Briefly, total RNA was isolated from wild-type and mutant strains and the RNA was extracted using the RNeasy Midi Kit (Qiagen). RNA levels for all yeast genes were determined using an Affymetrix microarray scanner. For each strain, microarray analysis was conducted in triplicate and the values presented represent the average of these three determinations. The expression data can be accessed at Gene Expression Omnibus (GSE56703, GSE56702).
Microarray validation by RT-qPCR
Total RNA was extracted from exponentially growing cells using the RNeasy Mini Kit (Qiagen) and cDNA was obtained by the Quantitec Reverse Transcription Kit (Qiagen). qPCR reactions were performed from 1 μl of cDNA following the manufacturer's instructions. RNA levels were determined by relative quantitation normalized to the SCR1 gene, transcribed by RNAPIII. Primers used are listed in Supplementary Table S3.
ChIP-chip experiments
S. cerevisiae oligonucleotide tiling microarrays were provided by Affymetrix. The high-density oligonucleotide arrays used are able to analyze yeast chromosomes at a 300-bp resolution, each of the 300-bp region being covered by at least 60 probes. ChIP-chip of asynchronously growing cells was carried out as described (37,38). Briefly, we disrupted 1.5×10⁷ cells by multi-beads shocker (MB400U, Yasui Kikai, Japan), which was able to keep cells precisely at lower than 6°C during disruption by glass beads. Anti-FLAG monoclonal antibody M2 (Sigma-Aldrich) was used for ChIP. ChIP DNA was purified and amplified by random priming using a WGA2 kit (Sigma-Aldrich) and following the manufacturer's procedure. A total of 4 μg of amplified DNA was digested with DNase I to a mean size of 100 bp, purified, and the fragments were end-labeled with biotin-N6-ddATP23. ChIP-chip experiments shown with Thp1-FLAG and Sac3-FLAG are one per strain analyzed, which gave identical results. Rrm3-FLAG results shown are from two repetitions made for each strain analyzed, the data being normalized by the quantile method. The ChIP-chip data can be accessed at Gene Expression Omnibus (GSE56703, GSE56700).
Statistical analysis of genome-wide data
Microarray data analysis of gene expression was performed using the dChip application software (http://www.dchip.org) (39). All arrays were normalized with PM probes (invariant set normalization and model-based expression) and the outliers treated as missing data in the subsequent analyses. A filter was used to select only S. cerevisiae genes. Model-based expression values are represented as arbitrary units (A.U.) in linear scale. For each strain, the expression profile was compared with its isogenic wild type and the genes showing at least a 1.5-fold expression change considered as altered (parameters: absolute difference between signal in mutant versus wild type >100; difference P-value <0.05). Genes with model-based expression values below 600 (the median expression value of meiotic genes in our experiments) in at least 50% of the samples were removed before the comparisons to reduce the false positives. Heatmaps were done with the Multiexperiment Viewer application software (http://www.tm4.org) considering the 50% of genes with major signal fold-change. Hierarchical clustering was performed by the complete linkage method according to a Pearson's correlation.
ChIP-chip data were analyzed using the Tiling Array Suite software (TAS) from Affymetrix, as previously described (30). TAS produces, per probe position, the signal and the change P-value, taking into account the probes localized within a given bandwidth around the inspected probe. Protein chromosomal distribution was then analyzed by detecting binding clusters, which were defined as ranges within the chromosome respecting the following conditions: estimated signal (IP/SUP-binding ratio) positive in the whole range; P-value<0.01, minimum run of 100 bp and maximum gap of 250 bp. The results were visualized with the UCSC Genome Browser, developed and maintained by the Genome Bioinformatics Group (Center for Biomolecular Science and Engineering at the University of California, Santa Cruz) (http://genome.ucsc.edu/). For statistical analysis of the functional and structural features of the genes, model-based expression levels were taken from microarray of W303-1A (29). Distribution of binding sites along genes was carried out as previously described (29).
ChIP analyses
Recruitment of Rrm3 to chromatin was determined by ChIP analyses as previously described (40). The Wizard SV Gel and PCR clean-up system (Promega) was used for the last DNA purification step. Primers used are listed in Supplementary Table S3. The PCR product of the intergenic region at positions 9716–9863 of chromosome V was used as a negative control. Quantitative PCR and calculations of the relative abundance of each DNA fragment were performed as described (41). For each experiment, the DNA ratios in the different regions were calculated relative to the amount of the intergenic region. Average and standard error of the mean of three independent experiments are shown.
RESULTS
Thp1 and Sac3 act as a functional unit in the regulation of global gene expression
Transcription from artificial reporters is impaired in TREX-2 mutants, a phenomenon linked to their mRNA export defects and TAR phenotype (12,26,27). To assess whether these transcription defects apply to the whole genome, microarray analyses of gene expression were performed in thp1Δ, sac3Δ and sus1Δ cells, comparing the data to those of the THO mutants hpr1Δ, tho2Δ and sub2Δ (29). Genes with mRNA levels at least 1.5-fold above or below the wild-type levels and a P < 0.05 were selected for analysis. We excluded those with expression values below the median for meiotic genes in our experiments, taken as the cutoff for non-expression values, in order to reduce the false positives. We found a different number of de-regulated genes in the six mutant strains, tho2Δ, sub2Δ and thp1Δ, these being the mutants with the highest impact on gene expression, with 711, 912 and 992 de-regulated genes, respectively (Supplementary Table S1).
Hierarchical clustering of the mutant expression profiles showed that thp1Δ and sac3Δ were clearly similar between them but different from THO and sub2Δ mutants (Figure 1A). This is consistent with Thp1 and Sac3 being a structural and functional unit working in mRNA export (12,18). sus1Δ cells had the most different profile from the other mutants. Even though small differences could be observed between thp1Δ and sac3Δ expression profiles (Figure 1A), a high correlation was seen between the mutant expression profiles of both mutants (Pearson's R correlation coefficient = 0.7580), as well as between those of THO mutants and sub2Δ (R = 0.6963 – 0.8946) (Figure 1B). However, the profiles of these five mutants did not correlate with that of sus1Δ (R = –0.1974 – 0.2942; Figure 1B and Supplementary Figure S1A). We conclude that Thp1 and Sac3 work as a functional unit modulating gene expression, the effects of their depletion being different from those of THO, Sub2 and Sus1. Therefore, we decided to continue the work with Thp1 and Sac3, as the most functionally significant subunits.
Figure 1.

Microarray expression analysis of genes affected by THO, Sub2 and THSC/TREX-2 mutations. (A) Clustering of the expression profiles of THO–Sub2 and Thp1–Sac3 mutants. Heat-map of the 50% of genes with major log2 signal fold-change in THO, Sub2 and THSC/TREX-2 mutants compared to wild type is shown. (B) Correlation analysis between the expression profiles of THO–Sub2 and THSC/TREX-2 mutants. Scatter plots showing correlation among the log2 signal fold-change of THO–Sub2 (top) and THSC/TREX-2 (bottom) mutants. A linear regression line and the Pearson's R correlation coefficient are plotted per graph. (C) Overlap between de-regulated genes in thp1Δ and sac3Δ mutants. Venn diagrams representing the genes whose expression is significantly changed (P < 0.05, fold-change > 1.5) in thp1Δ and sac3Δ cells. The complete list of genes can be found in the Supplementary Dataset II. (D) Functional and structural features of the de-regulated genes in thp1Δ and sac3Δ mutants. Statistical analysis of length, G+C content and model-based expression levels for genes whose expression levels are coincidently affected in thp1Δ and sac3Δ cells. Median values are shown and a line represents the genome median. ***, P < 0.001 (Mann–Whitney's U-test) as compared to the genome median. Genes showing expression levels below the median of the meiotic genes in our experiments in at least 50% of the samples were removed from the comparison.
We then analyzed the genes whose expression was de-regulated in thp1Δ and sac3Δ cells according to the microarray data. Consistent with the clustering results, we observed a high overlap between up- and down-regulated genes in both strains (P < 0.0001), with most up- (83%) and down-regulated genes (70%) in sac3Δ cells being coincident with those of thp1Δ (Figure 1C). This overlap was lower when compared with de-regulated genes of hpr1Δ cells, as only 18–36% of de-regulated genes in hpr1Δ overlapped with those of thp1Δ or sac3Δ (Supplementary Figure S1B). Statistical analysis of the structural and functional features of the 237 up-regulated and 73 down-regulated genes that were coincident between thp1Δ and sac3Δ cells showed that both groups of genes were longer than the genome median (Figure 1D; P < 0.001). Whereas up-regulated genes were G+C-poor and poorly expressed, down-regulated genes were G+C-rich and highly expressed (Figure 1D; P < 0.001), similar to the results of THO mutants (Supplementary Figure S2), and in contrast to the general tendency of long genes in yeast that are G+C poor (42). Gene ontology analyses showed a high variety of biological processes enriched in the up-regulated genes, such as transcription, mRNA processing, chromosome segregation and cell cycle (Supplementary Dataset I), while down-regulated genes were only enriched in ion transport genes, suggesting that this down-regulation was specific of long, G+C-rich and highly expressed genes, independent of function. Changes in gene expression were validated by RT-qPCR for some up- and down-regulated genes in thp1Δ and sac3Δ cells as indicated (Supplementary Figure S3). Altogether, our results indicate that Thp1 and Sac3 have a relevant function in the expression of highly transcribed genes.
Genome-wide recruitment of Thp1 and Sac3 to active genes
To analyze the binding of Thp1 and Sac3 to the genome, ChIP-chip experiments were performed with yeast strains carrying both proteins FLAG-tagged. ChIP-chip data were subjected to computational analysis to obtain a genomic map distribution. We found that binding of the two TREX-2 subunits to the genome was highly similar (R = 0.9192; Figure 2). Statistical analysis revealed that 69.3% and 69.8% of Thp1 and Sac3 binding clusters, respectively, peaked inside Open Reading Frames (ORFs). Thp1 and Sac3 were significantly enriched in a similar number of genes (2131 and 1996, respectively), most of them coincident (74.1%; P < 0.0001) and with a high correlation of recruitment levels (R = 0.8987; Figure 3A). These results indicate that Thp1 and Sac3 act as a complex that associates with transcribed DNA regions.
Figure 2.
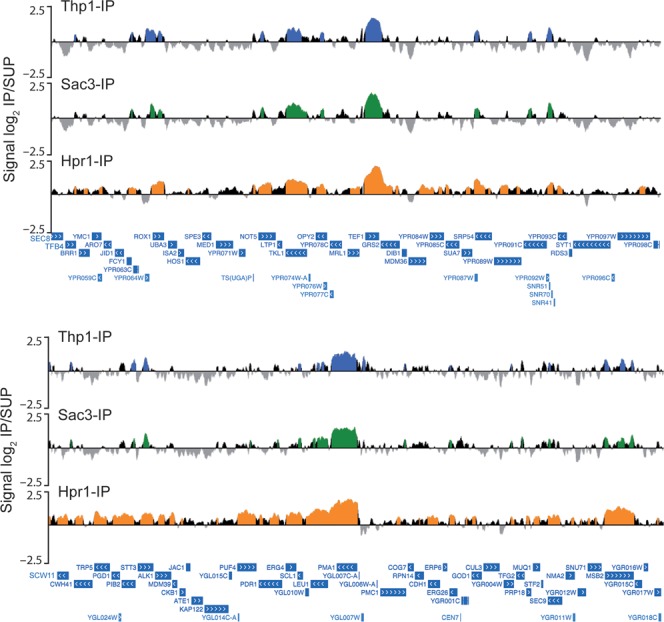
Recruitment pattern of Thp1, Sac3 and the THO complex to ORFs. ChIP-chip analysis of Thp1-FLAG, Sac3-FLAG and Hpr1-FLAG binding to the whole genome. Two genomic fragments from chromosomes XVI and VII are shown, with enrichment values represented as signal log2 IP/SUP ratio. Blue (Thp1-IP), green (Sac3-IP) and orange (Hpr1-IP) histograms (online version) represent the significant binding clusters (P < 0.01, minimum run >100 bp, maximum gap <250 bp). Genes and other features are represented according to the Saccharomyces Genome Database (SGD) as blue bars and white arrows in relation to the direction of transcription.
Figure 3.

Analysis of Thp1- and Sac3-enriched genes compared to Hpr1. (A) Correlation between Thp1- and Sac3-enriched genes. Left, Venn diagram showing the overlap between Thp1- and Sac3-enriched genes in ChIP-chip analyses. Right, scatter plot showing correlation between Thp1 and Sac3 enrichment levels in the common ORFs. (B) Correlation among Thp1-, Sac3- and Hpr1-enriched genes. Left, Venn diagrams showing the overlap between Thp1-, Sac3- and Hpr1-enriched genes in ChIP-chip analyses. Right, scatter plots showing correlation between Thp1, Sac3 and Hpr1 enrichment levels in the common ORFs. A linear regression line and the Pearson's R correlation coefficient are plotted per scatter plot. The complete list of genes can be found in the Supplementary Dataset II.
We then compared the distribution of Thp1 and Sac3 with that of the THO subunit Hpr1, previously published (29), and observed that genes associated with Thp1 and Sac3 were also enriched in Hpr1 (Figures 2 and 3B). Correlations between Hpr1 and Thp1 or Sac3 enrichment levels were significant but lower than those of Thp1 and Sac3 (R = 0.4377 and 0.4974, respectively; P < 0.001; Figure 3B). We conclude that Thp1 and Sac3 function in the genes to which THO also binds. Additionally, Thp1 and Sac3 were also found at telomeres and some ARSs, introns, snRNAs, snoRNAs, and RNAPIII-transcribed genes, as is also the case of Hpr1 (Table 1). Sac3 was also found at seven centromeres, where non-significant peaks of Thp1 were also detected (Supplementary Figure S4). This may suggest an additional function of Sac3 (and maybe Thp1) in chromosome segregation. Altogether, these data suggest a role of Thp1 and Sac3 in transcribed genes all over the genome, most of which share a similar pattern of THO distribution.
Table 1. Genomic features mapped by different ChIP-chip binding clusters.
| Genomic feature | Thp1-IP | Sac3-IP | Hpr1-IP | Rrm3-IP WT | Rrm3-IP thp1Δ | Rrm3-IP sac3Δ | Total genome |
|---|---|---|---|---|---|---|---|
| ORFs | 2131 | 1996 | 4324 | 3926 | 4190 | 5520 | 6607 |
| Centromeres | 0 | 7 | 0 | 4 | 12 | 16 | 16 |
| Telomeres | 30 | 30 | 30 | 30 | 30 | 31 | 32 |
| ARS | 42 | 45 | 78 | 89 | 87 | 222 | 337 |
| Introns | 74 | 105 | 136 | 121 | 191 | 245 | 376 |
| snRNAs and snoRNAs | 15 | 23 | 35 | 23 | 61 | 68 | 83 |
| RNAPIII-transcribed | 36 | 39 | 57 | 75 | 211 | 237 | 309 |
Preferential accumulation of Thp1 and Sac3 at the 3′ end of highly transcribed genes
Next, we analyzed the structural and functional features of the TREX-2-bound genes detected in the ChIP-chip experiments. We found that they were significantly longer, G+C-richer and more highly expressed than the genome median (P < 0.001; Figure 4A). Gene ontology analyses of these ORFs revealed that they were enriched in a large variety of biological processes (Supplementary Dataset I), specially ribosome-related genes, which are highly expressed genes in yeast. Interestingly, a good correlation was found between Thp1 and Sac3 binding and expression levels in TREX-2-enriched genes, similar to that obtained for Hpr1 (Supplementary Figure S5). This suggests that the higher the expression level of the gene, the higher the detection capacity of these proteins by ChIP. In addition, we found that Thp1-bound genes significantly overlapped with down-regulated genes in thp1Δ cells (P < 0.05), but not with up-regulated genes (P = 0.2926; Supplementary Figure S6), in agreement with a specific down-regulation of the genes to which Thp1 binds. This effect was not clearly seen in Sac3-bound genes, probably due to the lower number of de-regulated genes in sac3Δ cells (Supplementary Figure S6). We conclude that TREX-2 accumulates at highly transcribed chromatin, consistent with its role in transcription and mRNA export.
Figure 4.

Thp1 and Sac3 accumulate towards the 3′ end of highly transcribed genes. (A) Functional and structural features of Thp1- and Sac3-enriched genes. Statistical analysis of length, G+C content and model-based expression levels for genes mapped by Thp1 and Sac3 clusters obtained in ChIP-chip experiments. Median values are shown; a line represents the genome median. ***, P < 0.001 (Mann–Whitney's U-test) as compared to genome median. Genes showing expression levels below the median of the meiotic genes in our experiments in at least 50% of the samples were removed from the comparison. (B) Distribution of Thp1 and Sac3 along the genes. Composite profile of Thp1 and Sac3 occupancy detected by ChIP-chip across the average ORF plotted as Thp1 or Sac3 percentage of ChIP clusters per segment. For this analysis, ORFs were subdivided in 10 segments independently of the ORF size plus two additional upstream and downstream segments of the same length. The binding distribution of Hpr1 (29) is shown for comparison. (C) Binding of Thp1 and Sac3 to highly expressed genes in an increasing gradient towards their 3′ end. Thp1, Sac3 and Hpr1 distribution at the highly transcribed PDC1-TRX1 and CDC19 loci, represented as signal log2 IP/SUP ratio. Blue (Thp1-IP), green (Sac3-IP) and orange (Hpr1-IP) histograms (online version) represent the statistically significant binding clusters (P < 0.01, minimum run >100 bp, maximum gap <250 bp). Genes and other features are represented according to the SGD.
Finally, the relative distribution of Thp1 and Sac3 along the length of the ORFs was analyzed by subdividing them into 10 equal segments independent of ORF size. Additional upstream (5′) and downstream (3′) segments of the same length were taken as promoter and terminator regions, respectively, as previously described (29). The distribution of the proteins along the ORFs was determined by the percentage of ChIP-chip clusters mapping on each segment. We found that Thp1 and Sac3 distribution increased gradually towards the 3′ end of the genes, while they bind poorly to the promoter and terminator regions, similarly to Hpr1 (Figure 4B and C). To assess whether Thp1 and Sac3 loading to the genes was dependent on the nascent mRNA, we analyzed their distribution along genes of different length intervals. As shown in Supplementary Figure S7, this distribution was independent of gene length, as the gradient recruitment of TREX-2 proteins to the 3′ end occurred in a similar manner in gene populations of different lengths. Altogether, these results suggest that Thp1 and Sac3 bind co-transcriptionally to highly expressed genes, accumulating preferentially at their 3′ ends.
Genome-wide replication impairment in sac3Δ cells as detected by Rrm3 accumulation
Genetic instability observed in several mRNA export mutants has been reported to be a consequence of global replication impairment. This has been shown by the genome-wide accumulation of the replicative Rrm3 helicase, which is required for the progression of RFs through obstacles in the DNA, including highly transcribed genes (43,44). To assess whether replication impairment occurs in TREX-2 mutants, ChIP-chip analyses were performed with an Rrm3-FLAG fusion protein in wild-type, thp1Δ and sac3Δ cells, elaborating a genomic map distribution. We found that Rrm3 was distributed all over the genome in the three analyzed strains (Supplementary Figure S8). However, as can be seen in Figure 5, Rrm3 clusters were more abundant in sac3Δ cells (7103 Rrm3 clusters versus 5261 in wild type; 5197 in thp1Δ). The low Rrm3-IP signal in thp1Δ cells may be due to a less efficient immunoprecipitation in this strain as a consequence of its growth defect, which would lead to a lower proportion of cells in S phase and thus a lower detection of Rrm3. Importantly, however, Rrm3 clusters were significantly longer in both mutants (average size of 736 bp in sac3Δ and 620 bp in thp1Δ versus 475 bp in wild type, P < 0.001), covering 32% of the genome in sac3Δ cells and 27% in thp1Δ versus 21% in the wild type. This indicates that replication obstacles accumulate in the absence of Sac3 and Thp1, this effect being stronger in sac3Δ cells, which lack the major subunit of the complex. Western analyses showed that this genome-wide increase in Rrm3 recruitment was not due to an increase in total Rrm3-FLAG protein levels (Supplementary Figure S9). In addition, the percentage of clusters mapping at ORFs was also higher in the mutants than in the wild type (87.6% in sac3Δ and 83% in thp1Δ versus 76.0% in the wild type), consistent with RF stalling occurring preferentially at transcribed genes and correlating with the distribution of Sac3 and Thp1 in these regions (Figures 2–4). The data are consistent with the accumulation of replication stalls in TREX-2 mutants, but the fact that double mutants thp1Δ rrm3Δ and sac3Δ rrm3Δ are viable (Supplementary Figure S10) suggests that Rrm3 is not essential for replication resumption.
Figure 5.
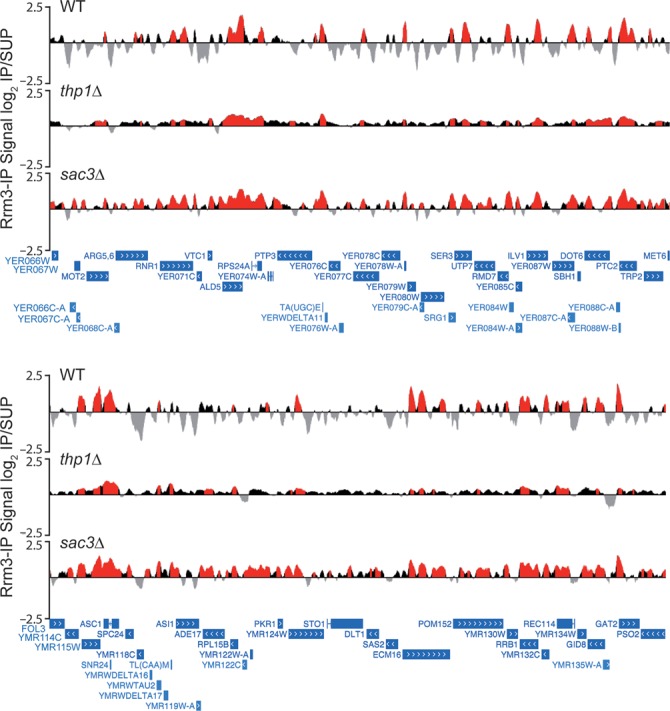
Genome-wide Rrm3 recruitment in thp1Δ and sac3Δ cells. Analysis of Rrm3-FLAG binding to the whole genome by ChIP-chip. Two genomic fragments from chromosomes V and XIII are shown, with enrichment values represented as the signal log2 IP/SUP ratios. Red histograms (online version) represent the significant Rrm3 binding clusters (P < 0.01, minimum run >100 bp, maximum gap <250 bp). Genes and other features are represented according to the SGD.
Analysis of the ORFs mapped by Rrm3 revealed that it was enriched in the same genes in wild-type and mutant cells, plus a high number of additional ones in the mutants, specially in sac3Δ (3926 in the wild type versus 4190 genes in thp1Δ and 5520 genes in sac3Δ; Supplementary Figure S11A), indicating that replication impairment extends to more genes in the absence of Thp1 or Sac3. The enrichment levels of Rrm3 at the common genes were highly correlated between wild type and mutants (R = 0.5143 for thp1Δ and R = 0.7721 for sac3Δ; Supplementary Figure S11B). Interestingly, most genes associated with Thp1 or Sac3 overlapped those in which Rrm3 accumulates, especially with those of the mutants (Supplementary Figure S11C). Correlations of Thp1 and Sac3 enrichment in wild-type cells with Rrm3 enrichment in thp1Δ or sac3Δ cells, respectively, were higher than with Rrm3 enrichment in the wild type (Figure 6A), suggesting that in the absence of both TREX-2 subunits, Rrm3 accumulates at higher levels in the genes to which they bind. Consistently, Thp1 and Sac3 genomic binding profiles were similar to that of Rrm3, in particular in the mutants (Figure 6B). Taken together, these observations indicate that RF stalls preferentially at genes where Thp1 and Sac3 normally act.
Figure 6.
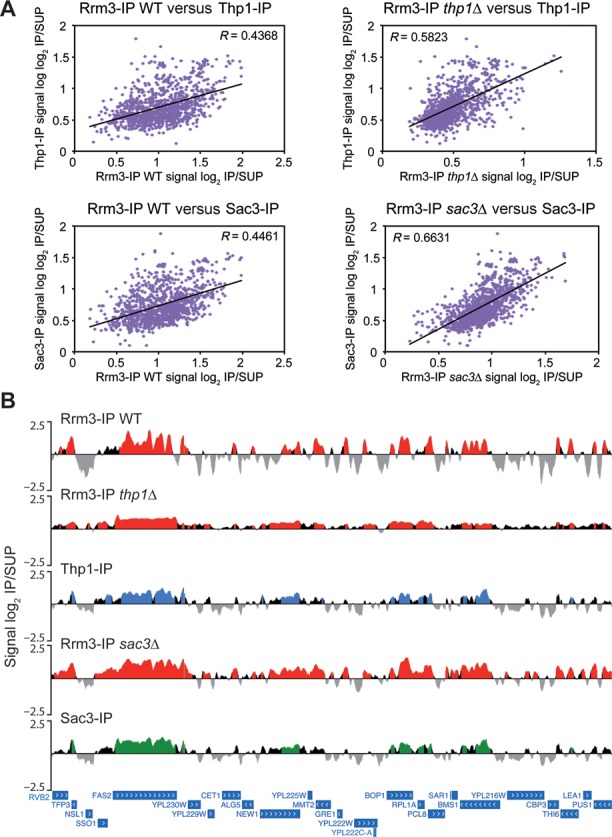
Analysis of Rrm3-enriched genes in wild-type, thp1Δ and sac3Δ cells. (A) Correlation analysis of Thp1, Sac3 and Rrm3 enrichment levels in thp1Δ and sac3Δ cells. Scatter plots showing correlation among Thp1, Sac3 and Rrm3 enrichment levels in the common ORFs detected by ChIP-chip in wild-type and mutant strains, represented as signal log2 IP/SUP ratio. A linear regression line and the Pearson's R correlation coefficient are plotted per graph. The complete list of genes can be found in the Supplementary Dataset II. (B) Similar distribution of Thp1, Sac3 and Rrm3 along the genome. Thp1, Sac3 and Rrm3 binding to a fragment of chromosome XVI detected by ChIP-chip and represented as signal log2 IP/SUP ratio is shown. Red (Rrm3-IP), blue (Thp1-IP) and green (Sac3-IP) histograms (online version) represent the statistically significant protein binding clusters (P < 0.01, minimum run >100 bp, maximum gap <250 bp). Genes and other features are represented according to the SGD.
Rrm3 accumulates at highly transcribed genes in the absence of Sac3
To determine the structural and functional differences between wild-type, thp1Δ and sac3Δ cells in the genes in which Rrm3 accumulates, we selected the top 500 ORFs with the highest signal log2 ratio average in a sliding window of 200 bp, as detected in the ChIP-chip experiments. Statistical analyses revealed that these genes were significantly longer (except for thp1Δ), G+C-richer and more expressed than the genome median (P < 0.001; Figure 7A), consistent with previous results (29,30). Interestingly, genes in which Rrm3 accumulates at the highest level in thp1Δ and sac3Δ cells were more expressed than those of the wild type (P < 0.001; Figure 7A), suggesting that replication stalling preferentially occurs at the highest transcribed genes in the absence of Thp1 and Sac3. This conclusion is also supported by the correlation between Rrm3 enrichment and expression levels in the 3918 genes enriched in Rrm3 that are common between wild-type and sac3Δ cells (R = 0.4106 vs. 0.2289 in the wild type; Supplementary Figure S12), and in the 3394 genes that are common between wild-type and thp1Δ cells (R = 0.6313; Supplementary Figure S12). In addition, gene ontology analyses revealed an overrepresentation of genes involved in processes such as gene expression, transport and ribosome biogenesis (Supplementary Dataset I), consistent with those genes being highly transcribed in yeast.
Figure 7.
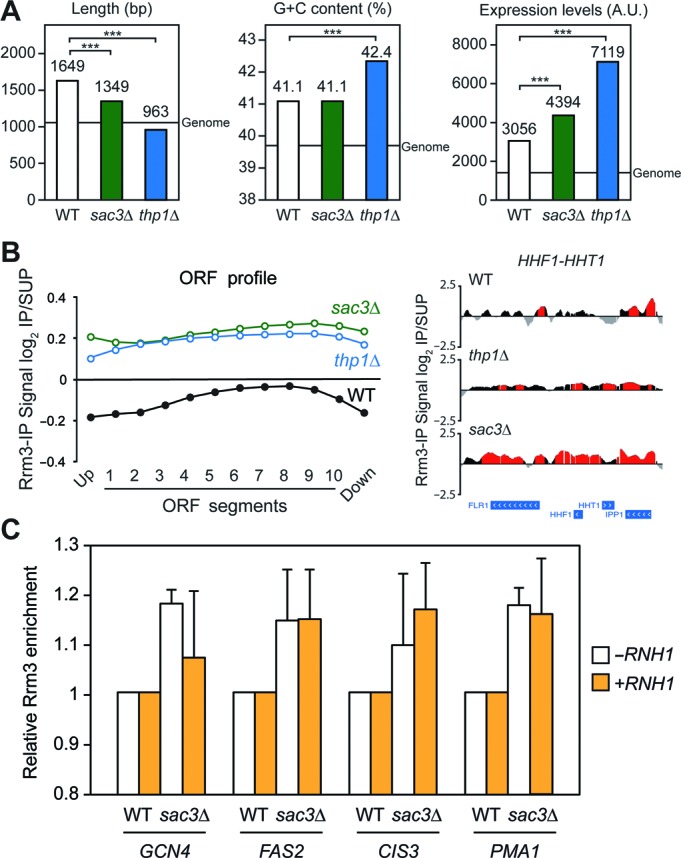
Rrm3 accumulation at highly transcribed genes in the absence of Thp1 and Sac3. (A) Functional and structural features of Rrm3-enriched genes. Statistical analysis of length, G+C content and model-based expression levels of the Top-500 genes showing significant Rrm3 enrichment in wild-type, thp1Δ and sac3Δ cells in ChIP-chip experiments. Median values are shown and a line represents the genome median. ***, P < 0.001 (Mann–Whitney's U-test) as compared to the wild type. The complete list of genes can be found in the Supplementary Dataset II. (B) Rrm3 accumulation at ORFs in thp1Δ and sac3Δ cells. Left, composite profile of Rrm3 occupancy detected by ChIP-chip across the average ORF, plotted as Rrm3 signal log2 IP/SUP ratio average per segment considering total genes, in wild-type, thp1Δ and sac3Δ cells. Right, Rrm3 distribution at the highly transcribed HHF1-HHT1 locus in wild-type and sac3Δ cells, with enrichment values represented as the signal log2 IP/SUP ratio. Red histograms (online version) represent the statistically significant Rrm3 binding clusters (P < 0.01, minimum run >100 bp, maximum gap <250 bp). Genes and other features are represented according to the SGD. (C) Analysis of R-loop-dependence of Rrm3 accumulation in sac3Δ cells. Specific Rrm3-FLAG ChIP analysis using qPCR of four genes showing high Rrm3 enrichment levels in the ChIP-chip experiments, in WRBb-9B (WT) and S3RBb-5B (sac3Δ) strains carrying pCM184 (-RNH1) or pCM184RNH1 (+RNH1) without doxycycline. Data were normalized to wild-type levels. Average and standard error of the mean of three independent experiments are shown.
Next, the relative distribution of Rrm3 along the length of the genes was analyzed, as explained below, using the ChIP-chip data. We found that Rrm3 distribution in wild-type cells increased towards the 3′ end of the genes, being non-detectable or low abundant in the promoter and terminator regions. This accumulation was similar in thp1Δ cells and lower in sac3Δ cells, suggesting that RF stalling occurs more homogeneously throughout the length of the genes in sac3Δ cells (Supplementary Figure S13A). This observation remained the same when genes of different length intervals were plotted (Supplementary Figure S13B). Importantly, we found that the average Rrm3 enrichment levels along the ORFs were higher both in thp1Δ and sac3Δ cells (Figure 7B), indicating that replication obstacles in genes are more abundant in the mutants. We also found Rrm3 enrichment in thp1Δ and sac3Δ cells at centromeres, in some of which Sac3 could also be seen in wild-type cells (Supplementary Figure S4), as well as enrichment in ARSs, introns, snRNAs, snoRNAs and RNAPIII-transcribed genes, including tRNAs (Table 1), with the average Rrm3 levels around centromeres, tRNAs and snoRNAs being higher in the mutants (Supplementary Figure S14). Altogether, these results indicate that replication obstacles accumulate preferentially at the highest transcribed genes when Thp1 or Sac3 are absent and extend to more regions than in the wild type.
Finally, since R loops have been suggested as potentially responsible for the genetic instability phenotypes of TREX-2 mutants (26), we analyzed whether replication stalling was linked to R-loop accumulation in sac3Δ cells. To assess this, we performed specific Rrm3-FLAG ChIP qPCR experiments in selected genes showing high levels of Rrm3 accumulation in the ChIP-chips. As can be seen in Figure 7C, the high levels of Rrm3 observed in sac3Δ cells in these genes were unaffected by RNase H1 overexpression, suggesting that replication stalls detected by Rrm3 are not strictly linked to R-loop accumulation in the sites analyzed.
DISCUSSION
The factors involved in coupling transcription and mRNA export have been largely studied, although little is known about their roles at the genomic level. Here we show by a genome-wide approach that the Thp1 and Sac3 subunits of the yeast TREX-2 complex are involved in the transcriptional control of a large amount of genes, which is better observed in those highly transcribed. They bind to these genes and prevent transcription–replication collisions all over the genome, as determined by the accumulation of Rrm3 in the absence of these proteins. These findings make TREX-2 a relevant player in transcription that helps prevent transcription-associated genome instability all over the genome.
Genome-wide function of Thp1–Sac3 at coding and non-coding transcribed genes
The yeast TREX-2 complex is an important mediator of mRNA export whose mutations lead to mRNA export defects and transcription elongation impairment (12,13,15,16,26,27). Here we show that THP1 and SAC3 deletions have a similar effect over gene expression, consistent with Thp1 and Sac3 working as a functional and structural unit (12,18) (Figure 1). Thus, down-regulated genes in TREX-2 mutants are long, G+C-rich and highly expressed, independently of their function. This is consistent with the transcription impairment observed in TREX-2 mutants using artificial reporters (12,26,27,32), and similar to the features of down-regulated genes in THO mutants (29), suggesting a common mechanism by which suboptimal mRNPs may have a feedback effect on transcription. However, functional differences may exist between THO and TREX-2, as suggested by the clustering and correlation analyses and by previous results. First, the THO complex is believed to act at the first step of the mRNP biogenesis and export pathway, while TREX-2 functions later, close to the NPC (3). Second, overexpression of the export factors Sub2 and Nab2 has different effects on THO and TREX-2 mutants (12,26,34). Thus, it is likely that the differences observed in the global gene expression analyses may reflect a different impact of THO and TREX-2 mutations over transcription and mRNA export. On the other hand, depletion of Sus1, a TREX-2 component that is also part of the H2B deubiquitinylation module of the SAGA complex, leads to a transcriptional profile clearly different from those of THO, thp1Δ and sac3Δ mutants. This is consistent with a differential effect of TREX-2 mutations in transcription elongation (27).
Previous studies have shown that Thp1, as well as the module formed by Sac3, Thp1 and Sem1, binds nucleic acids in vitro (12,18). Despite this, recruitment of Thp1 and/or Sac3 to the chromatin was not previously reported. Here we show that Thp1 and Sac3 bind to transcribed genes in vivo, especially to those long, G+C-rich and highly transcribed (Figures 2–4), according to the features of down-regulated genes in the mutants. This supports a global function of Thp1 and Sac3 in highly transcribed genes. Consistently, several mRNA export factors and NPC components in yeast also associate with transcriptionally active genes (29–31,45,46). Moreover, a recent report showed that human cells depleted of GANP, the Sac3 homolog, had a defect in the export of highly expressed transcripts (47). The genes enriched in Thp1 and Sac3 are also bound by the THO subunit Hpr1, consistent with the idea that both complexes act in the same process. The fact that Hpr1 is enriched in more genes than Thp1 and Sac3 could be due to different detection efficiencies of these proteins, caused by either a lower efficiency of antibody recognition of TREX-2 subunits or a lower stability of Thp1 and Sac3 proteins.
We found that Thp1 and Sac3 accumulate towards the 3′ end of the genes (Figure 4), consistent with their function in transcription elongation and RNA metabolism (26,27). This distribution does not depend on the length of the nascent mRNA and is similar to the 3′-end accumulation of phosphorylated Ser2 in the C-terminus domain (CTD) of the RNAPII, a mark of transcription elongation (48,49). Similar binding distributions have been previously reported for transcription elongation and mRNA export factors (29–31,49). Recruitment of Thp1 and Sac3 to genes might depend on elongation factors or might occur through direct RNA binding or via an indirect interaction with other proteins. One candidate could be the export receptor Mex67-Mtr2, given the interaction of Sac3 with this factor (13). In addition, TREX-2 might play a role in the coordination of 3′-end processing steps, similarly to THO and Sub2 (50,51), contributing to mRNA polyadenylation and/or release from the transcription termination site.
Apart from coding genes, TREX-2 proteins bind to other transcribed sequences, such as snRNAs, snoRNAs and RNAPIII-transcribed genes, including tRNAs (Table 1). This observation is consistent with that observed for other mRNA export factors, such as THO, Npl3 and Nab2 (29,30,52,53), and abrogates for a general function of these proteins in transcription not restricted to coding regions or RNAPII genes. This would imply that TREX-2 functions in the export of RNAPII and non-RNAPII-generated transcripts. Additionally, Sac3 was also found at centromeres (Table 1). This might imply an additional function of TREX-2 related to chromosome segregation and cell division. Indeed, Sac3 and Cdc31, as well as another mammalian Sac3-homolog called Shd1, are required for the duplication of either the spindle pole bodies or centrosomes (25,54,55).
Global function of TREX-2 preventing transcription–replication conflicts
Transcription is known to constitute an obstacle for RF progression and improper transcription and mRNP biogenesis can lead to replication impairment and genome instability (56). Here we show that the replicative Rrm3 helicase, which is required for the RF to pass through obstacles in the DNA, such as transcribed areas (43,44), is strongly accumulated at highly expressed genes in thp1Δ and sac3Δ cells (Figures 5–7). As Thp1 and Sac3 also accumulate in these genes and thp1Δ and sac3Δ mutants are affected in transcription, we propose that the RF progresses less efficiently through highly transcribed regions due to the lack of either Thp1 or Sac3, leading to the detected replication impairment. These data agree with the TAR phenotype of TREX-2 mutants (12,26,32). It is worth noting that changes in the Rrm3 presence in sac3Δ cells is not linked to R-loop accumulation at the four sites analyzed. This result resembles the situation of human cells depleted of TREX-2 components, which does not accumulate detectable levels of R loops (57). However, as it is known that RNase H1 overexpression does not completely suppress the genome instability phenotypes of THO and TREX-2 mutants (26,58), it seems clear that not all events related to genome instability are mediated by R-loops in TREX-2 mutants, even though they are mediated by the RNA molecule (26). An interesting possibility to explore in the future would be whether this phenomenon is mainly related to a different anchoring of transcribed genes to NPCs in these mutants (59). This could be consistent with an early role of THO in RNA metabolism and a later role of TREX-2, as deduced from the different protein composition of the mRNPs depending on whether they are purified using 5′-end RNA processing proteins versus NPC components (60).
In addition to coding genes, replication obstacles extend to other regions, in agreement with Thp1–Sac3 distribution. Similar Rrm3 accumulation has been detected in other mRNA-processing mutants, such as hpr1Δ or npl3Δ (29,30). Furthermore, anchoring of genes to the NPC during transcription may generate topological constraints that could constitute an obstacle for replication. In agreement with this idea, it has been proposed that the DNA damage checkpoint in yeast is required for the release of transcribed genes from the NPC to facilitate RF progression, since mutations in THO, TREX-2 and some nucleoporins rescue the RF defects of DNA-damage checkpoint mutants (59). In contrast, our results indicate that the absence of Thp1 or Sac3 in cells with an intact checkpoint leads to an increase of replication stalls.
Therefore, this work provides evidence of a function of TREX-2 complex at the genome-wide level, especially at highly expressed genes, and supports the current model that improper mRNP biogenesis can lead to global replication impairment and genome instability. Further work will be required to decipher the molecular nature of these events and the role of the nascent mRNA. Given the high conservation of TREX-2, It would also be interesting to study whether similar mechanisms act in higher eukaryotes.
ACCESSION NUMBERS
Microarray and ChIP-chip data can be accessed at Gene Expression Omnibus (GSE56703, GSE56702, GSE56700).
SUPPLEMENTARY DATA
Supplementary Data are available at NAR Online.
Acknowledgments
We would like to thank E. Andújar and M. Pérez-Alegre (Genomics Unit, CABIMER) for technical support with microarray and ChIP-chip experiments, A. Marín (Genetics Department, University of Seville) for assistance with the computational analysis and D. Haun for style supervision.
FUNDING
Spanish Ministry of Economy and Competitiveness [BFU2010-16372]; Junta de Andalucía [CVI4567 and P12/BIO-1238]; European Union (FEDER); and a JAE predoctoral training grant from the Spanish Research Council (CSIC) [to J.M.S-P.]. Funding for open access charge: Spanish Ministry of Economy and Competitiveness [BFU2010-16372].
Conflict of interest statement. None declared.
REFERENCES
- 1.Perales R., Bentley D. ‘Cotranscriptionality’: the transcription elongation complex as a nexus for nuclear transactions. Mol. Cell. 2009;36:178–191. doi: 10.1016/j.molcel.2009.09.018. [DOI] [PMC free article] [PubMed] [Google Scholar]
- 2.Kohler A., Hurt E. Exporting RNA from the nucleus to the cytoplasm. Nat. Rev. Mol. Cell Biol. 2007;8:761–773. doi: 10.1038/nrm2255. [DOI] [PubMed] [Google Scholar]
- 3.Rondon A.G., Jimeno S., Aguilera A. The interface between transcription and mRNP export: from THO to THSC/TREX-2. Biochim. Biophys. Acta. 2010;1799:533–538. doi: 10.1016/j.bbagrm.2010.06.002. [DOI] [PubMed] [Google Scholar]
- 4.Akhtar A., Gasser S.M. The nuclear envelope and transcriptional control. Nat. Rev. Genet. 2007;8:507–517. doi: 10.1038/nrg2122. [DOI] [PubMed] [Google Scholar]
- 5.Blobel G. Gene gating: a hypothesis. Proc. Natl. Acad. Sci. U.S.A. 1985;82:8527–8529. doi: 10.1073/pnas.82.24.8527. [DOI] [PMC free article] [PubMed] [Google Scholar]
- 6.Cabal G.G., Genovesio A., Rodriguez-Navarro S., Zimmer C., Gadal O., Lesne A., Buc H., Feuerbach-Fournier F., Olivo-Marin J.C., Hurt E.C., et al. SAGA interacting factors confine sub-diffusion of transcribed genes to the nuclear envelope. Nature. 2006;441:770–773. doi: 10.1038/nature04752. [DOI] [PubMed] [Google Scholar]
- 7.Dieppois G., Iglesias N., Stutz F. Cotranscriptional recruitment to the mRNA export receptor Mex67p contributes to nuclear pore anchoring of activated genes. Mol. Cell. Biol. 2006;26:7858–7870. doi: 10.1128/MCB.00870-06. [DOI] [PMC free article] [PubMed] [Google Scholar]
- 8.Kurshakova M.M., Krasnov A.N., Kopytova D.V., Shidlovskii Y.V., Nikolenko J.V., Nabirochkina E.N., Spehner D., Schultz P., Tora L., Georgieva S.G. SAGA and a novel Drosophila export complex anchor efficient transcription and mRNA export to NPC. EMBO J. 2007;26:4956–4965. doi: 10.1038/sj.emboj.7601901. [DOI] [PMC free article] [PubMed] [Google Scholar]
- 9.Kohler A., Schneider M., Cabal G.G., Nehrbass U., Hurt E. Yeast Ataxin-7 links histone deubiquitination with gene gating and mRNA export. Nat. Cell Biol. 2008;10:707–715. doi: 10.1038/ncb1733. [DOI] [PubMed] [Google Scholar]
- 10.Chekanova J.A., Abruzzi K.C., Rosbash M., Belostotsky D.A. Sus1, Sac3, and Thp1 mediate post-transcriptional tethering of active genes to the nuclear rim as well as to non-nascent mRNP. RNA. 2008;14:66–77. doi: 10.1261/rna.764108. [DOI] [PMC free article] [PubMed] [Google Scholar]
- 11.Luthra R., Kerr S.C., Harreman M.T., Apponi L.H., Fasken M.B., Ramineni S., Chaurasia S., Valentini S.R., Corbett A.H. Actively transcribed GAL genes can be physically linked to the nuclear pore by the SAGA chromatin modifying complex. J. Biol. Chem. 2007;282:3042–3049. doi: 10.1074/jbc.M608741200. [DOI] [PubMed] [Google Scholar]
- 12.Gallardo M., Luna R., Erdjument-Bromage H., Tempst P., Aguilera A. Nab2p and the Thp1p-Sac3p complex functionally interact at the interface between transcription and mRNA metabolism. J. Biol. Chem. 2003;278:24225–24232. doi: 10.1074/jbc.M302900200. [DOI] [PubMed] [Google Scholar]
- 13.Fischer T., Strasser K., Racz A., Rodriguez-Navarro S., Oppizzi M., Ihrig P., Lechner J., Hurt E. The mRNA export machinery requires the novel Sac3p-Thp1p complex to dock at the nucleoplasmic entrance of the nuclear pores. EMBO J. 2002;21:5843–5852. doi: 10.1093/emboj/cdf590. [DOI] [PMC free article] [PubMed] [Google Scholar]
- 14.Fischer T., Rodriguez-Navarro S., Pereira G., Racz A., Schiebel E., Hurt E. Yeast centrin Cdc31 is linked to the nuclear mRNA export machinery. Nat. Cell Biol. 2004;6:840–848. doi: 10.1038/ncb1163. [DOI] [PubMed] [Google Scholar]
- 15.Rodriguez-Navarro S., Fischer T., Luo M.J., Antunez O., Brettschneider S., Lechner J., Perez-Ortin J.E., Reed R., Hurt E. Sus1, a functional component of the SAGA histone acetylase complex and the nuclear pore-associated mRNA export machinery. Cell. 2004;116:75–86. doi: 10.1016/s0092-8674(03)01025-0. [DOI] [PubMed] [Google Scholar]
- 16.Faza M.B., Kemmler S., Jimeno S., Gonzalez-Aguilera C., Aguilera A., Hurt E., Panse V.G. Sem1 is a functional component of the nuclear pore complex-associated messenger RNA export machinery. J. Cell Biol. 2009;184:833–846. doi: 10.1083/jcb.200810059. [DOI] [PMC free article] [PubMed] [Google Scholar]
- 17.Wilmes G.M., Bergkessel M., Bandyopadhyay S., Shales M., Braberg H., Cagney G., Collins S.R., Whitworth G.B., Kress T.L., Weissman J.S., et al. A genetic interaction map of RNA-processing factors reveals links between Sem1/Dss1-containing complexes and mRNA export and splicing. Mol. Cell. 2008;32:735–746. doi: 10.1016/j.molcel.2008.11.012. [DOI] [PMC free article] [PubMed] [Google Scholar]
- 18.Ellisdon A.M., Dimitrova L., Hurt E., Stewart M. Structural basis for the assembly and nucleic acid binding of the TREX-2 transcription-export complex. Nat. Struct. Mol. Biol. 2012;19:328–336. doi: 10.1038/nsmb.2235. [DOI] [PMC free article] [PubMed] [Google Scholar]
- 19.Jani D., Lutz S., Marshall N.J., Fischer T., Kohler A., Ellisdon A.M., Hurt E., Stewart M. Sus1, Cdc31, and the Sac3 CID region form a conserved interaction platform that promotes nuclear pore association and mRNA export. Mol. Cell. 2009;33:727–737. doi: 10.1016/j.molcel.2009.01.033. [DOI] [PMC free article] [PubMed] [Google Scholar]
- 20.Lei E.P., Stern C.A., Fahrenkrog B., Krebber H., Moy T.I., Aebi U., Silver P.A. Sac3 is an mRNA export factor that localizes to cytoplasmic fibrils of nuclear pore complex. Mol. Biol. Cell. 2003;14:836–847. doi: 10.1091/mbc.E02-08-0520. [DOI] [PMC free article] [PubMed] [Google Scholar]
- 21.Jani D., Valkov E., Stewart M. Structural basis for binding the TREX2 complex to nuclear pores, GAL1 localisation and mRNA export. Nucleic Acids Res. 2014;42:6686–6697. doi: 10.1093/nar/gku252. [DOI] [PMC free article] [PubMed] [Google Scholar]
- 22.Jani D., Lutz S., Hurt E., Laskey R.A., Stewart M., Wickramasinghe V.O. Functional and structural characterization of the mammalian TREX-2 complex that links transcription with nuclear messenger RNA export. Nucleic Acids Res. 2012;40:4562–4573. doi: 10.1093/nar/gks059. [DOI] [PMC free article] [PubMed] [Google Scholar]
- 23.Umlauf D., Bonnet J., Waharte F., Fournier M., Stierle M., Fischer B., Brino L., Devys D., Tora L. The human TREX-2 complex is stably associated with the nuclear pore basket. J. Cell Sci. 2013;126:2656–2667. doi: 10.1242/jcs.118000. [DOI] [PubMed] [Google Scholar]
- 24.Kohler A., Pascual-Garcia P., Llopis A., Zapater M., Posas F., Hurt E., Rodriguez-Navarro S. The mRNA export factor Sus1 is involved in Spt/Ada/Gcn5 acetyltransferase-mediated H2B deubiquitinylation through its interaction with Ubp8 and Sgf11. Mol. Biol. Cell. 2006;17:4228–4236. doi: 10.1091/mbc.E06-02-0098. [DOI] [PMC free article] [PubMed] [Google Scholar]
- 25.Ivanovska I., Rose M.D. Fine structure analysis of the yeast centrin, Cdc31p, identifies residues specific for cell morphology and spindle pole body duplication. Genetics. 2001;157:503–518. doi: 10.1093/genetics/157.2.503. [DOI] [PMC free article] [PubMed] [Google Scholar]
- 26.Gonzalez-Aguilera C., Tous C., Gomez-Gonzalez B., Huertas P., Luna R., Aguilera A. The THP1-SAC3-SUS1-CDC31 complex works in transcription elongation-mRNA export preventing RNA-mediated genome instability. Mol. Biol. Cell. 2008;19:4310–4318. doi: 10.1091/mbc.E08-04-0355. [DOI] [PMC free article] [PubMed] [Google Scholar]
- 27.Tous C., Rondon A.G., Garcia-Rubio M., Gonzalez-Aguilera C., Luna R., Aguilera A. A novel assay identifies transcript elongation roles for the Nup84 complex and RNA processing factors. EMBO J. 2011;30:1953–1964. doi: 10.1038/emboj.2011.109. [DOI] [PMC free article] [PubMed] [Google Scholar]
- 28.Rondon A.G., Jimeno S., Garcia-Rubio M., Aguilera A. Molecular evidence that the eukaryotic THO/TREX complex is required for efficient transcription elongation. J. Biol. Chem. 2003;278:39037–39043. doi: 10.1074/jbc.M305718200. [DOI] [PubMed] [Google Scholar]
- 29.Gomez-Gonzalez B., Garcia-Rubio M., Bermejo R., Gaillard H., Shirahige K., Marin A., Foiani M., Aguilera A. Genome-wide function of THO/TREX in active genes prevents R-loop-dependent replication obstacles. EMBO J. 2011;30:3106–3119. doi: 10.1038/emboj.2011.206. [DOI] [PMC free article] [PubMed] [Google Scholar]
- 30.Santos-Pereira J.M., Herrero A.B., Garcia-Rubio M.L., Marin A., Moreno S., Aguilera A. The Npl3 hnRNP prevents R-loop-mediated transcription-replication conflicts and genome instability. Genes Dev. 2013;27:2445–2458. doi: 10.1101/gad.229880.113. [DOI] [PMC free article] [PubMed] [Google Scholar]
- 31.Johnson S.A., Kim H., Erickson B., Bentley D.L. The export factor Yra1 modulates mRNA 3′ end processing. Nat. Struct. Mol. Biol. 2011;18:1164–1171. doi: 10.1038/nsmb.2126. [DOI] [PMC free article] [PubMed] [Google Scholar]
- 32.Gallardo M., Aguilera A. A new hyperrecombination mutation identifies a novel yeast gene, THP1, connecting transcription elongation with mitotic recombination. Genetics. 2001;157:79–89. doi: 10.1093/genetics/157.1.79. [DOI] [PMC free article] [PubMed] [Google Scholar]
- 33.Gaillard H., Herrera-Moyano E., Aguilera A. Transcription-associated genome instability. Chem. Rev. 2013;113:8638–8661. doi: 10.1021/cr400017y. [DOI] [PubMed] [Google Scholar]
- 34.Jimeno S., Rondon A.G., Luna R., Aguilera A. The yeast THO complex and mRNA export factors link RNA metabolism with transcription and genome instability. EMBO J. 2002;21:3526–3535. doi: 10.1093/emboj/cdf335. [DOI] [PMC free article] [PubMed] [Google Scholar]
- 35.Gomez-Gonzalez B., Aguilera A. Activation-induced cytidine deaminase action is strongly stimulated by mutations of the THO complex. Proc. Natl. Acad. Sci. U.S.A. 2007;104:8409–8414. doi: 10.1073/pnas.0702836104. [DOI] [PMC free article] [PubMed] [Google Scholar]
- 36.Gari E., Piedrafita L., Aldea M., Herrero E. A set of vectors with a tetracycline-regulatable promoter system for modulated gene expression in Saccharomyces cerevisiae. Yeast. 1997;13:837–848. doi: 10.1002/(SICI)1097-0061(199707)13:9<837::AID-YEA145>3.0.CO;2-T. [DOI] [PubMed] [Google Scholar]
- 37.Bermejo R., Capra T., Gonzalez-Huici V., Fachinetti D., Cocito A., Natoli G., Katou Y., Mori H., Kurokawa K., Shirahige K., et al. Genome-organizing factors Top2 and Hmo1 prevent chromosome fragility at sites of S phase transcription. Cell. 2009;138:870–884. doi: 10.1016/j.cell.2009.06.022. [DOI] [PubMed] [Google Scholar]
- 38.Katou Y., Kaneshiro K., Aburatani H., Shirahige K. Genomic approach for the understanding of dynamic aspect of chromosome behavior. Methods Enzymol. 2006;409:389–410. doi: 10.1016/S0076-6879(05)09023-3. [DOI] [PubMed] [Google Scholar]
- 39.Li C., Wong W.H. Model-based analysis of oligonucleotide arrays: expression index computation and outlier detection. Proc. Natl. Acad. Sci. U.S.A. 2001;98:31–36. doi: 10.1073/pnas.011404098. [DOI] [PMC free article] [PubMed] [Google Scholar]
- 40.Hecht A., Strahl-Bolsinger S., Grunstein M. Mapping DNA interaction sites of chromosomal proteins. Crosslinking studies in yeast. Methods Mol. Biol. 1999;119:469–479. doi: 10.1385/1-59259-681-9:469. [DOI] [PubMed] [Google Scholar]
- 41.Huertas P., Garcia-Rubio M.L., Wellinger R.E., Luna R., Aguilera A. An hpr1 point mutation that impairs transcription and mRNP biogenesis without increasing recombination. Mol. Cell. Biol. 2006;26:7451–7465. doi: 10.1128/MCB.00684-06. [DOI] [PMC free article] [PubMed] [Google Scholar]
- 42.Marin A., Gallardo M., Kato Y., Shirahige K., Gutierrez G., Ohta K., Aguilera A. Relationship between G+C content, ORF-length and mRNA concentration in Saccharomyces cerevisiae. Yeast. 2003;20:703–711. doi: 10.1002/yea.992. [DOI] [PubMed] [Google Scholar]
- 43.Azvolinsky A., Giresi P.G., Lieb J.D., Zakian V.A. Highly transcribed RNA polymerase II genes are impediments to replication fork progression in Saccharomyces cerevisiae. Mol. Cell. 2009;34:722–734. doi: 10.1016/j.molcel.2009.05.022. [DOI] [PMC free article] [PubMed] [Google Scholar]
- 44.Ivessa A.S., Lenzmeier B.A., Bessler J.B., Goudsouzian L.K., Schnakenberg S.L., Zakian V.A. The Saccharomyces cerevisiae helicase Rrm3p facilitates replication past nonhistone protein-DNA complexes. Mol. Cell. 2003;12:1525–1536. doi: 10.1016/s1097-2765(03)00456-8. [DOI] [PubMed] [Google Scholar]
- 45.Casolari J.M., Brown C.R., Komili S., West J., Hieronymus H., Silver P.A. Genome-wide localization of the nuclear transport machinery couples transcriptional status and nuclear organization. Cell. 2004;117:427–439. doi: 10.1016/s0092-8674(04)00448-9. [DOI] [PubMed] [Google Scholar]
- 46.Gwizdek C., Iglesias N., Rodriguez M.S., Ossareh-Nazari B., Hobeika M., Divita G., Stutz F., Dargemont C. Ubiquitin-associated domain of Mex67 synchronizes recruitment of the mRNA export machinery with transcription. Proc. Natl. Acad. Sci. U.S.A. 2006;103:16376–16381. doi: 10.1073/pnas.0607941103. [DOI] [PMC free article] [PubMed] [Google Scholar]
- 47.Wickramasinghe V.O., Andrews R., Ellis P., Langford C., Gurdon J.B., Stewart M., Venkitaraman A.R., Laskey R.A. Selective nuclear export of specific classes of mRNA from mammalian nuclei is promoted by GANP. Nucleic Acids Res. 2014;42:5059–5071. doi: 10.1093/nar/gku095. [DOI] [PMC free article] [PubMed] [Google Scholar]
- 48.Kim H., Erickson B., Luo W., Seward D., Graber J.H., Pollock D.D., Megee P.C., Bentley D.L. Gene-specific RNA polymerase II phosphorylation and the CTD code. Nat. Struct. Mol. Biol. 2010;17:1279–1286. doi: 10.1038/nsmb.1913. [DOI] [PMC free article] [PubMed] [Google Scholar]
- 49.Mayer A., Lidschreiber M., Siebert M., Leike K., Soding J., Cramer P. Uniform transitions of the general RNA polymerase II transcription complex. Nat. Struct. Mol. Biol. 2010;17:1272–1278. doi: 10.1038/nsmb.1903. [DOI] [PubMed] [Google Scholar]
- 50.Rougemaille M., Dieppois G., Kisseleva-Romanova E., Gudipati R.K., Lemoine S., Blugeon C., Boulay J., Jensen T.H., Stutz F., Devaux F., et al. THO/Sub2p functions to coordinate 3′-end processing with gene-nuclear pore association. Cell. 2008;135:308–321. doi: 10.1016/j.cell.2008.08.005. [DOI] [PubMed] [Google Scholar]
- 51.Saguez C., Schmid M., Olesen J.R., Ghazy M.A., Qu X., Poulsen M.B., Nasser T., Moore C., Jensen T.H. Nuclear mRNA surveillance in THO/sub2 mutants is triggered by inefficient polyadenylation. Mol. Cell. 2008;31:91–103. doi: 10.1016/j.molcel.2008.04.030. [DOI] [PubMed] [Google Scholar]
- 52.Gonzalez-Aguilera C., Tous C., Babiano R., de la Cruz J., Luna R., Aguilera A. Nab2 functions in the metabolism of RNA driven by polymerases II and III. Mol. Biol. Cell. 2011;22:2729–2740. doi: 10.1091/mbc.E11-01-0055. [DOI] [PMC free article] [PubMed] [Google Scholar]
- 53.Larochelle M., Lemay J.F., Bachand F. The THO complex cooperates with the nuclear RNA surveillance machinery to control small nucleolar RNA expression. Nucleic Acids Res. 2012;40:10240–10253. doi: 10.1093/nar/gks838. [DOI] [PMC free article] [PubMed] [Google Scholar]
- 54.Jones A.L., Quimby B.B., Hood J.K., Ferrigno P., Keshava P.H., Silver P.A., Corbett A.H. SAC3 may link nuclear protein export to cell cycle progression. Proc. Natl. Acad. Sci. U.S.A. 2000;97:3224–3229. doi: 10.1073/pnas.050432997. [DOI] [PMC free article] [PubMed] [Google Scholar]
- 55.Khuda S.E., Yoshida M., Xing Y., Shimasaki T., Takeya M., Kuwahara K., Sakaguchi N. The Sac3 homologue shd1 is involved in mitotic progression in mammalian cells. J. Biol. Chem. 2004;279:46182–46190. doi: 10.1074/jbc.M405347200. [DOI] [PubMed] [Google Scholar]
- 56.Aguilera A., Garcia-Muse T. Causes of genome instability. Annu. Rev. Genet. 2013;47:1–32. doi: 10.1146/annurev-genet-111212-133232. [DOI] [PubMed] [Google Scholar]
- 57.Bhatia V., Barroso S.I., Garcia-Rubio M.L., Tumini E., Herrera-Moyano E., Aguilera A. BRCA2 prevents R-loop accumulation and associates with TREX-2 mRNA export factor PCID2. Nature. 2014;511:362–365. doi: 10.1038/nature13374. [DOI] [PubMed] [Google Scholar]
- 58.Huertas P., Aguilera A. Cotranscriptionally formed DNA:RNA hybrids mediate transcription elongation impairment and transcription-associated recombination. Mol. Cell. 2003;12:711–721. doi: 10.1016/j.molcel.2003.08.010. [DOI] [PubMed] [Google Scholar]
- 59.Bermejo R., Capra T., Jossen R., Colosio A., Frattini C., Carotenuto W., Cocito A., Doksani Y., Klein H., Gomez-Gonzalez B., et al. The replication checkpoint protects fork stability by releasing transcribed genes from nuclear pores. Cell. 2011;146:233–246. doi: 10.1016/j.cell.2011.06.033. [DOI] [PMC free article] [PubMed] [Google Scholar]
- 60.Bretes H., Rouviere J.O., Leger T., Oeffinger M., Devaux F., Doye V., Palancade B. Sumoylation of the THO complex regulates the biogenesis of a subset of mRNPs. Nucleic Acids Res. 2014;42:5043–5058. doi: 10.1093/nar/gku124. [DOI] [PMC free article] [PubMed] [Google Scholar]
Associated Data
This section collects any data citations, data availability statements, or supplementary materials included in this article.