

Abstract
Protein degradation is a regulatory process essential to cell viability, and its dysfunction is implicated in many diseases such as aging and neurodegeneration. Here we report stimulated Raman scattering microscopy coupled with metabolic labeling of 13C-phenylalanine to visualize protein degradation in living cells with subcellular resolution. We choose the ring breathing modes of endogenous 12C-phenylalanine and incorporated 13C-phenylalanine as protein markers for the original and nascent proteome, respectively, and quantified the decay of the former through ratio maps. We demonstrated time dependent imaging of proteomic degradation in mammalian cells under steady-state condition and various perturbations including oxidative stress, cell differentiation, and huntingtin protein aggregation.
Keywords: isotopes, protein aggregation, protein degradation, Raman spectroscopy, SRS microscopy
Proteins that are abnormal or no longer in function are actively removed by protein degradation. It is essential to cell viability as a regulatory control in response to physiological and pathological cues[1]. Indeed, disruption of proteolysis machinery has been implicated in aging and neurodegenerative disorders, where cells are exposed to the danger of oxidatively damaged proteins or aggregation-prone proteins.[2,3] Extensive efforts have been made to quantify cellular protein degradation. Traditional autoradiography uses pulse-chase labeling of radioactive amino acids (e.g., 35S-methionine) with the treatment of protein synthesis inhibitor.[4] Later, Stable Isotope Labeling by Amino Acids in Cell Culture (SILAC) was developed in tandem with mass spectrometry, through quantifying the relative amount of ‘heavy’ and ‘light’ peptides.[5–7] However, both of them measure proteome from a collective lysed cell culture and are unable to reveal cell-cell or subcellular variation. Even when coupled to secondary ion microscopy in multi-isotope imaging mass spectrometry (MIMS), its invasive detection does not allow live cell measurement.[8,9] Besides autoradiography and mass spectrometry, fluorescence reporter library has enabled proteome half life determination after a photo-bleach chase.[10] But it requires creation of genomic fusion library, thus is not generally applicable to all cell types.
Here we report a general strategy that visualizes the degradation of the overall proteome in living cells with subcellular resolution by coupling metabolic labeling of 13C-phenylalanine (13C-Phe) with stimulated Raman scattering (SRS) microscopy. Specifically, we choose the characteristic ring-breathing modes of endogenous 12C-Phe and metabolically incorporated 13C-Phe as the Raman spectroscopic markers for the old and new proteome, respectively. Proteomic degradation can then be imaged by SRS in living cells by ratio maps of 12C/(12C+13C), where total proteome is represented by the sum of 12C-Phe and 13C-Phe. We show the utility of our technique by measuring quasi steady-state proteome degradation in mammalian cell lines and mouse hippocampal neurons, as well as studying perturbation caused by oxidative stress, cell differentiation and protein aggregation process. Technically, this is the first time that 13C-labeled amino acid is used together with nonlinear vibrational microscopy. Biologically, our proteome imaging method is capable of revealing cell’s global metabolic activity with exquisite spatial resolution.
The choice of phenylalanine as proteome marker is critical for labeling. First, since it is an essential amino acid that has to be supplied in culture medium, the metabolic incorporation of its 13C isotopologue could distinguish the nascent proteome from the original. Second, its ring-breathing mode exhibits a strong, isolated sharp peak (FWHM~10 cm−1) at 1004 cm−1 (Figure 1a, black; Figure S1a), enabling a resolvable shift upon 13C substitution. In contrast, Amide I band (around 1655 cm−1) and CH3 stretching (around 2940cm−1) (Figure S1a) as protein markers[11–14] are not only broadband but also suffer from severe interference from lipids (around 1650 cm−1 and 2850 cm−1), nucleic acids (around 2950 cm−1), and water (around 3100 cm−1). Third, compared to the protein-bound phenylalanine concentration of 90 mM[15], the intracellular free phenylalanine pool (0.5 mM)[16] is essentially negligible. Moreover, since 13C-Phe is supplied in large excess, 12C-Phe from degraded proteins is seldom recycled. Microscopy wise, the advantage of SRS microscopy (Figure 1b) lies in its superb sensitivity, well-preserved spectra, and linear concentration dependence, thus is well suited for quantitative live imaging.[13,17–19] On contrary, another nonlinear microscopy, coherent anti-Stokes Raman scattering, has drawbacks such as non-resonant background, spectral distortion, complex concentration dependence, and coherent image artifact.[20]
Figure 1.

13C-Phe labeling combined with SRS microscopy. a) Spontaneous Raman spectra of 12C-Phe (black) and 13C-Phe (red) with vibrational frequency shift from 1004 cm−1 to 968 cm−1. Inset shows the structure of phenylalanine with 13C sites denoted by red dots. b) Experimental setup of SRS microscopy.
We first tested the vibrational frequency shift of phenylalanine by 13C labeling. As vibration frequency is inversely proportional to the square root of reduced mass, and also taking H atoms into account, the Raman peak of uniformly-13C-labeled phenylalanine (i.e., 13C-Phe) should red shift to , which is close to the measured 968 cm−1 in buffer solution (Figure 1a, red). This peak shift has also been observed in microbes fed with 13C-glucose.[21] Some attention needs to be paid to the signal extraction as both 12C- and 13C- Phe Raman peaks sit on a flat baseline (950~1050 cm−1) (Figure S1a). Since SRS preserves spontaneous Raman spectrum (Figure S1b), we adopt a simple and robust subtraction strategy to determine the net phenylalanine signal: using the central valley at 986 cm−1 to represent the baseline background and then subtracting it from images at the two peaks (968 cm−1 and 1004 cm−1). Besides, we notice that there is a smaller peak from 13C-Phe overlapping with the 1004 cm−1 peak of 12C-Phe. After treating this as a linear contribution from 13C channel to 12C channel with a coefficient of 0.14, we can obtain pure 13C and 12C signals as I(13C) = I968 − I986 and I(12C) = I1004 − I986 − 0.14 · I(13C), I represents the intensity from spectrum or image.
We then demonstrated our method in cultured HeLa cells. After cells were incubated with 0.8 mM 13C-Phe substituted medium, time dependent spontaneous Raman spectra were measured (Figure 2) from fixed cells. The endogenous 12C peak shows an apparent decay while the 13C peak increases concurrently over time, proving the success of metabolic incorporation. The normalized ratios (12C/(12C+13C)) verses time were fitted with an exponential decay (τ = 43±4 hrs) (Figure 2, inset). To obtain ratio maps, we set up SRS microscope similarly as previously described (Figure 1b, Supporting Information).[11] Live cell SRS images were acquired at 3 Raman shifts (968 cm−1, 986 cm−1, 1004 cm−1) (Figure S2). After background subtraction, gradual weakening of the resulting 12C channels clearly indicates the degradation of old proteome (Figure 3a). As expected, the amount of total proteome almost remains unchanged in quasi steady state, as confirmed by the sum images of 12C and 13C channels (Figure S2). Ratio maps were calculated as normalized 12C/(12C+13C) to account for cell-cell variation and laser power fluctuation. One can readily infer how fast the degradation is from these ratio maps. To compare our results with those collective cell culture results, we fitted averaged ratios with single exponential decay (τ = 40±1 hrs) (Figure 3b). This is close to what was determined earlier from the spectra and also matches the 35 hrs reported using mass spectrometry.[22]
Figure 2.
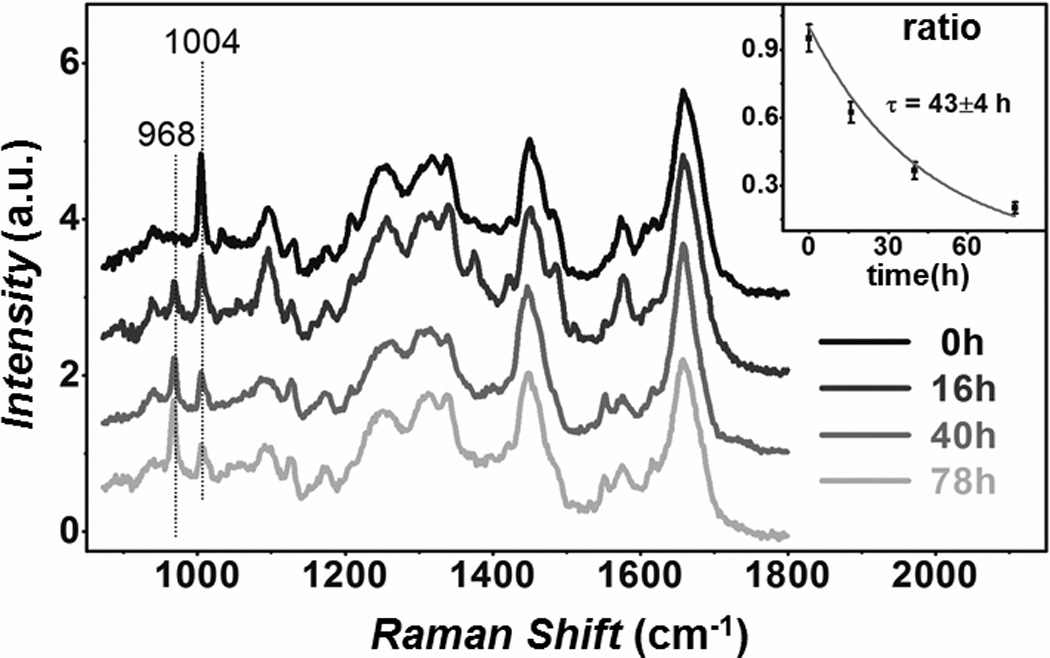
Time dependent spontaneous Raman spectra of HeLa cells with 80 sec acquisition, showing a decline of 1004 cm−1 peak and a rise of 968 cm−1 peak. The valley at 986 cm−1 is used in background subtraction for SRS images. Inset: single exponential fitting of 12C/(12C+13C) ratio obtained from spectra.
Figure 3.
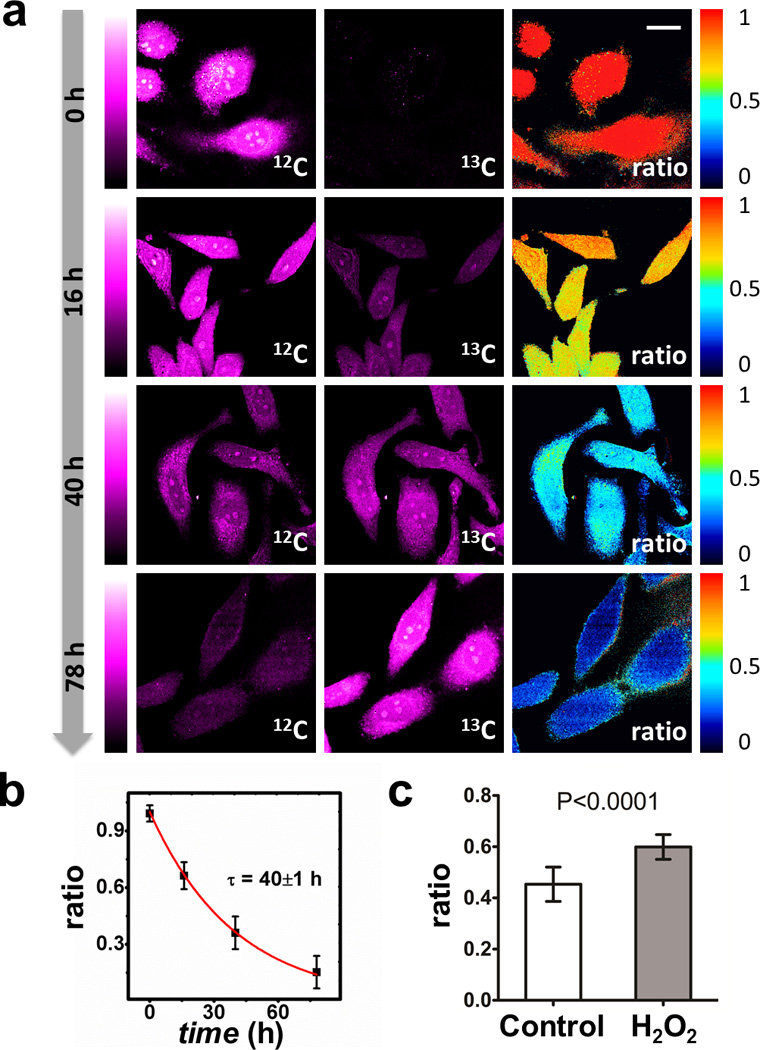
SRS images reveal protein degradation kinetics in HeLa cells. a) Background subtracted SRS images and ratio maps of HeLa cells show obvious decay in 12C channel and increase in 13C channel over time. Ratio images decay from ~1.0 to ~0.2. Scale bar, 20 µm. b) Single exponential fitting of 12C ratio obtained from SRS images. Error bar, standard deviation of ratio. c) Treatment of H2O2 results in a slower degradation in HeLa cells incubated with 13C-Phe for 24 hrs. Control: 0.45±0.07, n=12; H2O2 treated: 0.600.05, n=14. n is number of cells analyzed.
We also examined the effect of oxidative stress on protein turnover. Reactive oxygen species (ROS) production and cellular anti-oxidant defense are normally balanced as part of homeostasis. However, under severe oxidative stress, accumulation of ROS will harm the proteolysis machinery thus retarding protein degradation.[2,23] We determined the proteomic degradation of HeLa cells treated with 200 µM H2O2 by 24 hr 13C-Phe labeling. Cells treated with H2O2 exhibit a ~25% higher 12C ratio than control, indicating a slower protein degradation under oxidative stress (Figure 3c).
Our technique could readily be applied to study protein degradation of other cell lines or primary cells under either steady state or differentiation conditions. For example, in live HEK293T cells (Figure S3), they were found to follow similar decay patterns but exhibited a faster kinetics (τ= 33±3 hrs, Figure S4). This is reasonable due to their faster growth than HeLa cells. We went on to demonstrate in primary mouse hippocampal neuron culture (Figure S5a) using same concentration of 13C-Phe. Protein degradation clearly takes place after 24 hr, but much more slowly (Figure S5b), in consistence with the profound metabolic difference between neurons (post-mitotic) and HeLa or HEK293T cells (immortal). We further obtained SRS images during PC12 cell differentiation induced by NGF-β in the presence of 13C-Phe (Figure 4), which reveals protein degradation kinetics with τ= 48±10 hrs (Figure S4).
Figure 4.
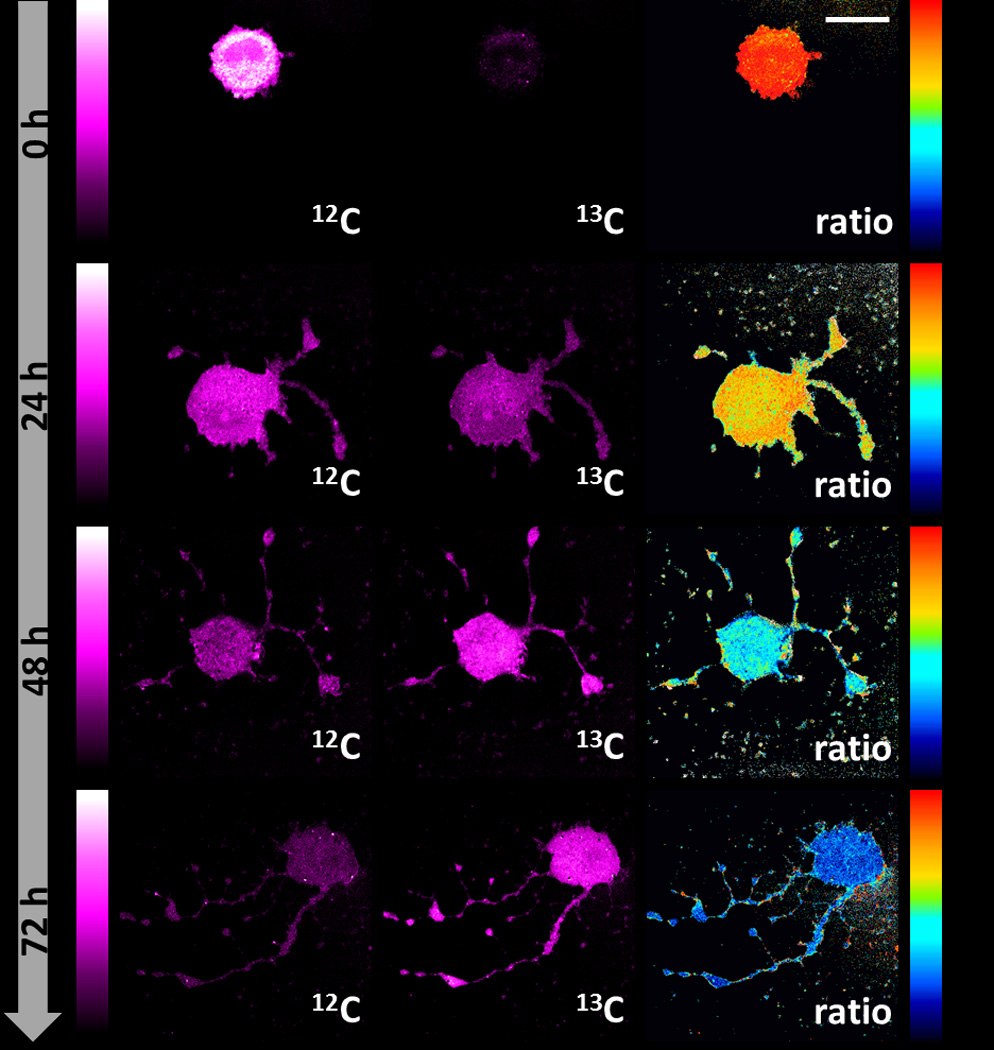
SRS images reveal protein degradation during PC12 differentiation induced by NGF-β. Scale bars, 20 µm.
Finally we studied the impact of protein aggregation on proteomic degradation with subcellular resolution. It is generally believed that polyQ expansion is one of the genetic reasons for neuron degenerative disorders such as Huntington’s disease.[24] Overexpression of mutant Huntingtin (Htt) could overwhelm the capacity of cellular proteolysis and form aggregates as inclusion bodies (IBs). However, the precise role of aggregate formation is still under debate. We expressed a fluorescent protein (mEos2) tagged N-terminal fragment of the mutant Huntingtin protein, mEos2-Htt-Q94, in HEK293T cells as a protein aggregation model. 24 hrs after plasmid transfection, cells were switched to 13C-Phe medium and imaged 24 hrs and 48 hrs later (Figure 5a, Supporting Information). mEos2 fluorescence readily revealed bright cluster regions as IBs. The corresponding regions in the ratio maps (Figure 5b, arrow) show severely retarded degradation, confirming proteolysis inability inside IBs. Thus, the subcellular mapping capability of our technique is indispensable to resolve this compartmentalized impairment of metabolic activity. We notice that SRS signal could be interfered by the two-photon absorption of mEos2. To exclude this possibility, we photo-bleached the mEos2 and restored SRS images (data not shown). We also used a non-chromophore sequence, SNAP-Htt-Q94, to transfect HEK293T cells, which led to similar results (Figure S6).
Figure 5.
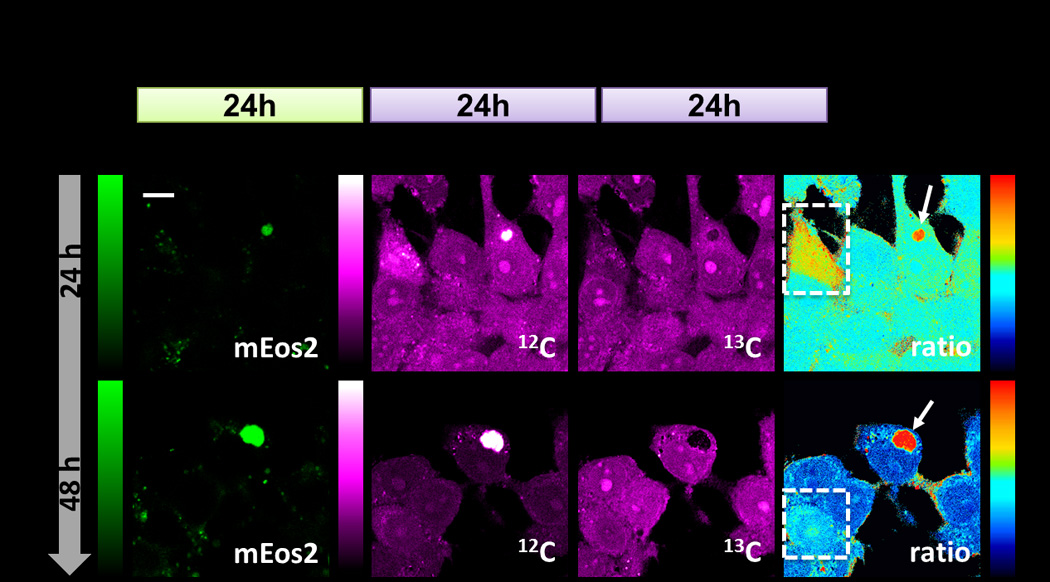
Proteomic degradation of HEK293T cells during Htt-Q94 aggregation. (a) Experimental timeline. (b) First column: mEos2 fluorescence images indicate the formation of inclusion body. Second and third columns: SRS images at 12C and 13C channels. Last column: SRS ratio maps with subcellular resolution reveal retarded degradation inside inclusion bodies (arrow) as well as pronounced slowdown of cytoplasmic protein degradation within a few cells (box). Scale bar, 10 µm.
Remarkable cell-to-cell variations were observed, shedding light on the functional role of IB formation. While the degradation rates for cytoplasmic proteins in most tested cells were very similar to those non-transfected cells (Figure S3), a few ones with hotter colors (Figure 5b, box) exhibited pronouncedly slower degradation. Interestingly, there exist only diffusive Htt-Q94 (or small IBs) in their fluorescence images. In contrast, cells containing large IBs display normal degradation rate for the cytoplasmic proteins. Hence, our observation lends support to the emerging hypothesis that the diffusive oligomers of aggregation-prone proteins might become toxic to cells by gradually interfering with proteasome machinery, while the formation of inclusion bodies may actually play a neuroprotective role by sequestering the diffusive toxic species.[25,26]
We demonstrated the coupling of SRS microscopy with 13C-Phe labeling in quantitative imaging of protein degradation. Compared to existing approaches, our method is unique in several aspects. First, 13C stable isotope introduces minimal perturbation; meanwhile SRS offers non-invasive detection with subcellular resolution. On the contrary, neither autoradiography nor mass spectrometry can probe living cells. Second, the intrinsic contrast from 12C-Phe offers an endogenous marker for the preexisting proteome. This is hardly achievable for bioorthogonal alkyne tagging[27–29], which can only visualize the newly incorporated tags. Likewise, the recently reported deuterium labeling approach only allows imaging of proteome synthesis but not degradation[11] (note that monitoring the decay of C-D signal after pulse-chase of deuterated amino acid would not work, since the C-D signal would gradually transfer from protein to other metabolites such as lipids[30]). Last, unlike analysis on individual proteins, our proteomic approach reveals the global proteolysis activity, a phenotype in many diseases, thus our technique can be applied to drug screening where cell’s proteolysis status is a key functional observable.
Supplementary Material
Footnotes
W. M. acknowledges support from National Institutes of Health Director’s New Innovator Award and Sloan Research Fellowship.
Supporting information for this article is available on the WWW under http://dx.doi.org/10.1002/anie.201xxxxxx.
Contributor Information
Yihui Shen, Department of Chemistry.
Fang Xu, Department of Chemistry.
Lu Wei, Department of Chemistry.
Fanghao Hu, Department of Chemistry.
Wei Min, Department of Chemistry; Kavli Institute for Brain Science, Columbia University, New York, NY, 10027.
References
- 1.Goldberg AL. Nature. 2003;426:895–899. doi: 10.1038/nature02263. [DOI] [PubMed] [Google Scholar]
- 2.Shringarpure R, Davis K. Free Radic. Biol. Med. 2002;32:1084–1089. doi: 10.1016/s0891-5849(02)00824-9. [DOI] [PubMed] [Google Scholar]
- 3.Tsvetkov A, Arrasate M, Barmada S. Nat. Chem. Biol. 2013;9:586–592. doi: 10.1038/nchembio.1308. [DOI] [PMC free article] [PubMed] [Google Scholar]
- 4.Bachmair A, Finley D, Varshavsky A. Science. 1986;234:179–186. doi: 10.1126/science.3018930. [DOI] [PubMed] [Google Scholar]
- 5.Mann M. Nat. Rev. Mol. Cell Biol. 2006;7:952–958. doi: 10.1038/nrm2067. [DOI] [PubMed] [Google Scholar]
- 6.Larance M, Ahmad Y, Kirkwood KJ, Ly T, Lamond AI. Mol. Cell. Proteomics. 2013;12:638–650. doi: 10.1074/mcp.M112.024547. [DOI] [PMC free article] [PubMed] [Google Scholar]
- 7.Doherty MK, Hammond DE, Clague MJ, Gaskell SJ, Beynon RJ. J. Proteome Res. 2009;8:104–112. doi: 10.1021/pr800641v. [DOI] [PubMed] [Google Scholar]
- 8.Zhang D-S, Piazza V, Perrin BJ, Rzadzinska AK, Poczatek JC, Wang M, Prosser HM, Ervasti JM, Corey DP, Lechene CP. Nature. 2012;481:520–524. doi: 10.1038/nature10745. [DOI] [PMC free article] [PubMed] [Google Scholar]
- 9.Steinhauser ML, Bailey AP, Senyo SE, Guillermier C, Perlstein TS, Gould AP, Lee RT, Lechene CP. Nature. 2012;481:516–519. doi: 10.1038/nature10734. [DOI] [PMC free article] [PubMed] [Google Scholar]
- 10.Eden E, Geva-Zatorsky N, Issaeva I, Cohen A, Dekel E, Danon T, Cohen L, Mayo A, Alon U. Science. 2011;331:764–768. doi: 10.1126/science.1199784. [DOI] [PubMed] [Google Scholar]
- 11.Wei L, Yu Y, Shen Y, Wang MC, Min W. Proc. Natl. Acad. Sci. 2013;110:11226–11231. doi: 10.1073/pnas.1303768110. [DOI] [PMC free article] [PubMed] [Google Scholar]
- 12.Zhang D, Wang P, Slipchenko MN, Ben-Amotz D, Weiner AM, Cheng J-X. Anal. Chem. 2013;85:98–106. doi: 10.1021/ac3019119. [DOI] [PMC free article] [PubMed] [Google Scholar]
- 13.Ozeki Y, Umemura W, Otsuka Y, Satoh S, Hashimoto H, Sumimura K, Nishizawa N, Fukui K, Itoh K. Nat. Photonics. 2012;6:845–851. [Google Scholar]
- 14.Zhang X, Roeffaers MBJ, Basu S, Daniele JR, Fu D, Freudiger CW, Holtom GR, Xie XS. Chemphyschem. 2012;13:1054–1059. doi: 10.1002/cphc.201100890. [DOI] [PMC free article] [PubMed] [Google Scholar]
- 15.van Manen H-J, Lenferink A, Otto C. Anal. Chem. 2008;80:9576–9582. doi: 10.1021/ac801841y. [DOI] [PubMed] [Google Scholar]
- 16.Piez K, Eagle H. J. Biol. Chem. 1958;231:533–545. [PubMed] [Google Scholar]
- 17.Freudiger CW, Min W, Saar BG, Lu S, Holtom GR, He C, Tsai JC, Kang JX, Xie XS. Science. 2008;322:1857–1861. doi: 10.1126/science.1165758. [DOI] [PMC free article] [PubMed] [Google Scholar]
- 18.Saar BG, Freudiger CW, Reichman J, Stanley CM, Holtom GR, Xie XS. Science. 2010;330:1368–1370. doi: 10.1126/science.1197236. [DOI] [PMC free article] [PubMed] [Google Scholar]
- 19.Wang P, Li J, Wang P, Hu C-R, Zhang D, Sturek M, Cheng J-X. Angew. Chem. 2013;125:13280–13284. Angew. Chem. Int. Ed.2013, 52, 13042–13046. [Google Scholar]
- 20.Min W, Freudiger CW, Lu S, Xie XS. Annu. Rev. Phys. Chem. 2011;62:507–530. doi: 10.1146/annurev.physchem.012809.103512. [DOI] [PMC free article] [PubMed] [Google Scholar]
- 21.Noothalapati Venkata HN, Shigeto S. Chem. Biol. 2012;19:1373–1380. doi: 10.1016/j.chembiol.2012.08.020. [DOI] [PubMed] [Google Scholar]
- 22.Cambridge SB, Gnad F, Nguyen C, Bermejo JL, Krüger M, Mann M. J. Proteome Res. 2011;10:5275–5284. doi: 10.1021/pr101183k. [DOI] [PubMed] [Google Scholar]
- 23.Breusing N, Grune T. Biol. Chem. 2008;389:203–209. doi: 10.1515/BC.2008.029. [DOI] [PubMed] [Google Scholar]
- 24.Zoghbi HY, Orr HT. Annu. Rev. Neurosci. 2000;23:217–247. doi: 10.1146/annurev.neuro.23.1.217. [DOI] [PubMed] [Google Scholar]
- 25.Arrasate M, Mitra S, Schweitzer ES, Segal MR, Finkbeiner S. Nature. 2004;431:805–810. doi: 10.1038/nature02998. [DOI] [PubMed] [Google Scholar]
- 26.Tyedmers J, Mogk A, Bukau B. Nat. Rev. Mol. Cell Biol. 2010;11:777–788. doi: 10.1038/nrm2993. [DOI] [PubMed] [Google Scholar]
- 27.Dieterich DC, Hodas JJL, Gouzer G, Shadrin IY, Ngo JT, Triller A, Tirrell Da, Schuman EM. Nat. Neurosci. 2010;13:897–905. doi: 10.1038/nn.2580. [DOI] [PMC free article] [PubMed] [Google Scholar]
- 28.Wei L, Hu F, Shen Y, Chen Z, Yu Y, Lin C-C, Wang MC, Min W. Nat. Methods. 2014 doi: 10.1038/nmeth.2878. [DOI] [PMC free article] [PubMed] [Google Scholar]
- 29.Lin L, Tian X, Hong S, Dai P, You Q, Wang R, Feng L, Xie C, Tian Z-Q, Chen X. Angew. Chem. 2013;125:7407–7412. doi: 10.1002/anie.201301387. Angew. Chem. Int. Ed.2013, 52, 7266–7271. [DOI] [PubMed] [Google Scholar]
- 30.Hu F, Wei L, Zheng C, Shen Y, Min W. Analyst. 2014 doi: 10.1039/c3an02281a. [DOI] [PMC free article] [PubMed] [Google Scholar]
Associated Data
This section collects any data citations, data availability statements, or supplementary materials included in this article.