

The flagellar accessory protein FlaH from M. jannaschii has been purified and crystallized. The crystal structure has been solved using the MAD method.
Keywords: FlaH, Methanocaldococcus jannaschii
Abstract
The flagellar accessory protein FlaH is thought to be one of the essential components of an archaeal motility system. However, to date biochemical and structural information about this protein has been limited. Here, the crystallization of FlaH from the hyperthermophilic archaeon Methanocaldococcus jannaschii is reported. Protein crystals were obtained by the vapour-diffusion method. These crystals belonged to space group P3121, with unit-cell parameters a = b = 131.42, c = 89.35 Å. The initial solution of the FlaH structure has been determined by multiple-wavelength anomalous dispersion phasing using a selenomethionine-derivatized crystal.
1. Introduction
Similar to bacteria, archaea move in a liquid environment by means of flagella (also termed archaella). In spite of functional similarity between bacterial and archaeal flagella, these two organelles are not related. Evolutionarily and structurally archaella are more closely related to another bacterial motility structure: type IV pili (Thomas et al., 2001 ▶; Trachtenberg et al., 2005 ▶; Desmond et al., 2007 ▶; Cohen-Krausz & Trachtenberg, 2008 ▶). Similar to type IV pili, the assembly of archaella has been postulated to occur by adding new subunits to the base of growing filaments (Jarrell et al., 1996 ▶). The mechanism of this process is poorly understood. No anchoring structure or bacterial basal body equivalent of archaeal flagella has been detected to date.
Three proteins are thought to form a secretory complex in archaella assembly: FlaH, FlaI and FlaJ (Thomas et al., 2001 ▶). Among these, only FlaI of Sulfolobus acidocaldarius has been characterized functionally and structurally (Ghosh et al., 2011 ▶; Reindl et al., 2013 ▶).
FlaH is a potential ATPase-like protein that contains a typical Walker A motif and an incomplete Walker B motif (Thomas & Jarrell, 2001 ▶). No ATPase activity of the protein has been reported. It has been suggested that FlaH is involved in the regulation of archaellum assembly and rotation (Jarrell et al., 2007 ▶), but direct biochemical data supporting this suggestion are lacking. Structural characterization of FlaH will give us a better understanding of the function of this protein and will advance our knowledge of the assembly mechanism of archaella. Here, we report the crystallization and preliminary X-ray analysis of the FlaH protein from the hyperthermophilic methanogenic archaeon Methanocaldococcus jannaschii.
2. Experimental procedures and results
2.1. Cloning, expression and purification
A DNA fragment encoding M. jannaschii FlaH (GeneID 1451788) was amplified by PCR from the genomic DNA of M. jannaschii as a template using the following primers containing NdeI and SapI restriction sites (in bold): 5′-GGT GGT CAT ATG GGG ATT ATG GAA TTA GCA AGA ATT GAT TTA AGT AG-3′ and 5′-GGT GGT TGC TCT TCC GCA TGC AAC AGA TGC AAT TTC AAC AGC GAT AC-3′. The PCR product was double-digested with NdeI and SapI and then ligated into the pTXB1 expression vector (New England BioLabs), generating an in-frame fusion with the intein and chitin-binding domain (CBD).
The recombinant vector containing the gene for the FlaH-intein-CBD fusion protein was transformed into Escherichia coli strain Rosetta (DE3) (Novagen). The transformed cells were cultured at 310 K to late exponential phase in 5 l Luria–Bertani medium containing 50 µg ml−1 ampicillin and 34 µg ml−1 chloramphenicol. Expression was induced with 0.5 mM isopropyl β-d-1-thiogalactopyranoside at an OD600 of 0.7–0.8. After 4 h incubation at 303 K, the cells were harvested by centrifugation at 8000g for 15 min and suspended in 200 ml buffer A (40 mM HEPES pH 8.0, 0.5 M NaCl, 20% glycerol). The suspended cells were sonicated on ice. The cell debris was removed by centrifugation for 30 min at 30 000g and 278 K. The clarified supernatant was applied onto a 30 ml chitin beads column (New England BioLabs) equilibrated with buffer A. The column was washed with 200 ml buffer A and then with 100 ml buffer A supplemented with 0.1 M DTT to induce on-column cleavage. FlaH protein was eluted with buffer A after 16 h incubation at 278 K. Eluted protein was dialyzed against 50 mM sodium acetate pH 4.0, 100 mM NaCl and applied onto an SP HP column (GE Healthcare) equilibrated with the same buffer. The protein was eluted with a linear gradient of NaCl from 0.1 to 1 M in 40 mM sodium acetate pH 4.5. Fractions containing pure protein were pooled together and the protein was transferred by dialysis into 10 mM sodium acetate pH 3.5, 100 mM NaCl. The final protein contains no non-native amino-acid residues. Typical preparations yielded approximately 3 mg pure protein per litre of E. coli culture.
Selenomethionine-substituted protein was produced in methionine-auxotrophic E. coli strain B834 (DE3)/pRARE (Novagene) using SeMet Core medium (Wako Pure Chemical Industries). The purification of the SeMet-labelled FlaH was the same as that for the native protein.
2.2. Crystallization
The purified protein was concentrated to 10 mg ml−1 using an Amicon Ultra system (Millipore) with a molecular-weight cutoff of 10 kDa. The protein concentration was measured by UV spectroscopy at 280 nm using a calculated absorption coefficient of 0.52 mg ml−1 cm−1.
Preliminary screening of crystallization conditions was performed with Crystal Screen and Crystal Screen 2 (Hampton Research), Wizard I, II and III, and Cryo I and II (Emerald Bio) by the sitting-drop vapour-diffusion method in 96-well plates using an automated nanolitre liquid-handling system (Mosquito, TTP Labtech) at two temperatures: 283 and 293 K. 150 nl protein solution was mixed with 150 nl reservoir solution and equilibrated against 120 µl reservoir solution. Crystals grew in various conditions and the best crystals were obtained in 0.1 M HEPES pH 7.5, 1.5 M Li2SO4 (Crystal Screen condition No. 10) at 293 K (Fig. 1 ▶ a).
Figure 1.
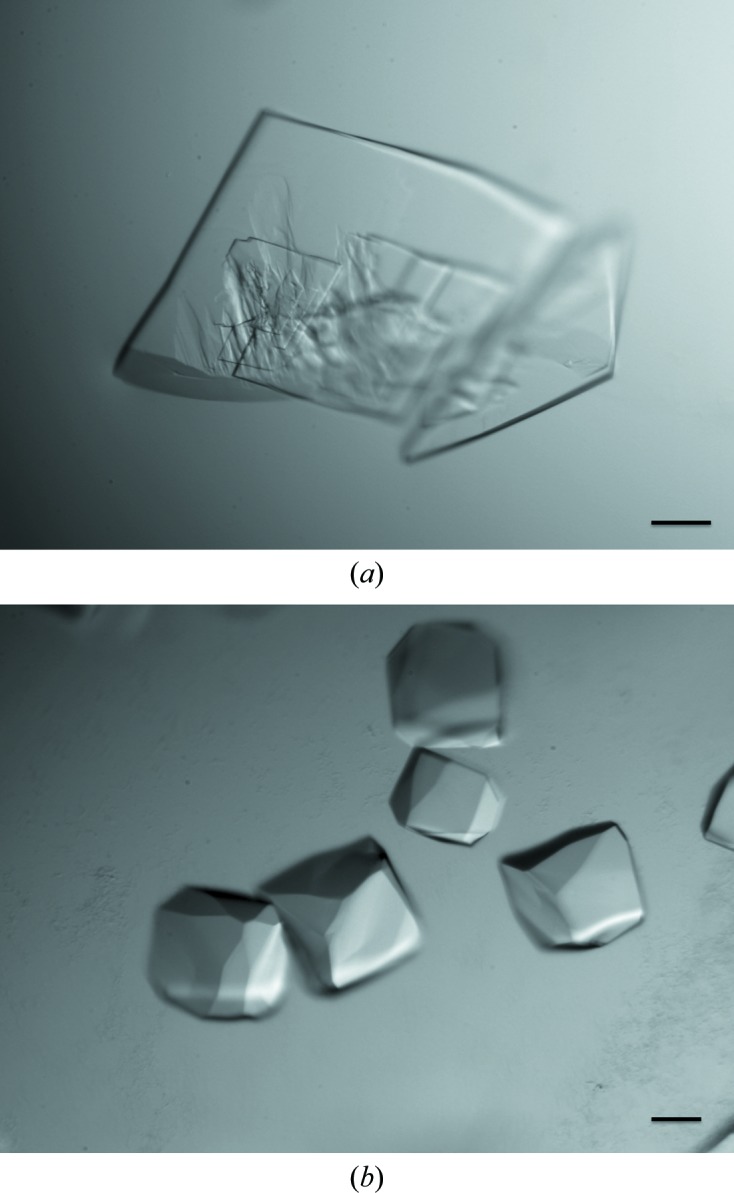
Crystals of FlaH. (a) Crystals obtained by initial screening in 0.1 M HEPES pH 7.5, 1.5 M Li2SO4. (b) Crystals obtained after optimization in 0.1 M HEPES pH 7.5, 0.65 M Rb2SO4. The scale bar is 0.1 mm in length.
Despite their good appearance, the plate-like crystals showed a high degree of disorder and were not suitable for further structural study. Optimization of the crystallization conditions was performed by systematic variation of each component of the crystallization mixture and by testing the effects of different additives. The final crystallization conditions were 0.1 M HEPES pH 7.5, 0.65 M Rb2SO4 at 283 K.
Crystals appeared within 3 d after setting up the drop and reached their maximum dimensions after one week (Fig. 1 ▶ b).
2.3. Data collection and processing
Prior to data collection, single crystals were briefly soaked in cryoprotectant solution consisting of 0.1 M HEPES pH 7.5, 0.7 M Li2SO4, 20% glycerol. Subsequently, crystals were mounted on a nylon loop and flash-cooled in liquid nitrogen. X-ray diffraction data were collected on beamline BL38B1 at SPring-8 using an ADSC Quantum 315r CCD detector (Fig. 2 ▶). The diffraction data were processed and scaled using the HKL-2000 program package (Otwinowski & Minor, 1997 ▶). The crystals belonged to space group P3121, with unit-cell parameters a = b = 131.42, c = 89.35 Å, α = β = 90.0, γ = 120°. The data have severe diffraction anisotropy as estimated by the UCLA MBI Diffraction Anisotropy Server (http://services.mbi.ucla.edu/anisoscale/; Strong et al., 2006 ▶). The suggested diffraction limit in the best direction was 2.5 Å, although in the other two directions the suggested diffraction limit was 2.7 Å.
Figure 2.

A typical X-ray diffraction pattern of a FlaH crystal. The exposure time was 10 s with an oscillation angle of 0.5°.
Calculation of the Matthews coefficient (Matthews, 1968 ▶) indicated the presence of three or four molecules per asymmetric unit, with Matthews coefficients of 2.83 and 2.12 Å3 Da−1 and solvent contents of 56.5 and 42.0%, respectively.
Selenomethionine-labelled protein crystallized in the same conditions as the native protein and in the same space group P3121. The SeMet crystals diffracted to a higher resolution than the native crystals (Table 1 ▶), although they still showed strong diffraction anisotropy. The initial solution of the FlaH structure was obtained using the multiple-wavelength anomalous dispersion method (MAD). Heavy-atom search, phasing and density modification were performed with AutoSol (Terwilliger et al., 2009 ▶) in the PHENIX suite (Adams et al., 2010 ▶). The positions of 15 Se atoms were identified with an initial figure of merit of 0.54 and an overall estimated map CC value of 60.2 ± 11.7. The electron density obtained after density modification was easily interpretable (Fig. 3 ▶). Automatic model building with Buccaneer (Cowtan, 2008 ▶) from the CCP4 package (Winn et al., 2011 ▶) provided about a 98% complete model (R work = 25.6%, R free = 31.9%). The solution shows three FlaH molecules in the crystallographic asymmetric unit. The structure was refined to the final R work and R free values of 21.2 and 23.7%, respectively. A detailed discussion of the FlaH structure will be published elsewhere.
Table 1. Data-collection statistics.
Values in parentheses are for the highest resolution shell.
| SeMet derivative | |||
|---|---|---|---|
| Peak | Inflection | Native | |
| Space group | P3121 | P3121 | P3121 |
| Unit-cell parameters () | |||
| a = b | 131.10 | 131.01 | 131.42 |
| c | 89.12 | 89.10 | 89.35 |
| Wavelength () | 0.97886 | 0.97944 | 1.0 |
| Resolution () | 502.2 (2.322.20) | 502.2 (2.322.20) | 502.5 (2.642.50) |
| Completeness (%) | 100 (100) | 100 (100) | 99.8 (100) |
| Total reflections | 478243 (68620) | 479269 (69164) | 329991 (49340) |
| Unique reflections | 45022 (6492) | 45076 (6469) | 31102 (4507) |
| Multiplicity | 10.6 (10.6) | 10.6 (10.6) | 10.6 (10.9) |
| R merge † (%) | 11.1 (94.5) | 10.6 (90.7) | 7.4 (86.3) |
| R p.i.m. (%) | 4.1 (31.9) | 3.6 (30.5) | 2.4 (27.3) |
| CC1/2 | 0.998 (0.913) | 0.999 (0.919) | 0.999 (0.945) |
| Mean I/(I) | 11.9 (2.5) | 12.3 (2.6) | 15.8 (2.8) |
R
merge = 
 , where Ii(hkl) is the intensity of the ith measurement of reflection hkl and I(hkl) is the mean value of Ii(hkl) for all i measurements.
Figure 3.

Experimental electron-density map calculated at 2.6 Å resolution and contoured at 1.8σ.
Acknowledgments
We gratefully acknowledge Professor Fadel A. Samatey for his generous support. We also would like to thank S. Kitanobo for his kind help in data collection. The synchrotron data collection was conducted on beamline BL38B1 at SPring-8, Japan (proposal No. 2014A1181).
References
- Adams, P. D. et al. (2010). Acta Cryst. D66, 213–221.
- Cohen-Krausz, S. & Trachtenberg, S. (2008). J. Mol. Biol. 375, 1113–1124. [DOI] [PubMed]
- Cowtan, K. (2008). Acta Cryst. D64, 83–89. [DOI] [PMC free article] [PubMed]
- Desmond, E., Brochier-Armanet, C. & Gribaldo, S. (2007). BMC Evol. Biol. 7, 106. [DOI] [PMC free article] [PubMed]
- Ghosh, A., Hartung, S., van der Does, C., Tainer, J. A. & Albers, S. V. (2011). Biochem. J. 437, 43–52. [DOI] [PMC free article] [PubMed]
- Jarrell, K. F., Bayley, D. P. & Kostyukova, A. S. (1996). J. Bacteriol. 178, 5057–5064. [DOI] [PMC free article] [PubMed]
- Jarrell, K. F., Ng, S. Y. & Chaban, B. (2007). Archaea: Molecular and Cellular Biology, edited by R. Cavicchioli, pp. 385–410. Washington DC: ASM Press.
- Matthews, B. W. (1968). J. Mol. Biol. 33, 491–497. [DOI] [PubMed]
- Otwinowski, Z. & Minor, W. (1997). Methods Enzymol. 276, 307–326. [DOI] [PubMed]
- Reindl, S., Ghosh, A., Williams, G. J., Lassak, K., Neiner, T., Henche, A. L., Albers, S. V. & Tainer, J. A. (2013). Mol. Cell, 49, 1069–1082. [DOI] [PMC free article] [PubMed]
- Strong, M., Sawaya, M. R., Wang, S., Phillips, M., Cascio, D. & Eisenberg, D. (2006). Proc. Natl Acad. Sci. USA, 103, 8060–8065. [DOI] [PMC free article] [PubMed]
- Terwilliger, T. C., Adams, P. D., Read, R. J., McCoy, A. J., Moriarty, N. W., Grosse-Kunstleve, R. W., Afonine, P. V., Zwart, P. H. & Hung, L.-W. (2009). Acta Cryst. D65, 582–601. [DOI] [PMC free article] [PubMed]
- Thomas, N. A., Bardy, S. L. & Jarrell, K. F. (2001). FEMS Microbiol. Rev. 25, 147–174. [DOI] [PubMed]
- Thomas, N. A. & Jarrell, K. F. (2001). J. Bacteriol. 183, 7154–7164. [DOI] [PMC free article] [PubMed]
- Trachtenberg, S., Galkin, V. E. & Egelman, E. H. (2005). J. Mol. Biol. 346, 665–676. [DOI] [PubMed]
- Winn, M. D. et al. (2011). Acta Cryst. D67, 235–242.