

Abstract
Aims
In the UK, lifestyle intervention is first-line management in Type 2 diabetes. It is unclear what type of diet is most efficacious for improving glycaemic control. This study investigated the effects of an oat-enriched diet on glycaemic control, postprandial glycaemia, inflammation and oxidative stress compared with standard dietary advice.
Methods
In a randomized crossover design, 27 volunteers with Type 2 diabetes, managed on diet and lifestyle only, were observed for two consecutive 8-week periods following either the oat-enriched diet or re-enforced standard dietary advice. Volunteers attended at baseline (habitual intake) and 8 and 16 weeks. Measurements included basic clinical measurements and fasted and postprandial (3-h) glucose and insulin in response to a healthy test meal. Markers of inflammation and oxidative stress, including high-sensitivity C-reactive protein, interleukin 6, interleukin 18, tumour necrosis factor-alpha, adiponectin, thiobarbituric acid reactive substances, oxygen radical antioxidant capacity, oxidized LDL and urinary isoprostanes, were also measured at fasting and in the postprandial period.
Results
There were no diet-related effects on glycaemic control or glycaemic or insulinaemic responses to the test meal. Total cholesterol (5.1 ± 1.0 vs. 4.9 ± 0.8 mmol/l, P = 0.019) concentrations declined following the oat-enriched diet compared with standard dietary advice. There was a postprandial decline in adiponectin concentration (P = 0.009), but no effect of dietary intervention. None of the measures of oxidative stress or inflammation were altered by the oat-enriched diet compared with standard dietary advice.
Conclusion
The oat-enriched diet had a modest impact on lipid lowering, but did not impact on oxidative stress or inflammation in these volunteers with Type 2 diabetes.
Introduction
Lifestyle intervention is the first line of management in Type 2 diabetes [1]. National Institute for Health and Clinical Excellence (NICE) [1] guidelines recommend that people with diabetes should follow principles of healthy eating. It is unclear what type of diet is most efficacious for long-term glycaemic control, independent of weight loss. A recent Cochrane review [2] concluded that low glycaemic index diets can potentially lower HbA1c by approximately 5 mmol/mol (0.5%). Nonetheless, many studies considered within this review used a high glycaemic index diet as the control [3], itself likely to have adverse effects on glycaemic control. Improvement between moderate and low glycaemic index diets is less certain.
Postprandial hyperglycaemia may be a risk factor for cardiovascular disease. In the Diabetes Epidemiology: Collaborative analysis of Diagnostic criteria in Europe (DECODE) study, 2-h plasma glucose following an oral glucose tolerance test was an independent predictor for cardiovascular disease and mortality [4]. Postprandial hyperglycaemia may result in enhanced oxidative stress contributing to cardiovascular risk. Human umbilical vein endothelial cells exposed to variable glucose concentrations show an increase in production of harmful reactive oxygen species [5]. Importantly, in volunteers with Type 2 diabetes there was a direct correlation between postprandial glycaemia and plasma nitrotyrosine concentrations [6], while urinary excretion of 8-iso prostaglandin F2α (a marker of oxidative stress) correlated with acute glucose fluctuations, but not with fasting plasma glucose or HbA1c [7]. Furthermore, control of postprandial hyperglycaemia with repaglinide resulted in regression of carotid intima thickness and reductions in markers of systemic inflammation [8].
Many oat products have a low glycaemic index [9] and offer an easily identified source of carbohydrate that could contribute to a lowered overall dietary glycaemic index. Indeed, individuals with Type 2 diabetes have favourable plasma glucose and insulin profiles after oats or oat bran meals [10]. Oat-based diets may also have other health benefits, notably on lipid profiles [11] and levels of oxidative stress, inflammation and antioxidant capacity [12].
The hypothesis examined here was that an oat-enriched diet modulates postprandial hyperglycaemia and may be associated with beneficial effects on fasting and postprandial concentrations of markers of oxidative stress and inflammation.
Volunteers
Men and post-menopausal women with Type 2 diabetes managed by diet and lifestyle alone (n = 27) were recruited from two Scottish Health Boards (Aberdeen and Inverness) (Table1). Inclusion criteria included: HBA1c < 64 mmol/mol (8%) and age 40–75 years. Exclusion criteria were a history of significant liver, renal or cardiovascular disease or certain medications (including corticosteroids, hormone replacement therapy, anticoagulants, aspirin and statins).
Table 1.
Baseline characteristics of subjects (n = 27)
| Men:women | 18:9 |
| BMI (kg/m2) | 31.5 ± 0.98 (23.5–42.4) |
| HbA1c (mmol/mol) | 50.5 ± 1.44 (35.5–66.1) |
| HbA1c (%) | 6.8 ± 0.14 (5.4–8.2) |
| Age (years) | 60.9 ± 1.23 (46–71) |
| Duration of diabetes (months) | 37.0 ± 8.3 (3-180) |
Values given are means ± sem (range).
Volunteers underwent medical screening and provided written informed consent. The North of Scotland Research Ethics Service approved the study, which complied with the Declaration of Helsinki and its amendments.
Methods
This randomized, crossover design study involved dietary intervention with both re-enforced conventional standard dietary advice and a modified diet, based on consumption of additional oat products, each for 8 weeks with no washout between. Volunteers were also tested at the start of the study (week 0), at which point they were following their habitual diet. Participants for each order of diet intervention were matched (in order) by sex, age, BMI and, where needed, HbA1c, with allocation to either group by independent statistical supervision. In consequence, the two groups did not differ in any of these variables. The study was conducted between July 2008 and December 2010.
Standard dietary advice
Standard dietary advice for Type 2 diabetes is based on healthy eating recommendations. Prior to the standard dietary advice phase of the trial, volunteers received a re-inforced message on dietary advice. This was supplemented by literature regarding dietary and lifestyle advice [13]. Volunteers were also instructed to avoid oats whilst following the standard dietary advice intervention.
Oat-enriched diet
When following the oat-enriched diet, individuals were given a range of selected commercially available oat-based products (including cereals, oatcakes, bread, cereal bars) readily available commercially (see Table2). Products were chosen on the basis of oat content, and those with lower saturated fat and refined sugar contents were preferentially selected. Oat bread containing 30% oats was developed by Macphie of Glenbervie Ltd (Glenbervie, Stonehaven, UK) and produced by J. G. Ross (Bakers) Ltd (Highclere Business Park, Inverurie, UK). Volunteers were provided with written guidelines on how they might include oat products in their diet. They were asked to substitute part of the carbohydrate content at each meal with an oat-based product, to include 60–100 g of oats per day and to record the amount of oats consumed at each meal in a study diary based on a ‘points’ system where 1 ‘point’ equalled 10 g of oats, as determined by the manufacture’s nutritional information (see Table2).
Table 2.
Nutritional information and oat content for oat products used in the intervention study
| Product (nutritional information for 100 g) | Standard portion size (g) | Energy (kJ) | Energy (kcal) | Fat (g) | Carbohydrate (g) | Protein (g) | Dietary fibre (g) | Salt (g) | Saturated fat (g) | Starch (g) | Total sugars (g) | Percentage oats | Oats in a standard portion size (g) | Estimated glycaemic index (%)* | Number of ‘points’ in standard portion size |
|---|---|---|---|---|---|---|---|---|---|---|---|---|---|---|---|
| Weetabix Oatibix bite size | 36 | 1562 | 373.68 | 6.8 | 66.6 | 10.6 | 10.1 | 0.75 | 1.1 | 52.4 | 14.2 | 88 | 31.7 | 57 | 3 |
| Weetabix Oatiflakes | 30 | 1613 | 385.89 | 5.6 | 73.2 | 9.5 | 6.2 | 0.30 | 0.9 | 58.9 | 14.3 | 63 | 18.9 | 74 | 2 |
| Quaker’s Porridge Oats | 40 | 1500 | 358.85 | 8 | 60 | 11 | 9 | 0.00 | 1.5 | 0 | 1.1 | 100 | 40 | 55 | 4 |
| Quaker Muesli—Fruit and Nut | 50 | 1460 | 349.28 | 5 | 65 | 9.5 | 8.5 | 0.00 | 1 | 51 | 14 | 51 | 25.5 | 43 | 3 |
| Quaker Oat Granola—Red Apple and Wild Blackberry | 25 | 1670 | 399.52 | 9.5 | 67 | 10 | 8 | 0.00 | 3.5 | 49 | 18 | 59 | 14.7 | 77 | 1.5 |
| Quakers Oat Bars—Syrup | 38 | 1539 | 368.18 | 9.4 | 64.4 | 7.2 | 8 | 0.50 | 2.5 | 47.7 | 16.7 | 60 | 22.8 | 57 | 2 |
| Nairn’s Oat Biscuits | 20 (two biscuits) | 1823 | 436.12 | 16.1 | 65.2 | 7 | 7.2 | 0.75 | 6.1 | 48.8 | 16.4 | 63 | 12.6 | 55 | 1 |
| Paterson’s Oat Bites—Cheese and Chilli | 30 | 1876 | 448.80 | 20.2 | 53.1 | 13.3 | 7.3 | 2.00 | 5.9 | 51.3 | 1.8 | 80 | 24 | 36 | 2.5 |
| Nairn’s Oatcakes | 21 (two oatcakes) | 1766 | 422.49 | 18.6 | 52.8 | 10.6 | 10.5 | 1.85 | 4.6 | 51.6 | 1.2 | 88 | 18.5 | 36 | 2 |
| Nairn’s Oat Bakes | 30 | 1728 | 413.40 | 13.6 | 67.6 | 0 | 6.4 | 0.00 | 6 | 62.7 | 4.9 | 56 | 16.8 | 36 | 2 |
| Study Oat Bread | 35 | 926 | 221.53 | 3.1 | 40 | 8.3 | 3.7 | 0.00 | 0.7 | 38.9 | 1 | 31 | 10.9 | 95 | 1 |
Estimated glycaemic index is from similar products in published reference tables, apart from in the case of the study oat bread when the glycaemic index was calculated from clinical studies.
Volunteers were provided with the above products for use in the dietary intervention study.
Weetabix (Weetabix Food Company, Kettering, UK), Quaker (Quaker Oats Ltd, Leicester, UK), Nairn’s (Nairn’s, Edinburgh, UK).
Study Oat bread as described in Methods section Paterson Arran Ltd, West Lothian, Scotland, UK.
Otherwise, diabetes care and management of the patients was not altered. Volunteers continued to be monitored by their own medical practitioner, who had the right to advise withdrawal from the study at any time if control of diabetes proved unsatisfactory; this did not occur.
Clinical and glycaemic measurements
At weeks 0 (baseline), 8 and 16, volunteers attended at 08.00 h after an overnight fast of at least 10 h. The following measurements were undertaken:
Fasting measurements
Weight; height (plus BMI calculation); waist circumference; blood pressure.
Fasting lipid profile (total cholesterol, LDL, HDL and triglycerides).
Fasting plasma glucose and insulin concentrations in triplicate plasma samples taken 5 min apart. Glucose was determined in duplicate using a Konelab 30 selective chemistry analyser (Thermo Electron Corporation, Basingstoke, UK) using a standard glucose (HK) assay kit (Thermo 981304) and insulin concentrations were determined in duplicate using a solid two-site enzyme immunoassay [enzyme linked immunosorbent assay (ELISA), Mercodia insulin (Mercodia Inc., Uppsala, Sweden)]. Intra-assay coefficient of variation was 4.6% and interassay coefficient of variation was 3.6%.
Insulin resistance and β-cell function were calculated by homeostasis model assessment of insulin resistance (HOMA-IR) and β-cell function (HOMA-B), respectively [14].
HbA1c was measured using a liquid chromatography method and Diabetes Control and Complications Trial (DCCT)-aligned laboratory equipment.
- The following inflammatory markers were measured:
- plasma C-reactive protein (CRP) using a quantitative sandwich enzyme immunoassay technique (Quantikine Human CRP Immunoassay; R&D Systems Europe Ltd, Abingdon, UK). Intra-assay coefficient of variation was 4.1% and interassay coefficient of variation was 6.5%;
- plasma adiponectin using a quantitative sandwich enzyme immunoassay technique (Quantikine Human Adiponectin Immunoassay; R&D Systems Europe Ltd) Intra-assay coefficient of variation was 3.4% and interassay coefficient of variation was 6.5%;
- plasma interleukin (IL)-6, IL-18 and tumour necrosis factor alpha (TNF-α) by ELISA approaches (eBioscience Ltd, Hatfield, UK); with the interassay coefficient of variation of 5.2, 8.1 and 8.1% and intra-assay coefficient of variation of 3.4, 6.5 and 7.7%, respectively.
- The following measures of antioxidant capacity and oxidative stress were assessed in plasma:
- oxygen radical antioxidant capacity (ORAC) based on oxidation of a fluorescent probe by peroxyl radicals through hydrogen atom transfer (Cell Biolabs Inc., San Diego, CA, USA) (intra-assay coefficient of variation 6.2%);
- malondialdehyde (MDA), a by-product of lipid peroxidation, assessed spectrophotometrically after extraction with n-butanol from plasma collected in EDTA tubes (OxiSelect TBARS Assay Kit; Cell Biolabs Inc.) (intra-assay coefficient of variation 6.0%);
- fasting oxidized LDL quantified using ELISA kit (Mercodia Inc.). Intra-assay coefficient of variation was 4.5%, interassay coefficient of variation was 6.9%;
- urinary isoprostane was measured using a competitive enzyme-linked assay for 8-iso-prostaglandin F2α (OxiSelect; Cell Biolabs Inc.) and creatinine was measured at the Raigmore Hospital clinical biochemistry laboratory (Inverness, UK).
Test meal
Initial fasting blood samples were taken via a cannula placed in an antecubital fossa vein. Subjects then consumed a test meal that contained 3.3 MJ metabolizable energy (approximately 30% of daily energy intake), with a calculated glycaemic load of 56 g and a glycaemic index of 57%. Meal composition followed that recommended by the UK Department of Health [15] as healthy eating and contained 100 g carbohydrate (approximate glycaemic index 57%; 51% metabolizable energy from carbohydrate, 14% metabolizable energy from protein and 32% metabolizable energy from fat). The test meal did not contain wholegrain or oat-based products. Subjects were instructed to consume the test meal within 15 min and blood samples were withdrawn immediately before ingestion and then at 15-min intervals for 3 h. Both incremental and total areas under the curve (AUCi and AUCt) were determined by trapezoid procedures. Insulin secretion in response to glycaemic stimulus was calculated as the incremental area under the curve(insulin)/ incremental area under the curve(glucose).
Continuous glucose monitoring system and food diaries
On the morning of the test meal, volunteers were fitted with a continuous glucose monitoring system (Medtronic Ltd, Watford, UK) to assess glucose excursions in the free-living state. Volunteers also completed food diaries over this period and were provided with digital electronic scales with a tare facility; they recorded food and drink consumed, time of consumption, weight of food and drink, cooking method and leftovers. The volunteers were instructed to record all recipes and to keep packaging for ready-to-eat food products. When scale use was difficult, volunteers provided information regarding type and quantity of food eaten, using household measures. Diets were analysed using WinDiets Nutritional Analysis Software Suite (version 1.0; The Robert Gordon University, Aberdeen, UK), a computerized version of McCance and Widdowson: The Composition of Foods [16]. Standard portion sizes were used to input foods with household measures or with missing weights or portion sizes [17]. Total energy and nutrient intake for each meal were quantified. The glycaemic index of the different foodstuffs was taken from published reference tables [9]. Dietary glycaemic index was calculated as the sum of the glycaemic index value of each foodstuff multiplied by available carbohydrate content (total carbohydrate minus dietary fibre) expressed as a proportion of the total available carbohydrate for the day. Dietary glycaemic load was calculated as the sum of the product of the glycaemic index for each foodstuff and its available carbohydrate content, divided by 100.
Experimental power
The study power was based on a number of primary measurements within the volunteer (notably incremental or total areas under the curve for both glycaemia and insulinaemia, plus the inflammatory marker IL-6). For all these, and assuming a within-volunteer spread of 20% or less (observed for aforementioned outcomes in previous studies with similar volunteers, either in-house or from the existing literature), n = 30 was needed to detect treatment differences of 15% with 80% power at 5% significance (based on paired t-test).
Statistics
Data were analysed by random effects models using the restricted maximum likelihood (REML) estimation in Genstat 13th edition, release 13.2 (VSN International, Hemel Hempstead, UK). For postprandial time course data, the random effects consisted of volunteer, with week (0, 8 or 16 week) and time (time points following the test meal), plus their interaction, nested within volunteer. Fixed effects were site, gender, diet, time and week, with all interactions between diet, time and week considered, but for site and gender interactions these were restricted to those with diet and week. For outcomes consisting of one observation per diet (such as the overnight fasting sample or incremental area under the curve), time was removed from the analyses. Data for standard dietary advice vs. oat-enriched diet treatments were also analysed with baseline measures as covariate. Following inspection of the residual plots, data based on CRP and the ratio of isoprostane:creatinine were analysed after log10 transformation in order to stabilize the variance. For these variables, the mean data (and 95% confidence intervals) presented in Table4 represent back-transformed values from the statistical output. For Figs 1–3, data are presented as mean and sem, while in Tables3–6 the standard error of the difference (sed) for diet comparisons from the restricted maximum likelihood analysis is given. Where significant responses (P < 0.05) were observed for main effects or interactions, then post-hoc t-tests (no correction for multiple comparisons) were applied to determine differences between mean values. P < 0.05 was regarded as significant.
Table 4.
Values for fasting plasma values, anthropometric and clinical measurements during the study; n = 27
| Habitual diet | Standard dietary advice | Oat-enriched diet | sed | P | |
|---|---|---|---|---|---|
| BMI (kg/m2) | 31.5*† | 31.4* | 31.7† | 0.14 | 0.015 |
| Weight (kg) | 90.1*† | 89.8* | 90.4† | 0.42 | 0.030 |
| Systolic blood pressure (mmHg) | 130.3 | 133.0 | 137.1 | 3.58 | 0.221 |
| Diastolic blood pressure (mmHg) | 75.4 | 76.0 | 77.0 | 2.17 | 0.828 |
| Pulse (beats min–1) | 65.3 | 65.6 | 65.9 | 2.71 | 0.917 |
| HbA1c (mmol/mol) | 50.5 | 52.8 | 51.9 | 1.23 | 0.12 |
| HbA1c (%) | 6.8 | 7.0 | 6.9 | 0.10 | 0.124 |
| Total cholesterol (mmol/l) | 5.0* | 5.1*† | 4.9*‡ | 0.09 | 0.111 |
| LDL (mmol/l) | 3.1 | 3.2 | 3.0 | 0.09 | 0.162 |
| HDL (mmol/l) | 1.2 | 1.3 | 1.2 | 0.03 | 0.370 |
| Triglycerides (mmol/l) | 1.38 | 1.51 | 1.54 | 0.08 | 0.131 |
| Fasting plasma glucose (mmol/l) | 7.7 | 8.3 | 8.0 | 0.26 | 0.108 |
| Fasting plasma insulin (mU/l) | 11.0 | 11.0 | 10.6 | 0.77 | 0.810 |
| HOMA-IR (mU/mmol/l) | 3.9 | 4.2 | 4.0 | 0.34 | 0.799 |
| HOMA-B (mU/mmol) | 52.4 | 51.4 | 47.1 | 3.60 | 0.315 |
| Oxidized LDL (U/l) | 60.0 | 61.3 | 59.0 | 1.70 | 0.396 |
Values are means. Values within the same row with different symbols (*, †, ‡) are different (P < 0.05). P-values compare data across all three dietary phases.
HOMA-B, homeostasis model assessment of β-cell function; HOMA-IR, homeostasis model assessment of insulin resistance.
Table 3.
Daily total energy and macronutrient intake for both groups
| Baseline n = 24 | Standard diet n = 24 | Oat diet n = 24 | sed | P | |
|---|---|---|---|---|---|
| Energy (kJ) | 8716 | 8384 | 8749 | 407.2 | 0.615 |
| Energy (kcal) | 2085 | 2006 | 2093 | 97.4 | 0.615 |
| Fat% of energy | 31.92 | 32.91 | 33.17 | 1.458 | 0.666 |
| Fat (kJ) | 2891 | 2810 | 2936 | 217 | 0.842 |
| Protein% of energy | 19.35*† | 21.11* | 17.96† | 1.326 | 0.068 |
| Protein (kJ) | 1696 | 1685 | 1541 | 92.3 | 0.184 |
| Carbohydrate% of energy | 47.37 | 44.87 | 48.12 | 1.926 | 0.222 |
| Carbohydrate (kJ) | 4024 | 3801 | 4203 | 248.8 | 0.279 |
| Saturated fat% of energy | 11.24 | 10.37 | 10.77 | 0.732 | 0.499 |
| Saturated fat (kJ) | 1025 | 886 | 943 | 85.7 | 0.273 |
| Salt (g) | 8.2 | 7.75 | 7.5 | 0.928 | 0.745 |
| Total sugars (g) | 93.6* | 76.9† | 80.4*† | 6.83 | 0.045 |
| Dietary fibre (g) | 25.83 | 25.43 | 23.88 | 2.39 | 0.691 |
| Portions of fruit and vegetables | 5.2* | 4.7*† | 3.52† | 0.617 | 0.027 |
| Portions of wholegrain foodstuffs | 4.03* | 2.79† | 6.55‡ | 0.559 | < 0.001 |
| Oats (g) | 29.1* | 10.9† | 109.2‡ | 8.11 | < 0.001 |
| Available carbohydrate (g) | 221.4 | 209.6 | 237.7 | 12.9 | 0.148 |
| Glycaemic load | 114.2 | 108.6 | 124.5 | 6.6 | 0.124 |
| Glycaemic index | 50.9 | 50.6 | 52.0 | 1.54 | 0.799 |
Values are means. Values within a row with different symbols (*, †, ‡) are different (P < 0.05).
Table 6.
Means of postprandial values for inflammation and oxidative stress marker responses to the test meal at baseline and after dietary intervention
| Habitual diet | Standard dietary advice | Oat-enriched diet | sed | P | |
|---|---|---|---|---|---|
| C-reactive protein (μg/l)* | 2.33 (1.95–2.80) | 1.93 (1.61–2.31) | 2.20 (1.84–2.63) | 0.35 | 0.420 |
| Interleukin 18 (μg/l) (n = 18) | 362.4 | 440.9 | 380.4 | 20.61 | < 0.001 |
| Adiponectin (μg/l) | 4.80 | 5.01 | 4.85 | 0.14 | 0.452 |
| Thiobarbituric acid reactive substances (μM) | 4.0 | 4.42 | 4.18 | 0.26 | 0.264 |
| Oxygen radical antioxidant capacity (μm TE) | 26.7 | 26.7 | 27.3 | 0.86 | 0.473 |
| Isoprostane/creatinine* | 91.22 (85.53–97.28) | 101.79 (95.44–108.55) | 95.95 (89.96–102.32) | 4.45 | 0.078 |
Values are means.
For C-reactive protein and isoprostane/creatinine, analyses are on log-transformed data. Presented are the back-transformed means with their corresponding back-transformed 95% confidence interval in parentheses.
TE, Trolox-Equivalent.
Results
The food diaries did not reveal any differences in total energy intake or macronutrient composition, including available carbohydrate content, during the three different diet phases (habitual diet, standard dietary advice or oat-enriched diet). During the oat-enriched diet, both oat and portions of wholegrains (as defined by the US Department of Health [18]) consumed increased markedly (P < 0.001), with mean oat intake in excess of 100 g/day (range 42.2–233.2 g/day). This was ∼3 and ∼10 times the intake under habitual diet and standard dietary advice, respectively. There was no difference in dietary glycaemic load (109–125 g/day) or glycaemic index (50–52%) across the three dietary phases (Table3).
Dietary interventions had no effect on fasting plasma values or anthropometric and clinical measurements (Table4). Although there was no overall effect of diet on total cholesterol, values declined by 0.2 mmol/l (P = 0.019, by post-hoc t-test) on the oat-enriched diet compared with standard dietary advice when baseline values were applied as a covariate. The outcomes did not show any effect of period (P for week > 0.05), nor were any crossover effects observed (P for interaction between diet and week > 0.05).
There were no effects of time in the study (week) for any of the measurements.
There were no significant effects (P < 0.05) for measurements of glycaemic control (postprandial hyperglycaemia) derived from the continuous glucose monitoring system between the habitual diet and after 8 weeks on either standard dietary advice or the oat-enriched diet (data not shown).
In response to the test meal, both incremental and total areas under the curve for glucose increased (by 19 and 14%, respectively; P < 0.05) for both the oat-enriched diet and standard dietary adivice compared with the habitual diet (Table5, Fig.1). In contrast, there were no effects of diet on insulin responses to the test meal (Table5, Fig.2), nor in the index of insulin response to glucose.
Table 5.
Glycaemic and insulinaemic response to the standard test meal at baseline and following dietary intervention
| Habitual diet | Standard dietary advice | Oat-enriched diet | sed | Pdiet‡ | |
|---|---|---|---|---|---|
| Incremental area under the curve (AUCi) glycaemia (mmol/l × 180 min) | 492.7* | 589.1† | 585.2† | 35.9 | 0.022 |
| Total area under the curve (AUCt) glycaemia (mmol/l × 180 min) | 1867.7* | 2071.7† | 2031.1† | 67.4 | 0.012 |
| Incremental area under the curve (AUCi) insulinaemia (mmol/l × 180 min) | 9882.5 | 10352.9 | 10372.7 | 523.1 | 0.595 |
| Total area under the curve (AUCt) insulinaemia (mmol/l × 180 min) | 11853.2 | 12326.5 | 12307.9 | 548.3 | 0.653 |
| Insulin secretion in response to glycaemic stimulus (mU/mmol) | 26.8 | 24.7 | 23.6 | 1.88 | 0.243 |
Values are means. Values within the same row with different symbols (*, †) are different (P < 0.05).
‡Pdiet, comparison between dietary phases.
Figure 1.
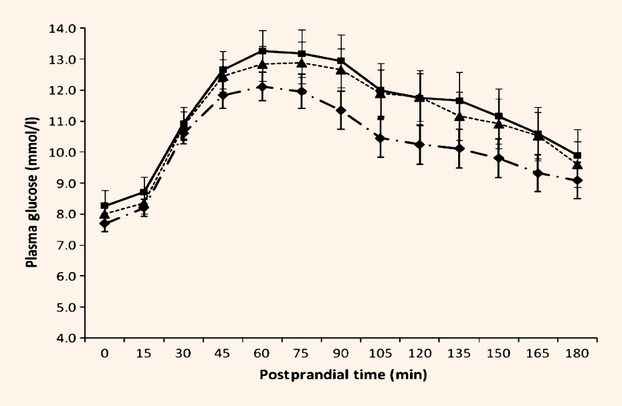
Glycaemic response to standard test meal at baseline and following dietary intervention. Values are means. Habitual (pre-intervention) ( ); standard dietary advice (
 ); oat-enriched diet (
 ). Effect of time, P < 0.001. Effect of diet, P = 0.036. Interaction between postprandial time × diet, P < 0.001.
Figure 2.
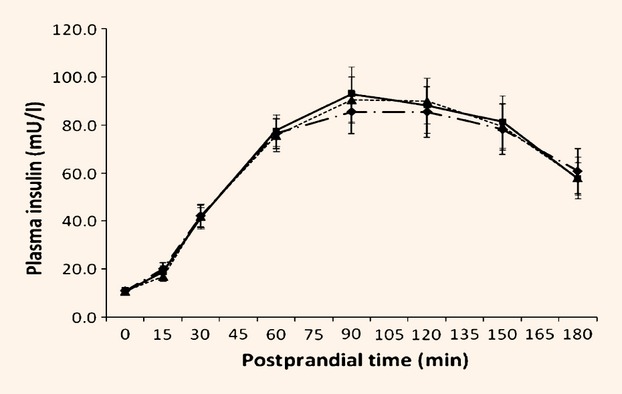
Insulinaemic response to standard test meal at baseline and following dietary intervention. Values are means. Habitual (pre-intervention) (); standard dietary advice (); oat-enriched diet (). Effect of postprandial time, P < 0.001. Effect of diet, P = 0.967. Interaction between postprandial time × diet, P = 0.774.
For nine volunteers, IL-18 concentrations were below the limit of assay detection (9 pg/ml), but for those subjects with detectable IL-18 at baseline (n = 18), both fasted and postprandial values were higher (P = 0.001) following standard dietary advice than either the habitual or oat-enriched diet. There was no effect of diet on fasting or postprandial concentrations of other markers of inflammation or oxidative stress (Table6). However, there was a postprandial decline (P = 0.009) in adiponectin concentrations following the standard test meal. This was not affected by chronic diet (Fig.3).
Figure 3.
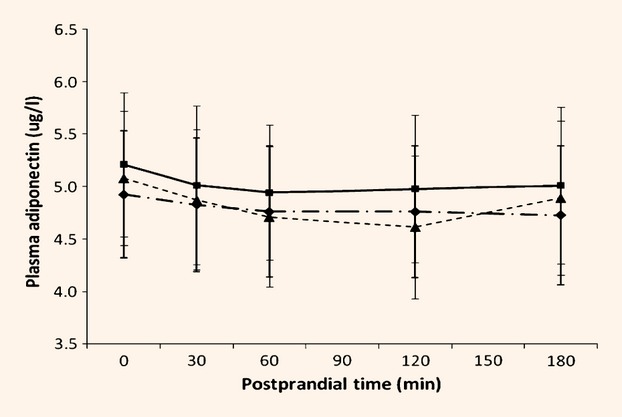
Adiponectin concentrations following the standard test meal at baseline and following dietary intervention. Values are means. Habitual (pre-intervention) (); standard dietary advice (); oat-enriched diet (). Effect of time, P = 0.009. Effect of diet, P = 0.452. Interaction between postprandial time × diet, P = 0.582.
Discussion
The current study demonstrated that a palatable oat-enriched dietary regimen can be developed using readily available products. Judging by weighed food diary data, compliance with the oat-based diet was excellent. Furthermore, oat consumption exceeded the minimum target required for this study (60 g/day). A major strength of the current study is that volunteers followed both test diets at home and so the results represent what can be realistically achieved in the free-living state. The volunteers with Type 2 diabetes were already well controlled by diet alone and the control arm of the study was based on the standard dietary advice offered conventionally. This contrasts with other studies where often dietary extremes are compared [3]. The findings of previous studies would not therefore necessarily reflect improvements that might be achieved over and above following standard dietary advice. Furthermore, the standard test meal used to assess postprandial glycaemic, insulinaemic and inflammatory responses was deliberately designed to represent that which such patients are encouraged to eat. Other researchers have used more extreme and less healthy options [19]–[21]. The current study therefore has, in both design and execution, examined responses from an initial baseline of recommended healthy eating and, as such, will most likely address marginal improvements, but in a clinically relevant context.
Weaknesses of the current study include the small number of volunteers, but many published studies involve similar numbers. Furthermore, power calculations suggest that the total number of volunteers (n = 27) should be sufficient to detect realistic changes (15%) in certain key markers measured. While this study does not achieve the strict dietary control found with a residential programme, it is realistic in terms of free-living lifestyles. Recruitment to nutritional studies is subject to bias as more motivated and health-conscious individuals are likely to volunteer.
Clinical measurements
The current data support previous reports that an oat-enriched diet reduces plasma concentrations of total cholesterol. For example, supplementation with 6 g/day oat-derived β-glucan lowered total cholesterol (from 5.9 to 4.9 mmol/l, 17%) [11]. Porridge oats contain approximately 3.6 g of β-glucan per 100 g, therefore an intake of 6 g/day β-glucan, would require a daily intake of 170 g of oats. This compares with the 109 g/day (range 42.2–233.2 g/day) achieved in the current study, equivalent to daily intakes of β-glucan of 3.9 g (range 1.5–8.4 g/day). This smaller amount of daily β-glucan produced a more modest decrease, albeit from a lower baseline (initial total cholesterol 5.0 mmol/l). The greater reductions previously reported [11] may be attributable to weight loss, whereas the current subjects maintained weight. This is important because it has been shown that weight loss is an effective strategy to reduce lipaemia [22].
Low glycaemic index diets can improve glycaemic control [2] and a low glycaemic index diet reduces postprandial glycaemic excursions and 24-h area under the curve for glucose, as measured by the continuous glucose monitoring system [23]. Many oat products have a reasonably low glycaemic index [9] and regular consumption of these products would help lower the overall diet glycaemic index, with potential improvement in glycaemic control. In the current study, the glycaemic index of the habitual diet was already low at 51. The similarity of diet glycaemic index for the habitual and oat-enriched diets means that substitution of other carbohydrates by the oat products did not lower either the glycaemic index or glycaemic load and this may explain the lack of response in measurements of glycaemic control.
Although the addition of cereal fibre to the diet can improve the glycaemic response to a standard test meal in volunteers with Type 2 diabetes [24], this was not observed in the current study, despite the substantial quantity of oats and wholegrains consumed. This may be in part because of the lack of increase in dietary fibre content, Overall, adoption by the subjects of an improved diet following diagnosis of Type 2 diabetes may have blunted the potential of the oat-enriched diet to increase dietary fibre and exert beneficial effects on glycaemic responses.
Inflammation and oxidative stress
Chronic ingestion of the oat-enriched diet had no effect on fasting concentrations for the markers of oxidative stress and inflammation measured. Previous data suggest that following a low glycaemic index diet for 1 year can reduce CRP [25], although a 6-week intervention with a diet rich in whole grains did not [26]. Fasting CRP concentrations are sensitive to weight loss and exercise [27] and the unchanged body weight and exercise habits in the current study may explain why inflammatory marker concentrations were unaltered.
Arnalich et al. [28] suggested that improved glycaemic control results in decreased thiobarbituric acid reactive substance concentrations, while Botero et al. [29] showed increases in oxygen radical antioxidant capacity concentrations in volunteers with Type 2 diabetes following a low, compared with a high, glycaemic index diet. Furthermore, Rector et al. [30] demonstrated reduced oxidized LDL after lifestyle intervention involving weight loss and aerobic exercise. Again, in the current study the absence of reduced diet glycaemic index, stable body weight and unaltered exercise habits [as assessed by the International Physical Activity Questionnaire (IPAQ) (data not shown)] may account for the lack of effect.
A number of studies have demonstrated a rise in markers of inflammation and oxidative stress in the postprandial period [6],[21],[31], although whether this is linked to postprandial hyperglycaemia [19] or triglyceridaemia [21],[32] is unclear. The current study, in contrast, failed to detect any changes in a wide range of inflammatory and oxidative markers, where the nutritional challenge was provided as a healthy test meal.
There were two exceptions, however. First, although adiponectin declined following the test meal, as previously noted [31], this acute inflammatory response was independent of the chronic dietary intervention. Second, in those subjects with detectable concentrations of the pro-inflammatory cytokine, IL-18, the postprandial values were lower for both the habitual and oat-enriched diet compared with standard dietary advice. The reason for the increase in response to standard dietary advice is unclear and needs further investigation. It is reassuring that the test meal used did not lead to a measurable inflammatory response, in contrast with the artificial high-fat and carbohydrate loads used in earlier studies [19]–[21].
Conclusion
This study has shown no significant differences in measurements of glycaemic control or reduction in postprandial hyperglycaemia following intervention with the oat-enriched diet. A small beneficial effect of oats on plasma lipid profiles was observed and this may have implications for reducing cardiovascular risk profiles. Oats are an easily identified dietary ingredient and so may help people with Type 2 diabetes maintain a low glycaemic index and glycaemic load diet. This would be achieved at no worsening of glycaemic control compared with standard dietary advice and perhaps also with some minor benefits.
Consumption of a relatively healthy test meal produced smaller inflammatory responses than reported using either artificially high-fat or carbohydrate loads [20],[21]. Overall, the results reinforce the importance of adhering to healthy eating advice in Type 2 diabetes in terms of reducing systemic levels of inflammation and oxidative stress, and therefore cardiovascular risk.
Funding sources
Partial funding for this study was provided by a grant from the Chief Scientists Office of the Scottish Government. Additional support came from the Rowett Institute of Nutrition and Health, University of Aberdeen, through the core grant provided by Rural and Environment Science and Analytical Services (RESAS), Scottish Government.
Competing interests
None declared.
Acknowledgments
Partial funding for this study was provided by a grant from the Chief Scientist Office of the Scottish Government (awarded to SCM, AMJ, GEL, DWMP, PA, ILM and SMM). Additional support came from the Rowett Institute of Nutrition and Health, University of Aberdeen, through the core grant provided by Rural and Environment Science and Analytical Services (RESAS), Scottish Government. We would like to thank all the volunteers who participated in this study, as well as Sylvia Hay (Human Nutrition Unit, Rowett Institute of Nurtion and Health) and Fiona Barrett (Clinical Research Facility, University of Highlands and Islands).
References
- 1.NICE. Type 2 Diabetes: National Clinical Guideline for Management in Primary and Secondary Care. London: Royal College of Physicians, National Collaborating Centre for Chronic Conditions; 2008. (update). [PubMed] [Google Scholar]
- 2.Thomas D, Elliott EJ. Low glycaemic index, or low glycaemic load, diets for diabetes mellitus. Cochrane Database Syst Rev. 2009;1:CD006296. doi: 10.1002/14651858.CD006296.pub2. [DOI] [PMC free article] [PubMed] [Google Scholar]
- 3.Brand JC, Colagiuri S, Crossman S, Allen A, Roberts DC, Truswell AS. Low glycaemic index foods improve long-term glycaemic control in NIDDM. Diabetes Care. 1991;14:95–101. doi: 10.2337/diacare.14.2.95. [DOI] [PubMed] [Google Scholar]
- 4.The DECODE Study Group, on behalf of the European Diabetes Epidemiology Group. Glucose tolerance and cardiovascular mortality. Comparison of fasting and 2-hour diagnostic criteria. Arch Intern Med. 2001;161:397–405. doi: 10.1001/archinte.161.3.397. [DOI] [PubMed] [Google Scholar]
- 5.Quagliaro L, Piconi L, Assaloni R, Martinelli L, Motz E, Ceriello A. Intermittent high glucose enhances apoptosis related to oxidative stress in human umbilical vein endothelial cells. The role of protein kinase C and NAD(P)H-oxidase activation. Diabetes. 2003;52:2795–2904. doi: 10.2337/diabetes.52.11.2795. [DOI] [PubMed] [Google Scholar]
- 6.Ceriello A, Quagliaro L, Catone B, Pascon R, Piazzola M, Bais B, et al. Role of hyperglycaemia in nitrotyrosine postprandial generation. Diabetes Care. 2002;25:1439–1443. doi: 10.2337/diacare.25.8.1439. [DOI] [PubMed] [Google Scholar]
- 7.Monnier L, Mas E, Ginet C, Michel F, Villon L, Cristol JP, et al. Activation of oxidative stress by acute glucose fluctuations compared with sustained chronic hyperglycaemia in patients with type 2 diabetes. J Am Med Assoc. 2006;295:1681–1687. doi: 10.1001/jama.295.14.1681. [DOI] [PubMed] [Google Scholar]
- 8.Esposito K, Giugliano D, Nappo F, Marfella R. Regression of carotid atherosclerosis by control of postprandial hyperglycaemia in type 2 diabetes mellitus. Circulation. 2004;110:214–219. doi: 10.1161/01.CIR.0000134501.57864.66. [DOI] [PubMed] [Google Scholar]
- 9.Foster-Powell K, Holt SHA, Brand-Miller JC. International table of glycemic index and glycemic load values. Am J Clin Nutr. 2002;76:5–56. doi: 10.1093/ajcn/76.1.5. [DOI] [PubMed] [Google Scholar]
- 10.Tapola N, Karvonen H, Niskanen L, Mikola M, Sarkkinen E. Glycaemic responses of oat bran products in type 2 diabetes. Nutr Metab Cardiovasc Dis. 2005;15:255–261. doi: 10.1016/j.numecd.2004.09.003. [DOI] [PubMed] [Google Scholar]
- 11.Reyna-Villasmil N, Bermudez-Pirela V, Mengual-Moreno E, Arias N, Cano-Ponce C, Leal-Gonzalez E, et al. Oat-derived β-glucan significantly improves HDLC and diminishes LDLC and non-HDL cholesterol in overweight individuals with mild hypercholesterolaemia. Am J Ther. 2007;14:203–212. doi: 10.1097/01.pap.0000249917.96509.e7. [DOI] [PubMed] [Google Scholar]
- 12.Chen C, Milbury P, Collins FW, Blumberg JB. Avenanthramides are bioavailable and have antioxidant activity in humans after acute consumption of an enriched mixture from oats. J Nutr. 2007;137:1375–1382. doi: 10.1093/jn/137.6.1375. [DOI] [PubMed] [Google Scholar]
- 13.Diabetes UK. Eating well with Diabetes. . Available at http://www.diabetes.org.uk/Guide-to-diabetes/Healthy_lifestyle/Eating_Well/ Last accessed 1 November 2010. [Google Scholar]
- 14.Matthews DR, Hosker JP, Rudenski AS, Naylor BA, Treacher DF, Turner RC. Homeostais model assessment: insulin resistance and β-cell function from fasting plasma glucose and insulin concentrations in man. Diabetologia. 1985;28:412–419. doi: 10.1007/BF00280883. [DOI] [PubMed] [Google Scholar]
- 15.Department of Health. Dietary Reference Values for Food Energy and Nutrients in the United Kingdom. London: Her Majesty’s Stationery Office; 1991. [Google Scholar]
- 16.Food Standards Agency. McCance and Widdowson’s The Composition of Foods. 6th summary edition. Cambridge: Royal Society of Chemistry; 2002. [Google Scholar]
- 17.Ministry of Agriculture Fisheries and Food, Food Standards Agency. 3rd edn. London: The Stationery Office; 1988. Food portion sizes. [Google Scholar]
- 18.US Department of Health and Human Services and US Department of Agriculture. Dietary Guidelines for Americans. 6th edn. Washington DC: US Government Printing Office; 2005. [Google Scholar]
- 19.Ceriello A, Bortolotti N, Motz E, Pieri C, Marra M, Tonutti L, et al. Meal-induced oxidative stress and low density lipoprotein oxidation in diabetes: the possible role of hyperglycaemia. Metabolism. 1999;48:1503–1508. doi: 10.1016/s0026-0495(99)90237-8. [DOI] [PubMed] [Google Scholar]
- 20.Nappo F, Esposito K, Cioffi M, Giugliano G, Molinari AM, Paolisso G, et al. Postprandial endothelial activation in healthy subjects and in Type 2 diabetic patients: role of fat and carbohydrate meals. J Am Coll Cardiol. 2002;39:1145–1150. doi: 10.1016/s0735-1097(02)01741-2. [DOI] [PubMed] [Google Scholar]
- 21.Devaraj S, Wang-Polagruto J, Polagruto J, Keen CL, Jialal I. High-fat, energy-dense, fast-food-style breakfast results in an increase in oxidative stress in metabolic syndrome. Metab Clin Exp. 2008;57:867–870. doi: 10.1016/j.metabol.2008.02.016. [DOI] [PMC free article] [PubMed] [Google Scholar]
- 22.Andersen RE, Wadden TA, Bartlett SJ, Vogt RA, Weinstock RS. Relation of weight loss to changes in serum lipids and lipoproteins in obese women. Am J Clin Nutr. 1995;62:350–357. doi: 10.1093/ajcn/62.2.350. [DOI] [PubMed] [Google Scholar]
- 23.Brynes AE, Lee JL, Brighton RE, Leeds AR, Dornhorst A, Frost GS. A low glycaemic diet significantly improves the 24-h blood glucose profile in people with type 2 diabetes, as assessed using continuous glucose Minimed monitor. Diabetes Care. 2003;26:548–549. doi: 10.2337/diacare.26.2.548. [DOI] [PubMed] [Google Scholar]
- 24.Karlstrom B, Vessby B, Asp NG, Boberg M, Gustafsson IB, Lithell H, et al. Effects of an increased content of cereal fibre in the diet of Type 2 (non-insulin dependent) diabetic patients. Diabetologia. 1984;26:272–277. doi: 10.1007/BF00283649. [DOI] [PubMed] [Google Scholar]
- 25.Wolever TMS, Gibbs AL, Mehling C, Chiasson JL, Connelly PW, Josse RG, et al. The Canadian Trial of Carbohydrates in Diabetes (CCD), a 1-year controlled trial of low glycaemic-index dietary carbohydrate in type 2 diabetes: no effect on glycated haemoglobin but reduction in C-reactive protein. Am J Clin Nutr. 2008;87:114–125. doi: 10.1093/ajcn/87.1.114. [DOI] [PubMed] [Google Scholar]
- 26.Andersson A, Tengblad S, Karlstrom B, Kamal-Eldin A, Landberg R, Basu S, et al. Wholegrain foods do not affect insulin sensitivity or markers of lipid peroxidation in healthy, moderately overweight subjects. J Nutr. 2007;137:1401–1407. doi: 10.1093/jn/137.6.1401. [DOI] [PubMed] [Google Scholar]
- 27.Roberts CK, Won D, Pruthi S, Lin SS, Barnard RJ. Effect of a diet and exercise intervention on oxidative stress, inflammation and monocyte adhesion in diabetic men. Diabetes Res Clin Pract. 2006;73:249–259. doi: 10.1016/j.diabres.2006.02.013. [DOI] [PubMed] [Google Scholar]
- 28.Arnalich F, Hernanz A, Lopez-Maderuelo D, Pena JM, Camacho J, Madero R, et al. Enhanced acute-phase response and oxidative stress in older adults with type 2 diabetes. Horm Metab Res. 2000;32:407–412. doi: 10.1055/s-2007-978662. [DOI] [PubMed] [Google Scholar]
- 29.Botero D, Ebbeling B, Blumberg JB, Ribaya-Mercado JD, Creager MA, Swain JF, et al. Acute effects of dietary glycaemic index on antioxidant capacity in a nutrient-controlled feeding study. Obesity. 2009;17:1664–1670. doi: 10.1038/oby.2009.203. [DOI] [PMC free article] [PubMed] [Google Scholar]
- 30.Rector RS, Warner SO, Liu Y, Hinton PS, Sun GY, Cox RH, et al. Exercise and diet-induced weight loss improves measures of oxidative stress and insulin sensitivity in adults with characteristics of the metabolic syndrome. Am J Physiol Endocrinol Metab. 2007;293:E500–E506. doi: 10.1152/ajpendo.00116.2007. [DOI] [PMC free article] [PubMed] [Google Scholar]
- 31.Esposito K, Nappo F, Giugliano F, Di PaloC, Ciotola M, Barbieri M, et al. Meal modulation of circulating interleukin 18 and adiponectin concentrations in healthy subjects and in patients with type 2 diabetes mellitus. Am J Clin Nutr. 2003;78:1135–1140. doi: 10.1093/ajcn/78.6.1135. [DOI] [PubMed] [Google Scholar]
- 32.Anderson RA, Evans ML, Ellis GR, Graham J, Morris K, Jackson SK, et al. The relationship between postprandial lipaemia, endothelial function and oxidative stress in healthy individuals and patients with type 2 diabetes. Atherosclerosis. 2001;154:475–483. doi: 10.1016/s0021-9150(00)00499-8. [DOI] [PubMed] [Google Scholar]