

Abstract
Background
Molecular biomarkers including isocitrate dehydrogenase 1 or 2 (IDH1/2) mutation, 1p/19q codeletion, and O6-methylguanine-DNA-methyltransferase (MGMT) promoter methylation may improve prognostication and guide treatment decisions for patients with World Health Organization (WHO) anaplastic gliomas. At present, each marker is individually tested by distinct assays. Illumina Infinium HumanMethylation450 BeadChip arrays (HM450) enable the determination of large-scale methylation profiles and genome-wide DNA copy number changes. Algorithms have been developed to detect the glioma CpG island methylator phenotype (G-CIMP) associated with IDH1/2 mutation, 1p/19q codeletion, and MGMT promoter methylation using a single assay.
Methods
Here, we retrospectively investigated the diagnostic and prognostic performance of these algorithms in comparison to individual marker testing and patient outcome in the biomarker cohort (n = 115 patients) of the NOA-04 trial.
Results
Concordance for IDH and 1p/19q status was very high: In 92% of samples, the HM450 and reference data agreed. In discordant samples, survival analysis by Kaplan-Meier and Cox regression analyses suggested a more accurate assessment of biological phenotype by the HM450 analysis. The HM450-derived MGMT-STP27 model to calculate MGMT promoter methylation probability revealed this aberration in a significantly higher fraction of samples than conventional methylation-specific PCR, with 87 of 91 G-CIMP tumors predicted as MGMT promoter-methylated. Pyrosequencing of discordant samples confirmed the HM450 assessment in 14 of 17 cases.
Conclusions
G-CIMP and 1p/19q codeletion are reliably detectable by HM450 analysis and are associated with prognosis in the NOA-04 trial. For MGMT, HM450 suggests promoter methylation in the vast majority of G-CIMP tumors, which is supported by pyrosequencing.
Keywords: 450k, 1p/19q, anaplastic glioma, G-CIMP, MGMT
In recent years, insights into the biology of malignant gliomas have increased considerably, leading to the identification of several clinically useful biomarkers.1 In anaplastic astrocytic, oligodendroglial, and oligoastrocytic gliomas of World Health Organization (WHO) grade III, 3 molecular parameters have been established and extensively characterized as either prognostic or predictive biomarkers.
Combined deletion of chromosomal arms 1p and 19q (1p/19q codeletion), a hallmark of oligodendroglial tumors,2 has emerged as a well-established prognostic marker in gliomas. Initially regarded as prognostic, this chromosomal aberration has also predicted response to combined radio-chemotherapy in the long-term follow-up analyses of 2 large randomized clinical trials of participants with anaplastic oligodendroglial tumors (ie, EORTC-26951 and RTOG-9402).3,4 Both trials consistently showed that mainly patients with 1p/19q codeleted tumors experienced a clinically relevant survival benefit from combined treatment with radiotherapy and procarbazine, CCNU and vincristine (PCV). The molecular mechanisms linking 1p/19q codeletion to increased treatment sensitivity, however, are still poorly understood. In 2011, mutations of CIC (homolog of the drosophila gene capicua) on chromosome 19q and far-upstream element binding protein 1 (FUBP1) on 1p have been identified as potential mechanisms involved in the biology of 1p/19q codeleted gliomas.5
Mutations in the isocitrate dehydrogenase 1 and 2 genes (IDH1/2) were first reported in a small fraction of glioblastomas6 and have since been found in a variable incidence in many gliomas, mostly WHO grades II and III.1 Over 70% of anaplastic gliomas carry an IDH mutation, with higher frequencies in oligodendroglial tumors7 and a strong association with 1p/19q codeletion.8 IDH1/2 mutations are associated with the development of a specific epigenetic hypermethylator signature, the glioma CpG island methylator phenotype (G-CIMP).9,10 They also appear to originate from a distinct cell of origin.11 Randomized clinical trials and larger series have demonstrated a prolonged survival for participants with IDH1/2-mutant anaplastic gliomas.3,12,13 In most studies, however, IDH mutations do not seem to confer benefit from a specific therapy (radio- or chemotherapy) and hence do not yet carry any predictive properties.
Hypermethylation of the O-6-methylguanine-DNA methyltransferase (MGMT) promoter has been determined to predict response to alkylating chemotherapy in glioblastoma.14,15 So far, real-time methylation-specific PCR is the only prospectively validated assay for determining MGMT status in glioblastoma.16,17 Mechanistically, modulation of alkylator sensitivity is well explained because MGMT catalyzes restoration of guanine from O-6-methylguanine, a major genomic lesion induced by alkylating agents. In anaplastic gliomas, however, the situation is more complex. Here, MGMT promoter methylation has been found to be a positive prognostic marker independent of treatment in nonoverlapping series of anaplastic gliomas.12,18 A recent publication has shed light on this issue, proposing an interaction between IDH mutation and MGMT methylation where, in the presence of an IDH1/2 mutation, MGMT promoter methylation is merely prognostic (independent of treatment), while MGMT methylation specifically predicts benefit from alkylating chemotherapy in IDH1/2 wild-type anaplastic gliomas.19
Epigenome-wide analysis of DNA methylation patterns has received increasing attention in brain tumor research, deepening our insight into glioma biology and advancing the classification of tumors.10,20 Recently, algorithms have been developed that enable the assessment of all 3 aforementioned biomarkers from Illumina Infinium HumanMethylation450 (HM450) data.10,20,21 Hybridization of tumor DNA to these arrays allows for methylation profiling of 450 000 CpG sites distributed across the human genome as well as genome-wide copy number profiling.20,22 Moreover, the method is suitable for analysis of routinely processed formalin-fixed and paraffin-embedded (FFPE) tissue samples.22 In the present study, we aimed to assess the reliability and clinical value of HM450-based determination of G-CIMP, 1p/19q codeletion, and MGMT promoter hypermethylation in the biomarker cohort of the NOA-04 trial. NOA-04 was designed to assess the optimal sequence of radio- and chemotherapy in participants with newly diagnosed anaplastic gliomas.12 In NOA-04, IDH1/2 mutations, 1p/19q codeletion, and MGMT promoter methylation were prospectively assessed at a central location, and each marker demonstrated prognostic significance. The NOA-04 trial is hence well suited for investigating the diagnostic (and prognostic) accuracy of HM450-based molecular profiling.
Methods
Patients, Evaluations, and Ethics
The NOA-04 trial (NCT00717210) for patients with newly diagnosed anaplastic gliomas compared the efficacy and safety of initial radiotherapy followed by chemotherapy (temozolomide or procarbazine, lomustine, and vincristine) at progression or occurrence of unacceptable toxicity with the inverse sequence in participants with newly diagnosed anaplastic gliomas. In this trial, both sequences achieved similar results.12 Median follow-up time was 54 months. All participants consented to exploratory molecular analyses performed with study data and materials. The original phase III trial was approved by the Ethics Committee at the University of Tuebingen, Germany, and subsequently all local ethics committees of the participating clinical centers. NOA-04 enrolled participants at 39 sites in Germany after receiving written informed consent including future molecular analyses.
Molecular Analyses
IDH1 codon 132 and IDH2 codon 172 mutations (Sanger sequencing), 1p/19q codeletion (multiplex ligation-dependent probe assay, MLPA) and MGMT promoter methylation (methylation-specific PCR [MSP]23) were centrally determined, as described previously.12,19 For samples with discordance between IDH and G-CIMP status, IDH1R132H immunohistochemistry24 (in samples in which sequencing indicated the presence of an R132H mutation) or DNA reextraction and resequencing of IDH1 codon 132 and IDH2 codon 172 was performed as described.19 MGMT pyrosequencing was performed using Qiagen PyroMark (Qiagen) according to the manufacturer's protocol and evaluated as reported by Quillien et al.25 TERT promoter mutations (C228 and C250) and ATRX status were previously determined.26,27
DNA Extraction and Illumina Infinium HumanMethylation450 BeadChip Array Analyses
A tumor cell content of 80% or more was histologically verified prior to DNA extraction for each tumor specimen. For DNA extraction from FFPE tissue samples, the QIAamp DNA Mini Kit (Qiagen) was used. Methylation analysis of 115 samples using the HM450 BeadChip (Illumina) was performed at the German Cancer Research Center (DKFZ) Genomics and Proteomics Core Facility in Heidelberg with normalization to internal controls.
Marker Assessment
Unsupervised hierarchical clustering of methylation data was performed as described.20 Briefly, probes (i) with a detection P value > .05, (ii) targeting the X and Y chromosomes, (iii) containing a single nucleotide polymorphism within 5 base pairs of and including the CpG site, and (iv) not mapping uniquely to the human reference genome (hg19), allowing for one mismatch, were removed. The 8000 probes most variable by standard deviation were kept, and unsupervised hierarchical clustering was performed.
A logistic regression model to estimate the probability of MGMT promoter methylation from HM450 data was used as described by Bady et al21: From the normalized methylated (m) and unmethylated (u) signal intensities, the M-value was calculated: M-value = log2[(m + 1)/(u + 1)]). The probability of MGMT promoter methylation was calculated as logit(y) = 4.3215 + 0.5271 × M-value(cg12434587) + 0.9265 × M-value(cg12981137). A probability cutoff at 0.358 was used for scoring unmethylated versus methylated.
Copy number aberrations were detected from the HM450 data as described.20,22 Copy number plots were manually analyzed for 1p/19q codeletion.
Statistics
The Fisher' exact test was used to compare categorical data. To model MGMT methylation probability, logistic regression, followed by receiver operating characteristic (ROC) curve analysis (using the pROC package28), was employed. For control of the familywise error rate, the Bonferroni procedure was used. Cox proportional hazards regression analysis was performed for survival analysis. A P value of < .05 was considered as statistically significant. All tests were 2-sided. Analyses were carried out using R version 3.0.129 and Stata IC version 12.1 (StataCorp).
Results
Baseline Patient Characteristics
The present NOA-04 biomarker cohort comprised 115 of the 274 participants in the NOA-04 intention-to-treat (ITT) population, from whom tumor DNA of sufficient amount and quality was available. Baseline characteristics of the biomarker cohort and the ITT population were similar (Table 1), except for an expected enrichment of participants with resection rather than biopsy because of tissue requirements for this analysis. As in the ITT population, time-to-treatment failure (TTF), the primary endpoint of the NOA-04 trial, was similar between both arms (log rank P = .94, Supplementary Fig. S1). Importantly, in univariate Cox regression analysis, each of the 3 molecular biomarkers (IDH1/2 mutation, 1p/19q codeletion, and MGMT promoter methylation) was significantly associated with survival in the biomarker cohort (Table 2).
Table 1.
Baseline participant characteristics
| NOA-04 Biomarker Cohort |
NOA-04 Trial Cohort |
|||
|---|---|---|---|---|
| RT (n = 65) | PCV/TMZ (n = 50) | RT (n = 139) | PCV/TMZ (n = 135) | |
| Median age, years (range) | 42 (23–74) | 41.5 (25–64) | 44 (23–74) | 42 (20–77) |
| Astrocytoma, n (%) | 28 (43%) | 22 (43%) | 70 (50%) | 74 (55%) |
| Oligoastrocytoma, n (%) | 25 (38%) | 20 (40%) | 47 (34%) | 44 (32%) |
| Oligodendroglioma n (%) | 12 (19%) | 8 (17%) | 22 (16%) | 17 (13%) |
| Resection, n (%) | ||||
| Total | 31 (48%) | 22 (44%) | 53 (38%) | 47 (35%) |
| Subtotal | 33 (50.5%) | 27 (54%) | 61 (44%) | 57 (42%) |
| Biopsy | 1 (1.5%) | 1 (2%) | 25 (18%) | 31 (23%) |
| 1p/19q codeletion, n (%) | ||||
| Yes | 27 (46%) | 19 (46%) | 41 (43%) | 33 (38%) |
| No | 31 (54%) | 22 (54%) | 54 (57%) | 53 (62%) |
| Information missing | 7 | 9 | 44 | 49 |
| MGMT promoter, n (%) | ||||
| Methylated | 37 (60%) | 33 (70%) | 59 (57%) | 64 (64%) |
| Unmethylated | 24 (40%) | 14 (30%) | 44 (43%) | 35 (36%) |
| Information missing | 4 | 3 | 36 | 36 |
| IDH mutation, n (%) | ||||
| Yes | 48 (78%) | 35 (74%) | 65 (66%) | 68 (70%) |
| No | 13 (22%) | 12 (26%) | 33 (34%) | 29 (30%) |
| Information missing | 4 | 3 | 41 | 38 |
Abbreviations: PCV, procarbazine, CCNU, and vincristine; RT, radiotherapy; TMZ, temozolomide.
Table 2.
Univariate Cox regression in the NOA-04 biomarker cohort
| Variable | Hazard Ratio | 95% CI | P |
|---|---|---|---|
| IDH mutation vs wild-type | 0.2 | 0.1–0.37 | <.001 |
| 1p/19q codeletion, yes vs no | 0.26 | 0.13–0.55 | <.001 |
| MGMT methylated vs unmethylated | 0.5 | 0.28–0.92 | .026 |
Abbreviations: CI, confidence interval; IDH, isocitrate dehydrogenase; MGMT, O6-methylguanine-DNA-methyltransferase.
G-CIMP (as a Surrogate for IDH1/2 Mutation) and 1p/19q Codeletion Status
Unsupervised hierarchical clustering of the normalized HM450-based methylation data identified 2 main clusters, as described previously. Ninety-one of 115 participants (79%) were grouped in the G-CIMP cluster, while 24 participants (21%) belonged to the non-G-CIMP cluster. As expected, presence of IDH1/2 mutations was strongly associated with the G-CIMP cluster (Table 3; P < .001, Fisher' exact test). However, in 7 participants, a G-CIMP phenotype was detected in the absence of an IDH1/2 mutation. Accordingly, sensitivity and specificity of G-CIMP status for IDH mutation were 98% and 72%, respectively. As depicted in the Kaplan-Meier curve in Fig. 1, the discordant participants (IDH1/2 wild-type but G-CIMP positive) tended to have survival more similar to IDH1/2-mutant/G-CIMP participants rather than IDH wild-type/non-G-CIMP participants, although no definite conclusions can be drawn because of the small number of individuals. This observation is, however, substantiated in a Cox regression analysis including both IDH and G-CIMP status (Table 4) in which only the G-CIMP status was significantly associated with TTF. The results for progression-free survival (PFS) were similar (data not shown), but the small number of events precluded statistical testing for overall survival (OS). Upon reassessment of the IDH status of these 7 participants by IDH1R132H immunohistochemistry or DNA reextraction and resequencing, 6 of the 7 samples were indeed IDH mutant. Further speaking to a correct assessment of the biological phenotype by the G-CIMP status is the observation that 3 of these 7 samples had a 1p/19q codeletion, which only occurs in IDH-mutant tumors.8 On the other hand, 2 participants with IDH mutation did not show the G-CIMP phenotype. For one of them, enough tissue of sufficient quality (vital tumor content > 80%) to reextract DNA and resequence IDH1 codon 132 and IDH2 codon 172 was available: As expected, no mutation was found, confirming that this sample was indeed IDH wild-type.
Table 3.
IDH and G-CIMP status per NOA-04 assessment and HM450
| G-CIMP | Non-G-CIMP | |
|---|---|---|
| Tabulation of IDH mutation and G-CIMP status | ||
| IDH mutant | 81 | 2 |
| IDH wild-type | 7 | 18 |
Abbreviations: G-CIMP, glioma CpG island methylator phenotype; HM450, Illumina HumanMethylation450 BeadChip; IDH, isocitrate dehydrogenase.
Fig. 1.
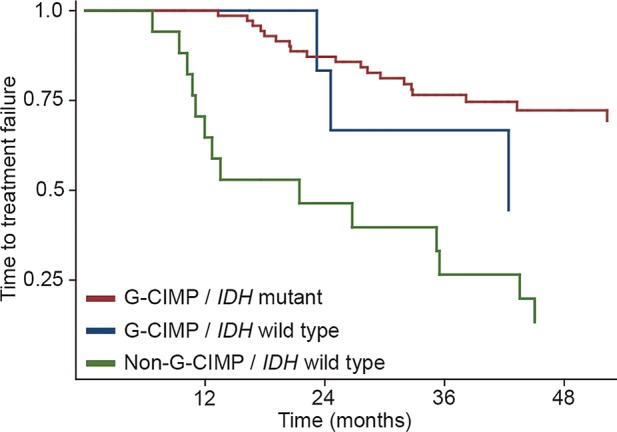
Time-to-treatment failure by G-CIMP/IDH status. The non-G-CIMP/IDH-mutant group contained only 2 cases and display of KM-curves was therefore not considered relevant.
Table 4.
IDH and G-CIMP status per NOA-04 assessment and HM450
| Variable | Hazard Ratio | 95% CI | P |
|---|---|---|---|
| Cox regression for IDH and G-CIMP status | |||
| IDH mutation vs wild-type | 0.45 | 0.15–1.3 | .14 |
| G-CIMP vs non-G-CIMP | 0.32 | 0.1–0.94 | .038 |
Abbreviations: CI, confidence interval; G-CIMP, glioma CpG island methylator phenotype; HM450, Illumina HumanMethylation450 BeadChip; IDH, isocitrate dehydrogenase.
Analysis of DNA copy-number data generated from the HM450 data revealed combined deletions of 1p and 19q in 41 of 115 participants (35%; example given in Fig. 2a). As expected, the frequency of 1p/19q codeletion varied among the histological tumor types: It was rare in anaplastic astrocytoma (1/50) but rather common in tumors with at least an oligodendroglial component (25/45 oligoastrocytomas and 15/20 oligodendrogliomas; P < .001; Fisher' exact test). Agreement of 1p/19q status between MLPA and HM450 was observed in 91 of 99 samples (Table 5; P < .001; Fisher' exact test). Sensitivity and specificity of HM450 for detection of 1p/19q codeletion with MLPA set as standard were 84% and 98%, respectively. In 7 samples, the HM450 data did not show 1p/19q codeletion, whereas MLPA indicated this lesion. Kaplan-Meier analysis (Fig. 2b) revealed a similar clinical course for these discordant samples and those in which the tumors lacked 1p/19q codeletion. Cox regression analysis including 1p/19q status from both techniques corroborated this, as again only 1p/19q status computed from HM450 data was significantly associated with survival (Table 6). An overview of clinical and pathological characteristics of all discordant samples is given in Supplementary Table S4.
Fig. 2.
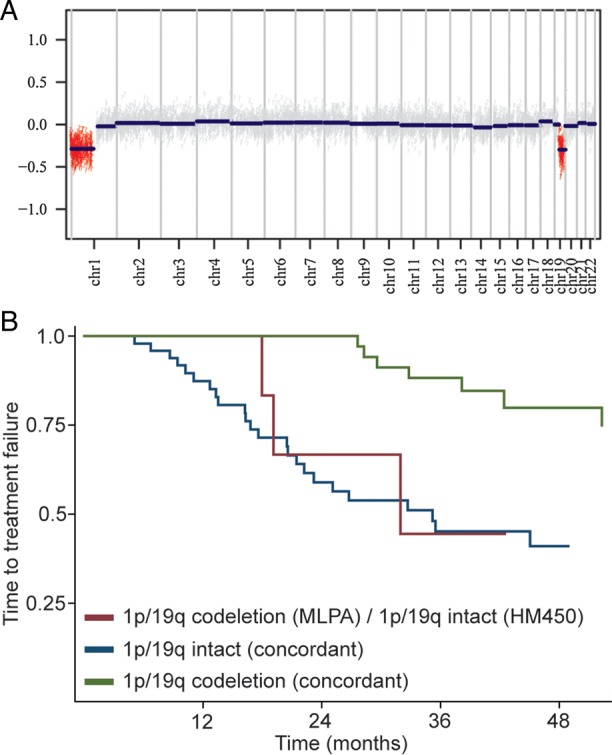
1p/19q status. (a) Example of a copy number plot generated from HumanMethylation450 data of a participant with 1p/19q codeletion. (b) Kaplan-Meier curve for time-to-treatment failure based on 1p/19q status (assessed by MLPA and HumanMethylation450). The 1 discordant sample with 1p/19q codeletion per HumanMethylation450 and intact 1p/19q status (MLPA) was omitted.
Table 5.
1p/19q status by MLPA and HM450 BeadChip
| 1p/19q Codeleted (HM450) | 1p/19q Intact (HM450) | |
|---|---|---|
| Tabulation of 1p/19q status | ||
| 1p/19q codeletion (MLPA) | 39 | 7 |
| 1p/19q intact (MLPA) | 1 | 52 |
Abbreviation: HM450, Illumina HumanMethylation450 BeadChip.
Table 6.
1p/19q status by MLPA and HM450 BeadChip
| Variable | Hazard Ratio | 95% CI | P |
|---|---|---|---|
| Cox regression for 1p/19q status | |||
| 1p/19q codeletion, yes vs no (MLPA) | 0.875 | 0.28–2.69 | .817 |
| 1p/19q codeletion, yes vs no (HM450) | 0.22 | 0.06–0.79 | .021 |
CI, confidence interval; HM450, Illumina HumanMethylation450 BeadChip; MLPA, multiplex ligation-dependent probe assay.
MGMT Promoter Methylation
Bady et al proposed a logistic regression model (MGMT-STP27) to predict MGMT promoter methylation status from 2 CpG sites assayed both by the HM27 and HM450 BeadChips.21 Applying this algorithm to the NOA-04 dataset indicated that 99 of 115 participants had a methylated MGMT promoter (86%), as opposed to 70 of 108 as assessed by MSP (65%). While the MGMT-STP27 algorithm indicated differential MGMT methylation in the non-G-CIMP participants (Supplementary Table S1a), virtually all G-CIMP participants were considered to have a methylated MGMT promoter based on the HM450 algorithm (87/91). Cox regression analysis, including both MSP and MGMT-STP27 status, clearly demonstrated a closer association of MGMT status per MGMT-STP27 with survival (Supplementary Table S5). Interestingly, the concordance of MGMT between the 2 assays was different for the histological tumor types with good concordance (15/17, 88%) in oligodendrogliomas and worse concordance in astrocytomas (19/31, 61%).
Constructing a 95% confidence interval (based on the standard error of the fit) for each prediction resulted in 9 samples being considered unclassifiable (as the confidence interval for methylation probability crossed the cutoff). To improve the prediction model for MGMT promoter methylation in the G-CIMP-positive tumors, we reevaluated the 18 CpG sites within the MGMT 5′-CpG island originally investigated by Bady et al in our cohort of 88 participants with G-CIMP positive tumors with known MGMT promoter methylation status determined by MSP analysis. After Bonferroni adjustment to correct for type I error inflation, 5 CpG probes were significantly associated (per univariate logistic regression) with MGMT methylation probability (Supplementary Table S2). Notably, this group contained both probes (cg12434587 and cg12981137) included in the MGMT-STP27 model. The remaining probes were located near both of these 2 probes (Supplementary Fig. S2). Next, we built stepwise prediction models from these probes. To limit overfitting, we used Akaike' information criterion (AIC) with the default parameter (k = 2) for factor penalization. This approach yielded 2 models with similar area under the curve (AUC) and AIC values (Table 7), one of them being the MGMT-STP27 (albeit with different regression coefficients and cutpoint). The ROC curves are shown in Fig. 3. Supplementary Table S3 lists the predicted MGMT promoter methylation status for both models. Given the limited diagnostic accuracy of both models, MGMT methylation status as calculated from any of these 2 models was not significantly associated with outcome (Supplementary Table S3). To resolve the discrepancy between the MGMT-STP27 and MSP findings, we performed MGMT pyrosequencing on all 17 discordant G-CIMP samples (methylated per MGMT-STP27, unmethylated per MSP) for which enough DNA of sufficient quality was left: Using a predefined mean methylation of 8% as cutoff,25 14 samples were classified as MGMT methylated and only 3 as MGMT unmethylated.
Table 7.
MGMT methylation probability models
| Model formula | Cutpoint | Sens. | Spec. | AUC | AIC |
|---|---|---|---|---|---|
| logit(y) = 1.3669 + (0.5305 × cg14194875) + (0.5691 × cg12981137) | 0.674 | 0.838 | 0.807 | 0.848 | 86.656 |
| logit(y) = 1.6768 + (0.0.3427 × cg12434587) + (0.6353 × cg12981137) | 0.765 | 0.709 | 0.884 | 0.84 | 86.686 |
Abbreviations: AIC, Akaike information criterion; AUC, area under the curve; Sens., sensitivity; Spec., specificity.
Fig. 3.

MGMT promoter methylation prediction. ROC curves for the 2 models with the best fit (per Akaike information criterion).
Relationship Between IDH1/2 Mutation/G-CIMP, 1p/19q Codeletion and MGMT Promoter Methylation
In this series, 93% (43/46) of all tumors with a 1p/19q codeletion (MLPA) carried an IDH mutation. Considering the HM450 data, all 41 samples with 1p/19q codeletion clustered in the G-CIMP group. Almost all 1p/19q codeleted tumors (HM450) displayed a methylated MGMT promoter (37/41). In general, the frequency of MGMT promoter hypermethylation was higher in tumors with an IDH mutation: Seventy-three percent (61/83) of tumors with an IDH1/2 mutation, as opposed to 36% (9/25) of the IDH1/2 wild-type tumors, had MGMT promoter methylation (see also19). For G-CIMP, 1p/19q and MGMT (all assessed via the HM450), Cox regression demonstrated a prognostic impact independent of reference histology (Supplementary Table S6).
Discussion
For optimal management of patients with anaplastic gliomas, there is a clinical need for reliable information on 1p/19q, IDH1/2, and MGMT status.30 Thus, molecular testing for these markers is increasingly being requested in neuro-oncology. Additional information derived from genome-wide analyses may be valuable, both for molecular subgrouping of tumors10,31 and identification of novel therapeutic targets.32 The Illumina Infinium HumanMethylation450 BeadChip array platform, which has been shown to separate glioblastoma into 6 biologically meaningful molecular subgroups,20 allows simultaneous assessment of these 3 most relevant biomarkers in anaplastic gliomas and also provides a powerful tool for future discoveries. In the present study, we have evaluated the diagnostic and prognostic reliability of biomarker assessment based on the HM450 array in a subgroup of participants in the NOA-04 trial and thus asked whether this technology, where available, may replace separate single marker testing. While G-CIMP and 1p/19q status were determined concordantly with the single marker tests, MGMT promoter methylation assessment differed considerably between MSP and the HM450-derived algorithm, especially in the G-CIMP tumors. Here, pyrosequencing of discordant samples implied that most G-CIMP anaplastic gliomas in fact carry a methylated MGMT promoter, as suggested by the HM450.
For determination of IDH1/2 mutation, 1p/19q codeletion, and MGMT promoter methylation status, a plethora of diagnostic methods exists without a uniformly agreed-upon “gold standard.” Tissue requirements (both source and amount), as well as costs for testing, constitute further issues to be considered. For the assessment of IDH mutation, sequencing of IDH1 codon 132 and IDH2 codon 172 as well as immunohistochemistry targeted against IDH1R132H are the most commonly used methods.33 While immunohistochemistry is a well-established technique with minimal tissue requirements, it misses the (albeit rarely) IDH mutations other than IDH1R132H.24 Sequencing, on the other hand, may miss low-level mutations. Fluorescence in situ hybridization (FISH) is probably the most commonly used assay nowadays to determine the 1p/19q status.34 It can easily be performed without the need for DNA extraction, hence avoiding dilution by normal cells. However, most commercially available probes are not able to distinguish between partial and total deletions. Two smaller series have demonstrated a strong correlation between 1p/19q status as assessed by FISH and MLPA.35,36 For determination of the MGMT promoter methylation status, an even larger number of distinct diagnostic assays exist including MSP, pyrosequencing, methylation-sensitive high-resolution melting or MethyLight, and others.37 The original report of the predictive value of MGMT methylation in glioblastoma was performed using MSP.14 To date, real-time MSP is the only prospectively validated test for MGMT promoter methylation assessment in glioblastoma.16 However, an internationally accepted consensus about the most appropriate diagnostic method to be used for MGMT testing is still missing. Unfortunately, most other methodologies lack published validation according to guidelines for molecular diagnostics. In practice, the choice of method thus preferentially depends upon the individual experience, equipment of each laboratory (eg. availability of a pyrosequencer or real-time PCR machine), and the level of validation.
Both for the IDH1/2/G-CIMP and 1p/19q status, our comparative analyses of the NOA-04 biomarker cohort revealed only small subsets of samples showing discordant results when tested by HM450 arrays versus individual assays (ie, IDH1/2 sequencing and 1p/19q MLPA), respectively. In our series, 7 IDH1/2 wild-type tumors by sequencing of codon 132 and 172, respectively, demonstrated G-CIMP (Table 3), which in part may be false-negative results due to weak signaling in the direct Sanger sequencing.33 Consequently, reexamination of these 7 samples revealed that 6 tumors actually carried an IDH mutation, as correctly predicted by the HM450 array. Conversely, of the 2 samples with IDH mutation but without a G-CIMP, one sample could be reanalyzed; no IDH mutation was found, indicating that the initially reported IDH mutation was a false-positive result. Considering that IDH mutation causes the G-CIMP,9 this is not surprising and suggests that the other sample will probably also be a false-positive IDH mutation. Similarly, in the few discordant 1p/19q samples (1p/19q codeleted based on MLPA, 1p/19q intact per HM450), the clinical course and pathological characteristics tended to correlate with the HM450 data (Fig. 2b, Table 6, Supplementary Table S4): Four of these 7 discordant samples were classified as anaplastic astrocytoma in reference histology; of the remaining 3 samples, one was classified as G-CIMP negative. In a previous analysis, we identified 3 samples carrying both ATRX (alpha-thalassemia/mental retardation syndrome X-linked) loss and 1p/19q codeletion, which should be mutually exclusive.27 Of these, 2 had an intact 1p/19q status per HM450, while the third was not included in this cohort. TERT promoter mutations are strongly associated with the presence of 1p/19q codeletion in IDH-mutant gliomas.38 Further supporting the HM450 1p/19q results, in 6 of the 7 samples in which HM450-based 1p/19q analysis indicated no codeletion (while MLPA did), TERT promoter status was wild-type, while a TERT promoter mutation was found in one sample in which HM450 indicated 1p/19q codeletion as opposed to MLPA. Taken together, the 1p/19q MLPA assessment of the initial NOA-04 trial likely resulted in a number of misclassified samples and an overestimation of the rate of 1p/19q codeleted tumors. This may be explained by the rather low threshold chosen in the initial MLPA assessment, in which 2 adjacent gene loci with a gene dosage ratio <70% were considered as evidence of chromosome arm deletion.
In anaplastic gliomas, MGMT promoter methylation is merely prognostic and not predictive for a benefit from alkylating chemotherapy, which is most likely due to an interaction with the IDH1/2 mutation status.19 The MGMT-STP27 model with reported AUC of 0.97, sensitivity of 0.97, and specificity of 0.89 in G-CIMP negative tumors21 predicted MGMT promoter methylation in the vast majority of G-CIMP positive tumors (87/91) as opposed to the MSP (62/88 tumors methylated, 3 samples missing MGMT data). This strong association between MGMT methylation and IDH mutation was noted previously in the original report by Bady et al21 and has also been shown by others using pyrosequencing.39 Cox regression analysis, including both MSP and MGMT-STP27 status, clearly demonstrated a closer association of MGMT status per MGMT-STP27 with survival (Supplementary Table S5). There was a clear association of the discordant MGMT assessment with histological subtype (high rates of discordant samples, especially in astrocytomas). This may be a result of a lower sensitivity of MSP assessment in the more diffuse astrocytic tumors compared with the often more compact oligodendroglial tumors and may also influence survival analysis. Using our cohort of 88 G-CIMP participants with known MGMT promoter methylation status as determined by MSP, we tried to build a new MGMT prediction model for G-CIMP tumors based on the probes identified by Bady et al21 Malley et al defined 2 regions in the MGMT CpG island where hypermethylation was significantly associated with reduced MGMT mRNA expression (differentially methylated regions [DMR]).40 Of these, pyrosequencing of DMR2 (chr10:131,265,496–131,265,626) demonstrated hypermethylation in almost all adult IDH-mutant gliomas.39 This region is also covered by the forward and reverse MSP primers used in NOA-04 as well as 2 of the 5 cg probes on the HM450 significantly associated with MGMT methylation (cg02802904 and cg12981137) (Supplementary Fig. S2). Importantly, cg12981137 is contained in the MGMT-STP27 model as well as in the 2 newly fitted models. However, the 2 models for which AIC indicated the best fit resulted in an AUC of only 0.84 in ROC analysis (Table 7 and Fig. 3). Consequently, both models were not significantly associated with survival (Supplementary Table S3). To resolve the discrepancy between the MGMT-STP27 and MSP findings, we performed MGMT pyrosequencing on all 17 discordant G-CIMP samples (methylated per MGMT-STP27, unmethylated per MSP) for which enough DNA of sufficient quality was left: Using a predefined mean methylation of 8% as cutoff,25 14 samples were classified as MGMT methylated and only 3 as MGMT unmethylated, further supporting the notion that most IDH-mutant/G-CIMP anaplastic gliomas carry a methylated MGMT promoter.
Because of the dense genomic coverage of the HM450, copy number analysis is possible, in addition to methylation profiling, as demonstrated.20 This allows identification of multiple important and immediately relevant molecular aberrations1 using a single array, even retrospectively in archival tissue. Furthermore, while, some samples lacked molecular information (mostly 1p/19q status12) in the original NOA-04 trial, these parameters could be completely assessed for all participants based on the HM450 data. While the reported observations point toward very good diagnostic and prognostic accuracy of the HM450 data, it is important to note that this comparison was not prespecified even though this was a prospective, well documented, and homogenous trial cohort. Furthermore, the subset of participants investigated here is not necessarily representative of the entire NOA-04 trial cohort (even though the main prognostic factors and equivalence of both treatment arms were recapitulated) and may be subject to bias, although all participants with sufficient tumor DNA were included.
The HM450 approach thus accurately identified G-CIMP and 1p/19q status in this NOA-04 cohort. In discordant samples, the result from the HM450 data seemed to be clinically more useful because they appeared to better predict patient outcome and were usually confirmed by reanalysis of discordant samples using different diagnostic tests. In addition to the biomarker information, the HM450 array yields epigenome-wide methylation data, which provide a powerful dataset for future discoveries.10,20 For MGMT methylation, the HM450 data indicates that most G-CIMP tumors carry a methylated MGMT promoter (as opposed to the MSP data), which is supported by other studies and pyrosequencing of the discordant samples. In conclusion, these NOA-04-based results are encouraging. They should be verified in an independent trial, such as EORTC-26951 or CATNON.
Supplementary material
Funding
The work was supported by the German Cancer Aid (Deutsche Krebshilfe, “Molecular classification of anaplastic gliomas in the NOA-04 trial“, project 110624) to WW and MW.
Supplementary Material
Acknowledgments
Some of the authors (G.R., M.W. and W.W.) conducting this work represent the Neurooncology Working Group (NOA) of the German Cancer Society.
We are indebted to the patients and their families for agreeing to participate in the NOA-04 trial as well as to the study nurses and data managers for their collaboration.
The following institutions and investigators in Germany participated in the trial: Klinikum Aschaffenburg (S. Kaendler); Nervenklink, Bamberg, Germany (P. Krauseneck); Charité Universitätsmedizin Berlin, Berlin (G.Auf, M. Kufeld, F. Stockhammer); Universitätsklinikum (UK) Düsseldorf, Düsseldorf (M. Rapp, M.C. Sabel); UK Erlangen, Erlangen (I Blümcke, G.G. Grabenbauer, W. Wolf); UK Essen, Essen (P. Cicotti, H.C. Diener, R. Egensperger, C. Ehrenfeld, K.W. Schmidt); UK Frankfurt, Frankfurt am Main (K. Franz); UK Giessen-Marburg, Campus Giessen (K. Kuchelmeister, U. Nestler, M. Winking); UK Greifswald, Greifswald (E. Asse, M. Montemurro); Allgemeines Krankenhaus Hagen, Hagen (G. Ansorge, R. Souchon); UK Halle-Wittenberg, Halle (C. Holz); Henriettenstiftung Krankenhaus Hannover, Hannover (B. Wiese); Med. Hochschule; Hannover (C.A. Tschan); UK Heidelberg, Heidelberg (M. Vogt-Schaden); KKH Heidenheim, Heidenheim (D. Steder); UK Homburg (R. Ketter, W.I. Steudel); UK Jena, Jena (A. Hochstetter); UK Schleswig-Holstein, Campus Kiel (H.-H. Hugo, M. Mehdorn, S. Mihajlovic, S. Schultka); UK Köln, Köln (G. Garlip); Klinikum Ludwigsburg, Ludwigsburg (M. Schabet, E. Weimann); UK Schleswig-Holstein, Campus Lübeck (A.C. Feller, T. Niehoff, M. Nitschke, E. Reusche); UK Mainz, Mainz (H. Müller, C. Sommer, D Wiewrodt); UK Giessen-Marburg, Campus Marburg (R Engenhart-Cabillic, M Groß); Klinikum Im Mühlenkreis, Minden (F. Haukamp); Klinikum Großhadern, München (C. Dudel); Klinikum Rechts der Isar, München (C. Nieder, S. Reitz); Praxis Hoffmann, Norderstedt (R. Hoffmann); Praxis Heide/Thiel, Stade (J. Heide, C. Thiel); Klinikum Nürnberg, Nürnberg (G. Schmidt, K. Westphal); Bezirkskrankenhaus Regensburg, Regensburg (U. Bogdahn, P. Hau, B. Hirschmann); Katharinenhospital, Stuttgart (C. Seidenberg); UK Tübingen, Tübingen (M. Bamberg, U. Herrlinger, R. Kortmann, R. Meyermann, M. Platten, F. Schmidt, J. Steinbach, M. Weller, W. Wick); Marienhospital, Vechta (J. Diers); Kliniken St. Antonius, Velbert (I. Blaeser); Städt. Klinik, Zwickau (E. Hamann).
We thank Matthias Schick and Roger Fischer from the DKFZ Genomics Core Facility for performing the microarray analyses to a very high standard. The work was supported by the German Cancer Aid (Deutsche Krebshilfe, “Molecular classification of anaplastic gliomas in the NOA-04 trial“) to WW and MW.
Conflict of interest statement: M.P. reports having received consulting and lecture fees from Merck-Serono, Medac, and Novartis as well as research support from Merck-Serono and Novartis. G.R. has received a research grant from Roche and honoraria from advisory boards of Roche and Merck-Serono. MW declares associations with the following companies: Antisense Pharma/Insarna, Bayer, MagForce, Merck Serono, MSD, and Roche. W.W. reports having received consulting and lecture fees from MSD and Roche as well as research support from Apogenix, Boehringer Ingelheim, Eli Lilly, MSD, and Roche. He serves on the Steering Committee of the AVAglio and CENTRIC trials and is lead investigator of other trials in glioma. D.C., A.v.D., M.W., and W.W. receive royalties from the invention of the IDH1 R132H antibody. All other authors have no conflict of interest.
References
- 1.Weller M, Pfister SM, Wick W, et al. Molecular neuro-oncology in clinical practice: a new horizon. Lancet Oncol. 2013;14(9):e370–e379. doi: 10.1016/S1470-2045(13)70168-2. [DOI] [PubMed] [Google Scholar]
- 2.Smith JS, Perry A, Borell TJ, et al. Alterations of chromosome arms 1p and 19q as predictors of survival in oligodendrogliomas, astrocytomas, and mixed oligoastrocytomas. J Clin Oncol. 2000;18(3):636–645. doi: 10.1200/JCO.2000.18.3.636. [DOI] [PubMed] [Google Scholar]
- 3.Van den Bent MJ, Brandes AA, Taphoorn MJB, et al. Adjuvant procarbazine, lomustine, and vincristine chemotherapy in newly diagnosed anaplastic oligodendroglioma: long-term follow-up of EORTC brain tumor group study 26951. J Clin Oncol. 2013;31(3):344–350. doi: 10.1200/JCO.2012.43.2229. [DOI] [PubMed] [Google Scholar]
- 4.Cairncross G, Wang M, Shaw E, et al. Phase III trial of chemoradiotherapy for anaplastic oligodendroglioma: long-term results of RTOG 9402. J Clin Oncol. 2013;31(3):337–343. doi: 10.1200/JCO.2012.43.2674. [DOI] [PMC free article] [PubMed] [Google Scholar]
- 5.Bettegowda C, Agrawal N, Jiao Y, et al. Mutations in CIC and FUBP1 contribute to human oligodendroglioma. Science. 2011;333(6048):1453–1455. doi: 10.1126/science.1210557. [DOI] [PMC free article] [PubMed] [Google Scholar]
- 6.Parsons DW, Jones S, Zhang X, et al. An integrated genomic analysis of human glioblastoma multiforme. Science. 2008;321(5897):1807–1812. doi: 10.1126/science.1164382. [DOI] [PMC free article] [PubMed] [Google Scholar]
- 7.Yan H, Parsons DW, Jin G, et al. IDH1 and IDH2 mutations in gliomas. N Engl J Med. 2009;360(8):765–773. doi: 10.1056/NEJMoa0808710. [DOI] [PMC free article] [PubMed] [Google Scholar]
- 8.Labussière M, Idbaih A, Wang X-W, et al. All the 1p19q codeleted gliomas are mutated on IDH1 or IDH2. Neurology. 2010;74(23):1886–1890. doi: 10.1212/WNL.0b013e3181e1cf3a. [DOI] [PubMed] [Google Scholar]
- 9.Turcan S, Rohle D, Goenka A, et al. IDH1 mutation is sufficient to establish the glioma hypermethylator phenotype. Nature. 2012;483(7390):479–483. doi: 10.1038/nature10866. [DOI] [PMC free article] [PubMed] [Google Scholar]
- 10.Noushmehr H, Weisenberger DJ, Diefes K, et al. Identification of a CpG island methylator phenotype that defines a distinct subgroup of glioma. Cancer Cell. 2010;17(5):510–522. doi: 10.1016/j.ccr.2010.03.017. [DOI] [PMC free article] [PubMed] [Google Scholar]
- 11.Lai A, Kharbanda S, Pope WB, et al. Evidence for sequenced molecular evolution of IDH1 mutant glioblastoma from a distinct cell of origin. J Clin Oncol. 2011;29(34):4482–4490. doi: 10.1200/JCO.2010.33.8715. [DOI] [PMC free article] [PubMed] [Google Scholar]
- 12.Wick W, Hartmann C, Engel C, et al. NOA-04 randomized phase III trial of sequential radiochemotherapy of anaplastic glioma with procarbazine, lomustine, and vincristine or temozolomide. J Clin Oncol. 2009;27(35):5874–5880. doi: 10.1200/JCO.2009.23.6497. [DOI] [PubMed] [Google Scholar]
- 13.Sanson M, Marie Y, Paris S, et al. Isocitrate dehydrogenase 1 codon 132 mutation is an important prognostic biomarker in gliomas. J Clin Oncol. 2009;27(25):4150–4154. doi: 10.1200/JCO.2009.21.9832. [DOI] [PubMed] [Google Scholar]
- 14.Hegi ME, Diserens A-C, Gorlia T, et al. MGMT gene silencing and benefit from temozolomide in glioblastoma. N Engl J Med. 2005;352(10):997–1003. doi: 10.1056/NEJMoa043331. [DOI] [PubMed] [Google Scholar]
- 15.Wick W, Platten M, Meisner C, et al. Temozolomide chemotherapy alone versus radiotherapy alone for malignant astrocytoma in the elderly: the NOA-08 randomised, phase 3 trial. Lancet Oncol. 2012;13(7):707–715. doi: 10.1016/S1470-2045(12)70164-X. [DOI] [PubMed] [Google Scholar]
- 16.Gilbert MR, Wang M, Aldape KD, et al. Dose-dense temozolomide for newly diagnosed glioblastoma: a randomized phase III clinical trial. J Clin Oncol. 2013;31(32):4085–4091. doi: 10.1200/JCO.2013.49.6968. [DOI] [PMC free article] [PubMed] [Google Scholar]
- 17.Vlassenbroeck I, Califice S, Diserens A-C, et al. Validation of real-time methylation-specific PCR to determine O6-methylguanine-DNA methyltransferase gene promoter methylation in glioma. J Mol Diagn. 2008;10(4):332–337. doi: 10.2353/jmoldx.2008.070169. [DOI] [PMC free article] [PubMed] [Google Scholar]
- 18.Van den Bent MJ, Dubbink HJ, Sanson M, et al. MGMT promoter methylation is prognostic but not predictive for outcome to adjuvant PCV chemotherapy in anaplastic oligodendroglial tumors: a report from EORTC Brain Tumor Group Study 26951. J Clin Oncol. 2009;27(35):5881–5886. doi: 10.1200/JCO.2009.24.1034. [DOI] [PMC free article] [PubMed] [Google Scholar]
- 19.Wick W, Meisner C, Hentschel B, et al. Prognostic or predictive value of MGMT promoter methylation in gliomas depends on IDH1 mutation. Neurology. 2013;81(17):1515–1522. doi: 10.1212/WNL.0b013e3182a95680. [DOI] [PubMed] [Google Scholar]
- 20.Sturm D, Witt H, Hovestadt V, et al. Hotspot mutations in H3F3A and IDH1 define distinct epigenetic and biological subgroups of glioblastoma. Cancer Cell. 2012;22(4):425–437. doi: 10.1016/j.ccr.2012.08.024. [DOI] [PubMed] [Google Scholar]
- 21.Bady P, Sciuscio D, Diserens A-C, et al. MGMT methylation analysis of glioblastoma on the Infinium methylation BeadChip identifies two distinct CpG regions associated with gene silencing and outcome, yielding a prediction model for comparisons across datasets, tumor grades, and CIMP-status. Acta Neuropathol. 2012;124(4):547–560. doi: 10.1007/s00401-012-1016-2. [DOI] [PMC free article] [PubMed] [Google Scholar]
- 22.Hovestadt V, Remke M, Kool M, et al. Robust molecular subgrouping and copy-number profiling of medulloblastoma from small amounts of archival tumour material using high-density DNA methylation arrays. Acta Neuropathol. 2013;125(6):913–916. doi: 10.1007/s00401-013-1126-5. [DOI] [PMC free article] [PubMed] [Google Scholar]
- 23.Krex D, Klink B, Hartmann C, et al. Long-term survival with glioblastoma multiforme. Brain. 2007;130(10):2596–2606. doi: 10.1093/brain/awm204. [DOI] [PubMed] [Google Scholar]
- 24.Capper D, Weissert S, Balss J, et al. Characterization of R132H mutation-specific IDH1 antibody binding in brain tumors. Brain Pathol. 2010;20(1):245–254. doi: 10.1111/j.1750-3639.2009.00352.x. [DOI] [PMC free article] [PubMed] [Google Scholar]
- 25.Quillien V, Lavenu A, Karayan-Tapon L, et al. Comparative assessment of 5 methods (methylation-specific PCR, MethyLight, pyrosequencing, methylation-sensitive high-resolution melting, and immunohistochemistry) to analyze O6-methylguanine-DNA-methyltranferase in a series of 100 glioblastoma patients. Cancer. 2012;118(17):4201–4211. doi: 10.1002/cncr.27392. [DOI] [PubMed] [Google Scholar]
- 26.Koelsche C, Sahm F, Capper D, et al. Distribution of TERT promoter mutations in pediatric and adult tumors of the nervous system. Acta Neuropathol. 2013;126(6):907–915. doi: 10.1007/s00401-013-1195-5. [DOI] [PubMed] [Google Scholar]
- 27.Wiestler B, Capper D, Holland-Letz T, et al. ATRX loss refines the classification of anaplastic gliomas and identifies a subgroup of IDH mutant astrocytic tumors with better prognosis. Acta Neuropathol. 2013;126(3):443–451. doi: 10.1007/s00401-013-1156-z. [DOI] [PubMed] [Google Scholar]
- 28.Robin X, Turck N, Hainard A, et al. pROC: an open-source package for R and S+ to analyze and compare ROC curves. BMC Bioinformatics. 2011;1277:0–0. doi: 10.1186/1471-2105-12-77. [DOI] [PMC free article] [PubMed] [Google Scholar]
- 29.R Core Team. R: A language and environment for statistical computing. R Foundation for Statistical Computing. Vienna, Austria: 2013. ISBN 3-900051-07-0, URL http://www.R-project.org/ [Google Scholar]
- 30.Weller M, Wick W. Neuro-oncology in 2013: improving outcome in newly diagnosed malignant glioma. Nat Rev Neurol. 2014;10(2):68–70. doi: 10.1038/nrneurol.2013.268. [DOI] [PubMed] [Google Scholar]
- 31.Verhaak RGW, Hoadley KA, Purdom E, et al. Integrated genomic analysis identifies clinically relevant subtypes of glioblastoma characterized by abnormalities in PDGFRA, IDH1, EGFR, and NF1. Cancer Cell. 2010;17(1):98–110. doi: 10.1016/j.ccr.2009.12.020. [DOI] [PMC free article] [PubMed] [Google Scholar]
- 32.Frattini V, Trifonov V, Chan JM, et al. The integrated landscape of driver genomic alterations in glioblastoma. Nat Genet. 2013;45(10):1141–1149. doi: 10.1038/ng.2734. [DOI] [PMC free article] [PubMed] [Google Scholar]
- 33.Preusser M, Capper D, Hartmann C. IDH testing in diagnostic neuropathology: review and practical guideline article invited by the Euro-CNS research committee. Clin Neuropathol. 2011;30(5):217–230. doi: 10.5414/np300422. [DOI] [PubMed] [Google Scholar]
- 34.Horbinski C, Miller CR, Perry A. Gone FISHing: clinical lessons learned in brain tumor molecular diagnostics over the last decade. Brain Pathol. 2011;21(1):57–73. doi: 10.1111/j.1750-3639.2010.00453.x. [DOI] [PMC free article] [PubMed] [Google Scholar]
- 35.Natté R, van Eijk R, Eilers P, et al. Multiplex ligation-dependent probe amplification for the detection of 1p and 19q chromosomal loss in oligodendroglial tumors. Brain Pathol. 2005;15(3):192–197. doi: 10.1111/j.1750-3639.2005.tb00520.x. [DOI] [PMC free article] [PubMed] [Google Scholar]
- 36.Franco-Hernández C, Martínez-Glez V, de Campos JM, et al. Allelic status of 1p and 19q in oligodendrogliomas and glioblastomas: multiplex ligation-dependent probe amplification versus loss of heterozygosity. Cancer Genet Cytogenet. 2009;190(2):93–96. doi: 10.1016/j.cancergencyto.2008.09.017. [DOI] [PubMed] [Google Scholar]
- 37.Weller M, Stupp R, Reifenberger G, et al. MGMT promoter methylation in malignant gliomas: ready for personalized medicine? Nat. Rev Neurol. 2010;6(1):39–51. doi: 10.1038/nrneurol.2009.197. [DOI] [PubMed] [Google Scholar]
- 38.Killela PJ, Reitman ZJ, Jiao Y, et al. TERT promoter mutations occur frequently in gliomas and a subset of tumors derived from cells with low rates of self-renewal. Proc Natl Acad Sci USA. 2013;110(15):6021–6026. doi: 10.1073/pnas.1303607110. [DOI] [PMC free article] [PubMed] [Google Scholar]
- 39.Mulholland S, Pearson DM, Hamoudi RA, et al. MGMT CpG island is invariably methylated in adult astrocytic and oligodendroglial tumors with IDH1 or IDH2 mutations. Int J Cancer. 2012;131(5):1104–1113. doi: 10.1002/ijc.26499. [DOI] [PubMed] [Google Scholar]
- 40.Malley DS, Hamoudi RA, Kocialkowski S, et al. A distinct region of the MGMT CpG island critical for transcriptional regulation is preferentially methylated in glioblastoma cells and xenografts. Acta Neuropathol. 2011;121(5):651–661. doi: 10.1007/s00401-011-0803-5. [DOI] [PubMed] [Google Scholar]
Associated Data
This section collects any data citations, data availability statements, or supplementary materials included in this article.