Abstract
Background
It has been suggested that GastroPanel might be a useful tool for the diagnosis of chronic atrophic gastritis (CAG) measuring four biomarkers in blood: basal gastrin-17 (G17), pepsinogen I and II (PGI and PGII), and Helicobacter pylori antibodies.
Aim
To determine the accuracy of GastroPanel for the diagnosis of CAG.
Methods
This was a prospective, blinded, multicenter study that included dyspeptic patients. G17, PGI, and PGII were determined by enzyme immunoassays. Three antrum and two corpus biopsies were obtained for standard histological analysis and rapid urease test. Biopsies were analyzed by a single blinded expert pathologist.
Results
Ninety-one patients were included (77% women, mean age 44 years, 51% H. pylori positive, 17% with CAG). G17 was reduced in patients with antrum CAG (5.4 vs. 13.4 pmol/l; P<0.01) and increased in patients with corpus CAG (11 vs. 24 pmol/l; P<0.05), but its accuracy was only acceptable in the case of corpus localization [area under the receiver operating characteristic curve (AUC), 74%]; PGII difference was almost statistically significant only when testing for corpus atrophy (33 vs. 21 μg/l; P=0.05; AUC=72%). The PGI and PGI/PGII ratio showed no significant differences (AUCs were all unacceptably low). Helicobacter pylori antibody levels were higher in H. pylori-infected patients (251 vs. 109 EIU, P=0.01; AUC=70). The accuracy of GastroPanel for the diagnosis of CAG was as follows: sensitivity 50%; specificity 80%; positive 25% and negative 92% predictive values; and positive 2.4 and negative 0.6 likelihood ratios.
Conclusion
GastroPanel is not accurate enough for the diagnosis of CAG; thus, its systematic use in clinical practice cannot be recommended.
Keywords: antibodies, chronic atrophic gastritis, gastrin-17, Helicobacter pylori, pepsinogen I, pepsinogen II, serologic diagnosis
Introduction
Several studies have associated Helicobacter pylori infection with the development of gastric adenocarcinoma 1, especially in patients with chronic atrophic gastritis (CAG) 2. Patients with marked antral and corpus atrophy have an increased risk of developing gastric adenocarcinoma (relative risk=30) 3. On the basis of Correa’s hypothesis, CAG is the key step in the histopathological process leading to gastric malignancy.
The present method for the diagnosis of atrophy requires the extraction of biopsies from patients undergoing a gastroscopy 4,5. As this procedure is invasive, screening methods to avoid unnecessary gastroscopies are a priority for clinicians.
Gastric lesions, especially atrophy, alter the normal gastric secretion 4. Several serologic markers of gastric acid output have been developed with the aim of screening patients who really require gastroscopy 6–11. The loss of glandular cells in the gastric mucosa because of CAG induces significant functional changes in the stomach 4. Antral atrophy reduces the secretion of gastrin-17 (G17) whereas corpus atrophy decreases pepsinogen I (PGI) levels 5. Pepsinogen II (PGII) is synthesized in the glands throughout the entire stomach; therefore, it is mainly decreased in patients with multifocal atrophy 6,12–14. G17, PGI, and PGII are involved in gastric acid output. To compensate pH, G17 secretion is increased in patients with corpus atrophy and low PGI levels, and PGI is increased when antrum CAG reduces G17 levels 6.
It has been published previously that measurement of these serum markers can indirectly aid estimation of the histological condition of the gastric mucosa 6–11,14,15. More recently, Sipponen et al. 4 proposed the combined serological measurement of H. pylori antibodies (Hp-ab) and these serum markers for the diagnosis of moderate to severe CAG. Some studies have tested this serologic panel (GastroPanel) for the noninvasive diagnosis of CAG, and have obtained encouraging results 7–12.
GastroPanel’s algorithm for the diagnosis of CAG is based on the evaluation of the aforementioned biomarkers. The algorithm offers a final diagnosis and a risk assessment (Fig. 1). Therefore, GastroPanel has been proposed as a noninvasive diagnostic kit, and procedures or therapeutic decisions could be made based on its results. Especially relevant could be GastroPanel’s ability to identify those dyspeptic patients who truly require a gastroscopy, halving the number of these procedures 12.
Fig. 1.
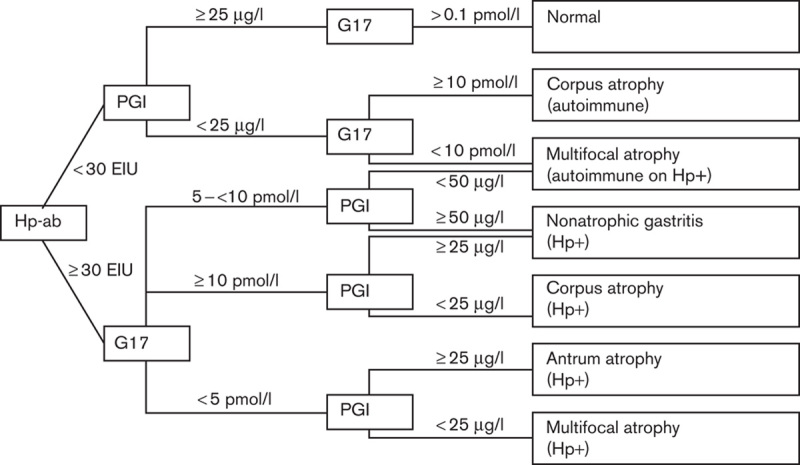
GastroPanel’s algorithm and cut-off points. G17, gastrin-17; Hp+, Helicobacter pylori positive; Hp-ab, Helicobacter pylori antibodies; PGI, pepsinogen I.
The systematic use of an accurate noninvasive method for the diagnosis of CAG would reduce the overall costs and incommodities to patients. As GastroPanel cannot detect concrete lesions in the mucosa such as gastric tumors, it should not be considered a substitute for gastroscopy, but as a tool to identify patients who do or do not require undergoing gastroscopy.
Finally, GastroPanel’s experience is limited, and some results do not support its usefulness 13–15; no study has been carried out in a Spanish population, and this method requires validation before being recommended for systematic use in clinical practice. Therefore, the aim of the present study was to evaluate the accuracy of GastroPanel for the diagnosis of CAG.
Methods
Patients
In this prospective, blinded, multicenter study, a total of 91 patients (76% women; mean age 45 years) who attended digestive services for upper gastrointestinal endoscopy were prospectively enrolled. Inclusion criteria were as follows: patients older than 18 years of age with dyspepsia. Exclusion criteria were as follows: presence of hepatic, renal, lung, endocrine, metabolic, hematological, or malignant diseases; previous H. pylori eradication treatment; history of alcohol or drug abuse; and pregnancy or nursing.
Proton pump inhibitor (PPI) treatment was not considered an exclusion criterion as in clinical practice most patients undergoing upper gastrointestinal endoscopy are taking these drugs before this procedure.
Biochemical tests
Serum levels of basal G17, PGI, PGII, and Hp-ab were measured by a chemiluminescent enzyme immunoassay using commercial kits (Biohit plc, Helsinki, Finland).
A 10 h fasting blood sample was obtained from all patients. Patients were not receiving antisecretory treatment (including PPIs) 2 weeks before the extraction. EDTA tubes were centrifuged at 2000 g for 15 min; 50 μl of G17 stabilizer was then added to plasma. Blood was stored at −20°C until the assay was performed.
Recommended cut-off points and algorithm for GastroPanel are presented in Fig. 1. All tests were performed in the centralized lab of Biohit-Deltaclon GastroPanel’s Lab in Spain.
Biopsies
Three antrum and two corpus biopsies were obtained. One antrum biopsy was used for the diagnosis of H. pylori infection with a rapid urease test. Standard histological analysis was carried out with the remaining biopsies. Biopsies were fixed in 10% formalin and separately embedded in paraffin blocks. The sections, serially cut and stained with hematoxylin and eosin, were examined by light microscopy for the histological assessment using the updated Sydney system by one single expert pathologist who was blinded to the results of the measurement of the serum markers.
As described in the updated Sydney system classification, the definition and grading of atrophy and the other histological variables was based on the definition and Visual Analog Scale provided by the Updated Sydney system original article. Atrophy is defined in the study as a loss of glandular tissue that causes a thinning or destruction of the glandular layer. The Visual Analog Scale has shown high interobserver agreement and was used to identify and classify the degree of atrophy from normal mucosa to severe atrophy.
H. pylori infection was considered positive when both the rapid urease test and histology were positive and negative if both were also negative. Other results were considered undetermined.
Ethical issues
This study was carried out with the approval and follow-up by the Hospitals’ Ethics Committees. The design and development followed the WMA Helsinki Declaration of 1964 and its revisions and all applicable regulations. All patients signed an informed consent.
Statistical analysis
Mean and SD were calculated for quantitative variables and percentage and 95% confidence interval (95% CI) were calculated for qualitative variables. Student t-test or Wilcoxon test was used to compare the mean of quantitative variables depending on the normality of the distribution. When the means of more than two groups were compared, a one-way analysis of variance was used, with the R2 and η2 to evaluate linearity. Percentages were compared using the χ2 test. Statistical significance was considered for P values lower than 0.05.
Receiver operating characteristic (ROC) curves were used to calculate the overall diagnostic performance of G17, PGI, PGII, and the PGI/PGII ratio for the diagnosis of CAG, and of Hp-ab for the diagnosis of H. pylori infection. If the area under the ROC curve (AUC) was acceptable (0.70), the best cut-off points were assessed, and then sensitivity analysis and likelihood ratios were also calculated. The accuracy of GastroPanels’ algorithm was assessed against histology (gold standard); sensitivity, specificity, and positive and negative predictive values were also calculated.
Sample size calculation was performed after reviewing previous experiences in all the participant hospitals, where the prevalence of CAG was 23%. For 20 patients with CAG, a sample size of 90 was calculated.
Results
Study population characteristics
Ninety-one patients were included in six hospitals all over Spain. Six patients could not be finally used in the study because of mishandling of samples. The reasons for endoscopic examination were as follows: dyspeptic symptoms in 59% of patients, anemia in 14%, pyrosis in 11%, vomiting in 4%, and endoscopic checkup in 4%. The remaining 8% were performed for other indications. The remaining data of 85 patients (77% women, average age 44±14 years, 34% smokers) were processed for the analysis. Five percent of the patients were under PPI treatment at endoscopy (none at blood extraction). Biopsy samples showed that 51% of patients were H. pylori positive and 17% had CAG (7% antral atrophy, 6% corpus atrophy, and 4% multifocal atrophy).
The levels of the different biomarkers depending on the histological diagnosis are shown in Table 1. The one-way analysis of variance test found significant differences in biomarkers levels on the basis of the localization of atrophy in G17 (P<0.01), PGI (P<0.05), and Hp-ab serology (P=0.01), although no linearity was found (R2 and η2 tests).
Table 1.
Levels of biomarkers depending on the histological diagnosis

Basal gastrin-17
The mean levels of G17 were significantly reduced in patients with CAG in the antrum (5 vs. 13 pmol/l; P<0.01, difference of the means 8 pmol/l, 95% CI=3.2–12.7 pmol/l) and increased in cases with corpus CAG (11 vs. 24 pmol/l; P=0.04, difference of the means 13 pmol/l, 95% CI=0.6–25 pmol/l). AUC for G17 for the diagnosis of antral (0.58), corpus (0.74), and any (0.62) CAG were calculated and only in the diagnosis of corpus atrophy the area was considered acceptable, although it was suboptimal (Fig. 2). Antral and any atrophy best cut-off points were not calculated because of the unacceptable AUCs. For the diagnosis of corpus atrophy, the best cut-off point (8.03 pmol/l) and its sensitivity, specificity, positive and negative predictive values, and positive and negative likelihood ratios were calculated, respectively: 75% (95% CI=66–84%), 70% (95% CI=60–80%), 21.4% (95% CI=12–30%), 96.2% (95% CI=92–100%), 2.5 (95% CI=1.5–4.2), and 0.4 (95% CI=0.1–1.2).
Fig. 2.
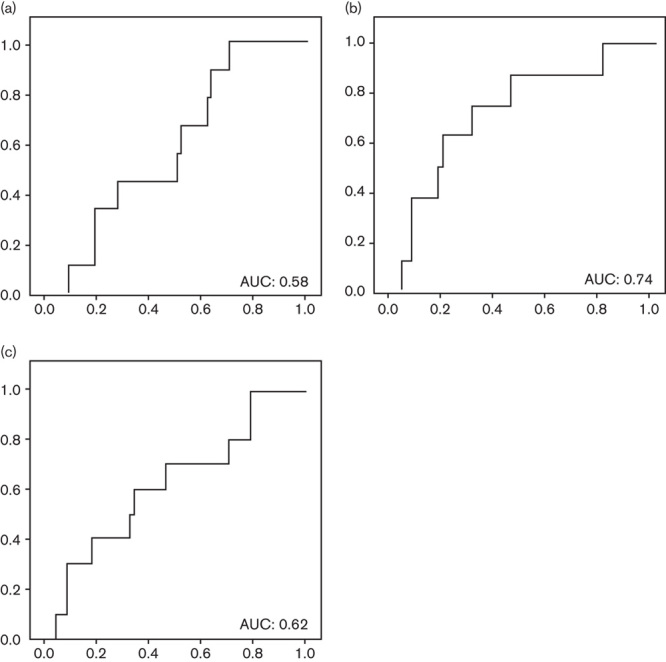
Gastrin-17: area under the ROC curve (AUC) for the diagnosis of (a) antral atrophy; (b) corpus atrophy; and (c) any atrophy. ROC, receiver operating characteristic.
Pepsinogen I
PGI differences between patients with or without corpus atrophy were not significant (112 vs. 117 μg/l), also when comparing patients with or without antral atrophy (91 vs. 120 μg/l). AUCs for the diagnosis of atrophy in each localization and in any localization were calculated, all being unacceptably low; AUCs for the diagnosis of antral, corpus, and any atrophy were 0.60, 0.51, and 0.60, respectively (Fig. 3). No cut-off point was calculated because of these poor results.
Fig. 3.
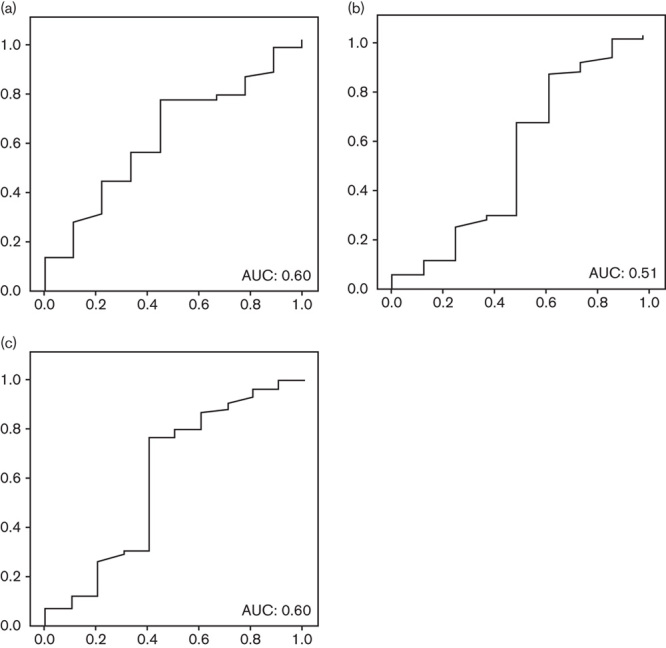
Pepsinogen I: area under the ROC curve (AUC) for the diagnosis of (a) antral atrophy; (b) corpus atrophy; and (c) any atrophy. ROC, receiver operating characteristic.
Pepsinogen II
PGII levels were not significantly different among groups on the basis of histological diagnosis. Only in the case of corpus atrophy was the difference almost statistically significant (33 μg/l in corpus atrophy patients vs. 21 μg/l in the rest; P=0.05, difference in the means 11.2 μg/l, 95% CI=22.4–0.1 μg/l). ROC curves were developed for the diagnosis of atrophy in antrum, corpus, multifocal, and any location. AUCs were, respectively, 0.54, 0.72, 0.54, and 0.65 (Fig. 4). The best cut-off point was studied for the diagnosis of corpus atrophy (21.2 μg/l): sensitivity 75% (95% CI=65–84%), specificity 69% (95% CI=58–79%), positive 20.7% (95% CI=12–30%) and negative 96.2% (95% CI=92–100%) predictive values, and positive 2.4 (95% CI=1.4–4.0) and negative 0.4 (95% CI=0.1–1.22%) likelihood ratios.
Fig. 4.
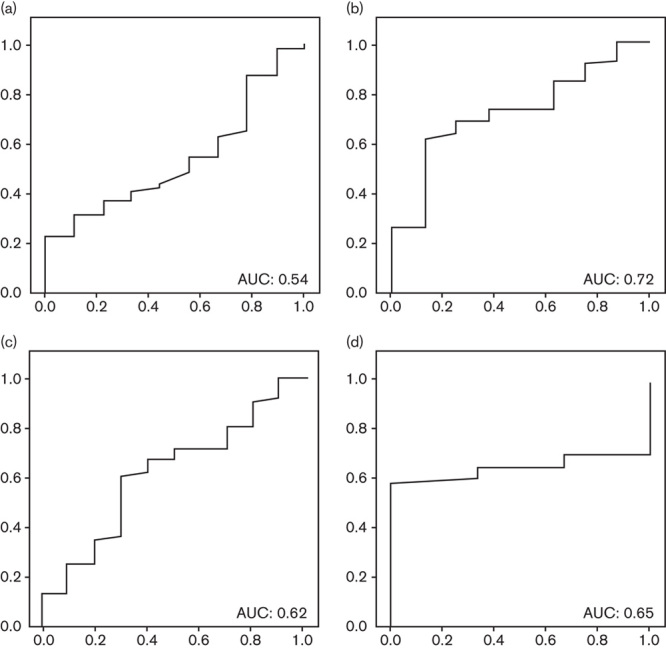
Pepsinogen II: area under the ROC curve (AUC) for the diagnosis of (a) antral atrophy; (b) corpus atrophy; (c) any atrophy; and (d) multifocal atrophy. ROC, receiver operating characteristic.
Pepsinogen I and II ratio
No statistically significant differences were found for any subanalysis on the basis of the localization of the atrophy. AUCs for the diagnosis of atrophy showed unacceptable values in all cases: antrum (0.56), corpus (0.61), and any localization (0.66) as shown in Fig. 5.
Fig. 5.
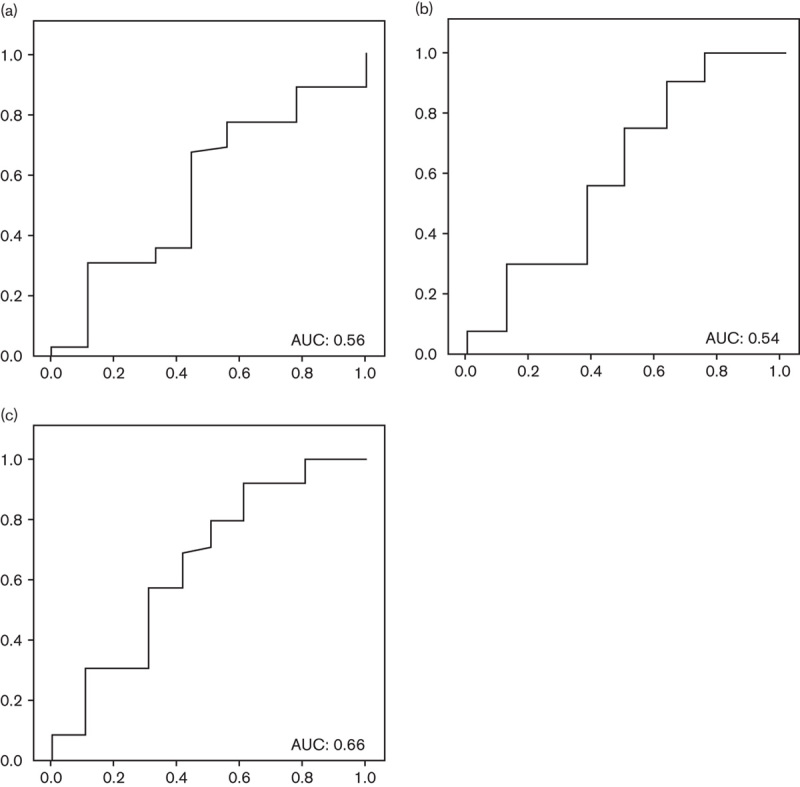
Pepsinogens I/II: area under the ROC curve (AUC) for the diagnosis of (a) antral atrophy; (b) corpus atrophy; and (c) any atrophy. ROC, receiver operating characteristic.
Helicobacter pylori antibodies
Hp-ab were tested for the diagnosis of H. pylori infection. The mean levels were significantly different between infected and noninfected patients (251 vs. 109 EIU, P=0.01, difference in the means 143 EIU 95% CI=35–251 EIU). AUC for the diagnosis of infection was 0.70. The best cut-off point was 63 EIU. The accuracy of this cut-off point was as follows: sensitivity 76% (95% CI=66–84%), specificity 71% (95% CI=61–81%), positive 86% (95% CI=78–94%) and negative 55% (95% CI=44–66%) predictive values, and positive 2.6 (95% CI=1.4–4.9) and negative 0.4 (95% CI=0.2–0.58%) likelihood ratios.
GastroPanel
GastroPanel’s diagnosis was compared with histology (Table 2). The accuracy of GastroPanel for the diagnosis of CAG was as follows: sensitivity 50% (95% CI=39–61%), specificity 80% (95% CI=71–88%), positive 25% (95% CI=16–34%) and negative 92% (95% CI=86–98%) predictive values, and positive 2.4 (95% CI=1.1–5.2) and negative 0.6 (95% CI=0.3–1.18%) likelihood ratios. Subanalysis stratification by localization of atrophy was performed, but the results showed no improvement (data not shown).
Table 2.
GastroPanel versus histology contingency table

Discussion
GastroPanel has previously been suggested as a promising noninvasive method for the diagnosis of gastric atrophy, with the ability to diagnose and localize different degrees of atrophy 6,14. Although, theoretically, GastroPanel could be a useful method to reduce unnecessary gastroscopies, the results of the present study are discouraging 6.
The present study analyzed the quantitative measurements of each biomarker and carried out qualitative evaluation using the commercial GastroPanel software for the diagnosis of CAG. The levels of G17 were, as indicated in the previous literature, reduced in patients diagnosed with antral atrophy and increased in patients with corpus atrophy. This increase in secretion is produced to compensate for the reduction in acid secretion in the antrum 6. Even though it is assumed that the diagnostic accuracy of G17 would be best for the diagnosis of antral atrophy 11, we could only find very limited utility of G17 for the diagnosis of corpus atrophy in the population studied. The measurement of G17 for the diagnosis of antral atrophy had an unacceptably low accuracy.
Contrary to expectation 6,10,11,13–17, no significant differences were found between patients with or without CAG in PGI levels, irrespective of whether the atrophy was in the antrum, the corpus, or both. Previously published data suggest that PGI is slightly increased in cases of antral atrophy as a means to regulate and compensate stomach acidity 6. Therefore, it is especially surprising that the levels of PGI are decreased in the patients in our study with only antral atrophy. In this scenario, the use of PGI as a marker of gastric atrophy showed no real utility.
PGII is secreted throughout the entire stomach and therefore it is considered to be a good marker of multifocal CAG 4,10,18 and of corpus atrophy when combined with PGI in the PGI/PGII ratio 4–6. In the population studied, PGII was increased in patients with corpus atrophy, even though the previous literature described a reduction in PGII levels in any atrophy, especially in patients with multifocal atrophy. In any case, as the accuracy of PGII for the diagnosis of atrophy was only acceptable for corpus localization and still suboptimal, its use as a marker of atrophy cannot be recommended even if it may be indicative for corpus atrophy. The PGI/PGII ratio is used to diagnose corpus atrophy in the GastroPanel software, but no diagnostic accuracy was found in the population studied.
Finally, the usefulness of the serological determination of Hp-ab for the diagnosis of H. pylori infection has been questioned previously in the literature 13,14,16. The accuracy of this marker is suboptimal mainly because of the high range of interpatient variability in its levels. Our results confirm that Hp-ab levels can be indicative of pre-existing exposure to the bacteria, but, in agreement with most clinical guidelines, should not be the method of choice for the diagnosis of current infection 16,17.
The main limitation of the present study is the final low prevalence of atrophies found in the population studied, which increases the CIs of our results. To avoid misinterpretation of these results, CIs of sensibility and specificity must be taken into consideration. It can be argued that the population studied is not the best candidate for GastroPanel as it is not the age range for gastric cancer screening; however, the self-declared utility of GastroPanel is not only to identify cases at high risk of gastric cancer but to allow a noninvasive diagnosis of gastric mucosal lesions (risk assessment), ranging from nonatrophic gastritis to gastric cancer. The suboptimal accuracy of GastroPanel (and the individual biomarkers) may be negatively affected by some other variables, but these unknown altering variables (such as a possible spotty gastritis with ‘normal function’) arise from real clinical practice experience and therefore similar negative variables may occur if GastroPanel is systematically used in clinical practice.
In summary, it could be concluded that the biomarkers used by GastroPanel do not have, individually, enough accuracy for use in the diagnosis of atrophy in the population studied. GastroPanel software uses an algorithm based on the combination of the cut-off points of all markers. The comparison of its results with the gold standard in the population studied showed very limited accuracy, failing to diagnose half of the atrophies (sensitivity=50%). According to these data, the use of the algorithm and cut-off points as established in the commercial GastroPanel software cannot be recommended for clinical practice. Better cut-off points and a modified algorithm could be developed for this specific population, but the low diagnostic accuracy of each of the markers will probably not lead to improvement in the results of GastroPanels to meet the requirements of everyday clinical practice. These results suggest that the serological approach may not be the best method to screen for gastric atrophy. The search for and development of accurate noninvasive methods for the diagnosis of gastric lesions such as atrophic gastritis are still an unresolved priority.
Acknowledgements
CIBERehd is funded by the Instituto de Salud Carlos III.
This study was funded by funds of the research team. Biohit covered the courier services of samples and the laboratory analysis.
Conflicts of interest
There are no conflicts of interest.
References
- 1.No authors listed.Schistosomes, liver flukes and Helicobacter pylori. IARC Working Group on the Evaluation of Carcinogenic Risks to Humans. Lyon, 7–14 June 1994. IARC Monogr Eval Carcinog Risks Hum 1994; 61:1–241. [PMC free article] [PubMed] [Google Scholar]
- 2.El-Zimaity H. Gastritis and gastric atrophy. Curr Opin Gastroenterol 2008; 24:682–686. [DOI] [PubMed] [Google Scholar]
- 3.Correa P. Human gastric carcinogenesis: a multistep and multifactorial process – First American Cancer Society Award Lecture on Cancer Epidemiology and Prevention. Cancer Res 1992; 52:6735–6740. [PubMed] [Google Scholar]
- 4.Sipponen P, Harkonen M, Alanko A, Suovaniemi O. Diagnosis of atrophic gastritis from a serum sample. Clin Lab 2002; 48:505–515. [PubMed] [Google Scholar]
- 5.Sipponen P, Ranta P, Helske T, Kääriainen I, Mäki T, Linnala A, et al. Serum levels of amidated gastrin-17 and pepsinogen I in atrophic gastritis: an observational case-control study. Scand J Gastroenterol 2002; 37:785–791. [PubMed] [Google Scholar]
- 6.Sipponen P, Graham DY. Importance of atrophic gastritis in diagnostics and prevention of gastric cancer: application of plasma biomarkers. Scand J Gastroenterol 2007; 42:2–10. [DOI] [PubMed] [Google Scholar]
- 7.Di Mario F, Moussa AM, Caruana P, Merli R, Cavallaro LG, Cavestro GM, et al. ‘Serological biopsy’ in first-degree relatives of patients with gastric cancer affected by Helicobacter pylori infection. Scand J Gastroenterol 2003; 38:1223–1227. [DOI] [PubMed] [Google Scholar]
- 8.Germaná B, Di Mario F, Cavallaro LG, Moussa AM, Lecis P, Liatoupolou S, et al. Clinical usefulness of serum pepsinogens I and II, gastrin-17 and anti-Helicobacter pylori antibodies in the management of dyspeptic patients in primary care. Dig Liver Dis 2005; 37:501–508. [DOI] [PubMed] [Google Scholar]
- 9.Graham DY, Nurgalieva ZZ, El-Zimaity HM, Opekun AR, Campos A, Guerrero L, et al. Noninvasive versus histologic detection of gastric atrophy in a Hispanic population in North America. Clin Gastroenterol Hepatol 2006; 4:306–314. [DOI] [PubMed] [Google Scholar]
- 10.Hartleb M, Wandzel P, Waluga M, Matyszczyk B, Bołdys H, Romañczyk T. Non-endoscopic diagnosis of multifocal atrophic gastritis; efficacy of serum gastrin-17, pepsinogens and Helicobacter pylori antibodies. Acta Gastroenterol Belg 2004; 67:320–326. [PubMed] [Google Scholar]
- 11.Nardone G, Rocco A, Staibano S, Mezza E, Autiero G, Compare D, et al. Diagnostic accuracy of the serum profile of gastric mucosa in relation to histological and morphometric diagnosis of atrophy. Aliment Pharmacol Ther 2005; 22:1139–1146. [DOI] [PubMed] [Google Scholar]
- 12.Vaananen H, Vauhkonen M, Helske T, Kaariainen I, Rasmussen M, Tunturi-Hihnala H, et al. Non-endoscopic diagnosis of atrophic gastritis with a blood test. Correlation between gastric histology and serum levels of gastrin-17 and pepsinogen I: a multicentre study. Eur J Gastroenterol Hepatol 2003; 15:885–891. [DOI] [PubMed] [Google Scholar]
- 13.Masci E, Pellicano R, Mangiavillano B, Luigiano C, Stelitano L, Morace C, et al. GastroPanel® test for non-invasive diagnosis of atrophic gastritis in patients with dyspepsia. Minerva Gastroenterol Dietol 2014; 60:79–83. [PubMed] [Google Scholar]
- 14.Peitz U, Wex T, Vieth M, Stolte M, Willich S, Labenz J, et al. Correlation of serum pepsinogens and gastrin-17 with atrophic gastritis in gastroesophageal reflux patients: a matched-pairs study. J Gastroenterol Hepatol 2011; 26:82–89. [DOI] [PubMed] [Google Scholar]
- 15.Koivusalo AI, Pakarinen MP, Kolho KL. Is GastroPanel serum assay useful in the diagnosis of Helicobacter pylori infection and associated gastritis in children?Diagn Microbiol Infect Dis 2007; 57:35–38. [DOI] [PubMed] [Google Scholar]
- 16.Gisbert JP, Calvet X, Bermejo F, Boixeda D, Bory F, Bujanda L, et al. [III Spanish Consensus Conference on Helicobacter pylori infection]. Gastroenterol Hepatol 2013; 36:340–374. [DOI] [PubMed] [Google Scholar]
- 17.Malfertheiner P, Megraud F, O’Morain CA, Atherton J, Axon AT, Bazzoli F, et al. Management of Helicobacter pylori infection – the Maastricht IV/Florence Consensus Report. Gut 2012; 61:646–664. [DOI] [PubMed] [Google Scholar]
- 18.Miki K, Ichinose M, Shimizu A, Huang SC, Oka H, Furihata C, et al. Serum pepsinogens as a screening test of extensive chronic gastritis. Gastroenterol Jpn 1987; 22:133–141. [DOI] [PubMed] [Google Scholar]


