

Abstract
Down syndrome (DS) is the most prevalent cause of intellectual disability (ID). Individuals with DS show a variety of cognitive deficits, most notably in hippocampal learning and memory, and display pathological hallmarks of Alzheimer's disease (AD), with neurodegeneration of cholinergic basal forebrain (CBF) neurons. Elucidation of the molecular and cellular underpinnings of neuropathology has been assessed via gene expression analysis in a relevant animal model, termed the Ts65Dn mouse. The Ts65Dn mouse is a segmental trisomy model of DS which mimics DS/AD pathology, notably age-related cognitive dysfunction and degeneration of basal forebrain cholinergic neurons (BFCNs). To determine expression level changes, molecular fingerprinting of Cornu Ammonis 1 (CA1) pyramidal neurons was performed in adult (4-9 month old) Ts65Dn mice, at the initiation of BFCN degeneration. To quantitate transcriptomic changes during this early time period, laser capture microdissection (LCM), terminal continuation (TC) RNA amplification, custom-designed microarray analysis, and subsequent validation of individual transcripts by qPCR and protein analysis via immunoblotting was performed. Results indicate significant alterations within CA1 pyramidal neurons of Ts65Dn mice compared to normal disomic (2N) littermates, notably in the downregulation of neurotrophins and their cognate neurotrophin receptors among other classes of transcripts relevant to neurodegeneration. These results of this single population gene expression analysis at the time of septohippocampal deficits in a trisomic mouse model shed light on a vulnerable circuit that may cause the AD-like pathology invariably seen in DS that could help to identify mechanisms of degeneration, and provide novel gene targets for therapeutic interventions.
Keywords: Alzheimer's disease, BDNF, Down syndrome, hippocampus, laser capture microdissection, microarray, qPCR, TrkB, TrkC, RRID:AB_2314574, AB_397508, AB_2154265, AB_630940, AB_477580, AB_477262, RRID:IMSR_JAX:001924
Introduction
Down syndrome (DS) is caused by the triplication of human chromosome 21 (HSA21) and is the most common genetic cause of intellectual disability (ID). The prevalence of this disorder is increasing (Jacobs and Hassold 1995; Parker et al. 2010) and currently there is no effective therapies or cure for this disorder. Deficits seen in these individuals are not limited to developmental abnormalities and include decreased cognitive function, notably in hippocampal learning, memory, language, and communication skills (Chapman and Hesketh 2000; Esbensen 2010). Triplication of HSA21 also engenders Alzheimer's disease (AD) pathology and dementia in patients starting around the third decade of life (Wisniewski et al. 1985; Leverenz and Raskind 1998). This pathology includes amyloid plaques, neurofibrillary tangles (NFTs), degeneration of cholinergic basal forebrain (CBF) neurons, and early endosomal abnormalities (Wisniewski et al. 1985; Mann et al. 1986; Leverenz and Raskind 1998; Cataldo et al. 2000; Nixon and Cataldo 2006). The lifelong deficits caused by DS are thought to be caused by the triplication of a portion of the >550 genes encoded on the HSA21 chromosome (Sturgeon and Gardiner 2011) termed the DS critical region.
While there have been many mouse models designed to mimic DS and AD neuropathology (Das and Reeves 2011; Rueda et al. 2012), currently the most widely utilized to investigate AD-like pathology is the Ts65Dn mouse. Ts65Dn mice were engineered to translocate a segment of mouse chromosome 16 (MMU16) and mouse chromosome 17 (MMU17) orthologous to HSA21, to the centromeric end of MMU17 (Davisson and Schmidt 1993; Reeves et al. 1995; Holtzman et al. 1996; Akeson and Lambert 2001; Chen et al. 2008). This translocation includes the genomic information of over 250 genes and putative gene products, with ~88 protein coding gene sequences that show a conservation of at least 70% homology from MMU16 to HSA21 (Gardiner et al. 2003; Sturgeon and Gardiner 2011). This region incorporates genes proximal to App extending to Mx and exhibits ~55% conservation of the protein coding genes estimated from HSA21 (Davisson and Schmidt 1993; Reeves et al. 1995; Gardiner et al. 2003; Sturgeon and Gardiner 2011). Importantly, these mice have been shown to mimic aspects of the phenotype of human DS, survive into adulthood and the females are not sterile (the males are subfertile; Levine et al. 2009). Behavioral studies on Ts65Dn mice have demonstrated learning and memory deficits on a myriad of cognitive and associative memory tasks (Escorihuela et al. 1995; Reeves et al. 1995; Holtzman et al. 1996; Hyde and Crnic 2001). Ts65Dn mice also exhibit hyperactivity, and disruption in neurotransmitter levels (Reeves et al. 1995; Cooper and Salehi 2001; Hunter et al. 2003). Moreover, morphological studies have shown degeneration of basal forebrain cholinergic neurons (BFCNs), hippocampal and cerebellar volume reduction, reduced hippocampal neurogenesis, synapse loss, and deficits in synaptic plasticity (Holtzman et al. 1996; Insausti et al. 1998; Kurt et al. 2000; Granholm et al. 2003; Saran et al. 2003; Belichenko et al. 2004, 2009; Velazquez et al. 2013; Kelley et al. 2014a, 2014b).
Similar to human DS and AD, Ts65Dn mice have profound septohippocampal circuit degeneration, notably BFCNs and hippocampal CA1 pyramidal neurons (Holtzman et al. 1996; Cataldo et al. 2000; Granholm et al. 2000; Seo and Isacson 2005; Kelley et al. 2014a). Estimates on the initiation of BFCN degeneration in Ts65Dn mice range from approximately 6-10 months of age, with most researchers showing by 10-12 months of age abnormal choline acetyltransferase (ChAT) levels and frank BFCN neurodegeneration, including loss of phenotypic markers ChAT, pan-neurotrophin receptor p75NTR, and nerve growth factor (NGF) receptor TrkA (Holtzman et al. 1996; Granholm et al., 2000, 2003; Cooper et al., 2001; Seo and Isacson 2005; Contestabile et al., 2006). Our collaborative group has recently reported that BFCN degeneration in Ts65Dn mice varies by basal forebrain region (e.g., medial septal nucleus/vertical limb of the diagonal band area appears overall more vulnerable as compared to the nucleus basalis/substantia innominata and horizontal limb of the diagonal band areas, although there are notable exceptions and sex differences (Ash et al., 2014; Kelley et al. 2014a, 2014b).
Recently, our group has shown multiple gene expression changes within CA1 pyramidal neurons in older adult Ts65Dn, including significant downregulation of select neurotrophin and neurotrophin receptor genes (Alldred et al., 2014). Alterations in neurotrophins and their cognate neurotrophin receptor in Ts65Dn mice mimics alterations in AD and DS. Dysregulation of neurotrophin signaling likely affects pro-survival pathways to decrease cell survival and maintenance of neuronal pathways in the forebrain, specifically the septohippocampal circuit (Mufson et al. 2003, 2007; Ginsberg et al. 2006, 2010a; Counts et al. 2011).
To further understand the progression of gene expression level changes in vulnerable CA1 pyramidal cells, we performed laser capture microdissection (LCM), terminal continuation (TC) RNA amplification, and subsequent custom-designed microarray analysis (Ginsberg et al. 2010a, 2012; Alldred et al. 2012) on 4-9 month old Ts65Dn mice compared to normal disomic (2N) littermates. The array platform allows us to directly compare multiple classes of transcripts relevant to AD pathology, DS, and neurodegeneration simultaneously (Ginsberg et al. 2006, 2010a; Alldred et al. 2008, 2009, 2012). To validate the gene expression changes seen by microarray, we utilized real-time quantitative PCR (qPCR) and immunoblot assay for selected targets that were differentially expressed in the Ts65Dn mice compared to 2N littermates.
Materials and Methods
Tissue preparation
Animal protocols were approved by the Institutional Animal Care and Use Committee (IACUC) of the Nathan Kline Institute/NYU Langone Medical Center and were in full accordance with NIH guidelines. A cohort of mixed sex, age-matched mice {Ts65Dn (n = 9) and 2N disomic littermates (n = 7); RRID:IMSR_JAX:001924} 4-9 months of age were given an overdose of ketamine and xylazine and perfused transcardially with ice-cold 0.15 M phosphate buffer, brains were removed and hemi-dissected, with one hemibrain drop-fixed for 24 hours (h) in 4% paraformaldehyde buffered in 0.15 M phosphate buffer at 4 °C. The other hemibrain was microdissected for the CA1 region of the hippocampus and flash-frozen in dry ice for RNA extraction for qPCR validation studies. Paraformaldehyde fixed tissue was paraffin embedded, and 6 μ-thick tissue sections were cut in the coronal plane on a rotary microtome for immunocytochemistry (Ginsberg 2005a; Ginsberg et al. 2010a; Alldred et al. 2012). Briefly, deparaffinized tissue sections were blocked in a 0.1 M Tris (pH 7.6) solution containing 2% donor horse serum (DHS; Sigma, St. Louis, MO) and 0.01% Triton X-100 for 1 h and then incubated with a primary antibody directed against nonphosphorylated neurofilament (NF) proteins (RMdO20) (Lee et al. 1987) in a 0.1 M Tris/2% DHS solution overnight at 4 °C in a humidified chamber. Sections were processed with the ABC kit (Vector Labs, Burlingame, CA) and developed with 0.05% diaminobenzidine (Sigma), 0.03% hydrogen peroxide, and 0.01 M imidazole in Tris buffer for 10 minutes (min) (Ginsberg 2005a; Ginsberg et al. 2010b; Alldred et al. 2008, 2012, 2014). Tissue sections were not coverslipped or counterstained and maintained in RNase-free 0.1 M Tris for LCM. RNase-free precautions were employed, and solutions were made with 18.2 mega Ohm RNase-free water (Nanopure Diamond, Barnstead, Dubuque, IA). A second cohort of mixed sex, age-matched mice (Ts65Dn n=9; 2N n=9) aged 4-6 months were cervically dislocated and brains were utilized for regional hippocampal dissections for qPCR validation and immunoblot assays.
Single cell microaspiration and TC RNA amplification
LCM and TC RNA amplification procedures have been described in detail previously by our group (Che and Ginsberg 2004; Alldred et al. 2008, 2009, 2012, 2014; Ginsberg et al. 2010a, 2010b). Individual NF-immunoreactive CA1 pyramidal neurons were microaspirated via LCM (Arcturus PixCell IIe, Life Technologies, Carlsbad, CA). Fifty cells were captured per reaction for population cell analysis (Alldred et al. 2008, 2014; Ginsberg et al. 2010a, 2010b) and three microarrays were performed per mouse brain (50 CA1 neurons per microarray). The full TC RNA amplification protocol is available at http://cdr.rfmh.org/pages/ginsberglabpage.html (Alldred et al., 2014). Briefly, this method entails synthesizing first strand cDNA complementary to the RNA template, re-annealing the primers to the cDNA, and finally in vitro transcription using the synthesized cDNA as a template. First, microaspirated CA1 neurons were homogenized in Trizol reagent (Life Technologies), chloroform extracted, and the RNA precipitated and resuspended in RNase-free H2O (Alldred et al. 2009, 2012). RNAs were reverse transcribed and single-stranded cDNAs were then subjected to RNase H digestion and re- annealing of the primers to generate cDNAs with double-stranded regions at the primer interfaces and samples were purified by Vivaspin 500 columns (Sartorius Stedim Biotech, Goettingen, Germany). Hybridization probes were synthesized by in vitro transcription using 33P and radiolabeled TC RNA probes were hybridized to custom-designed cDNA arrays without further purification.
Microarray platforms and hybridization
Array platforms consist of 1 μ of linearized cDNA purified from plasmid preparations adhered to high-density nitrocellulose (Hybond XL, GE Healthcare, Piscataway, NJ) using an arrayer robot (VersArray, Bio-Rad, Hercules, CA) (Ginsberg 2005b, 2008). Each cDNA and/or expressed sequence-tagged cDNA (EST) was verified by sequence analysis. Mouse and human clones were employed on the custom-designed array. Approximately 576 cDNAs/ESTs were utilized on the current array platform, organized into 19 gene ontology groups (Table I). Of the ~88 protein coding genes on HSA21 triplicated in DS that are also trisomic in the Ts65Dn mouse model, APP, CBR1, GRIK1, NCAM1, SOD1, and SYNJ1 are represented on the current array platform. The majority of genes are represented by one transcript on the custom-designed array platform, although the neurotrophin receptors TrkA, TrkB, and TrkC are represented by ESTs that contain the extracellular domain (ECD) as well as the tyrosine kinase domain (TK) (Ginsberg and Mirnics 2006; Ginsberg et al. 2010a). Array hybridization is performed as previously described (Alldred et al., 2014).
Table I.
Classes of transcripts with total number of genes represented for each category on the custom-designed microarray platform.
| Gene Category | genes | Gene Category | genes |
|---|---|---|---|
| AD-related genes | 34 | GluRs, transporters, & interacting | 37 |
| Calcium, potassium, & sodium channels | 25 | Immediate early genes | 11 |
| Catecholamine synthesis, receptors, & transporters (MONO) | 45 | Neuropeptides | 18 |
| Cell death-related genes | 32 | Neurotrophins & neurotrophin receptors | 14 |
| Cytoskeletal elements | 29 | Protease-related markers | 34 |
| Development-related markers | 22 | Protein phosphatases & kinases | 46 |
| Endosomal, autophagy, lysosomal system (EALS) | 51 | Steroid synthesis & receptors | 25 |
| GABA synthesis, receptors, & transporters | 20 | Synaptic-related markers | 32 |
| G-proteins and associated proteins | 33 | Transcription factors & regulators | 25 |
| Glial-associated markers | 17 | Others | 14 |
| Glucose utilization | 12 | TOTAL | 576 |
Statistical procedures for custom-designed microarray analysis have been described in detail previously (Ginsberg and Mirnics 2006; Ginsberg 2007, 2009; Alldred et al., 2014). The two mouse genotypes were compared with respect to the hybridization signal intensity ratio of 576 genes. For each gene, the signal intensity ratio was modeled as a function of mouse genotype, using mixed effects models with random mouse effect to account for the correlation between repeated assays on the same mouse (McCulloch et al. 2008). Significance was judged at the level (α=0.01), two-sided. A false discovery rate (FDR) based on an empirical null distribution due to strong correlation between genes (Benjamini and Hochberg 1995; Efron 2007) was controlled at level 0.05 and 0.1. Expression levels were graphed using a bioinformatics software package (GeneLinker Gold, Predictive Patterns, Kingston, ON).
qPCR
qPCR was performed on microdissected CA1 sections with RNA extracted and reverse- transcribed using a polyT primer from CA1 microdissected tissue (Alldred et al. 2008, 2012, 2014; Ginsberg 2008) from 4-9 month old Ts65Dn and 2N mice (n = 9 per genotype). Taqman qPCR primers (Life Technologies) were utilized for qPCR, TrkB (Mm01341760_m1; targeting the exon 16-17 boundary), TrkC (Mm01317842_m1; targeting the exon 12-13 boundary), NTF3 (Mm00435413_s1; targeting exon 3), BDNF (Mm04230607_s1; targeting exon 8) and the housekeeping gene succinate dehydrogenase complex, subunit A, flavoprotein (SDHA; Mm01352360_m1; targeting the exon 14-15 boundary). Samples were assayed on a real-time qPCR cycler (7900HT, Life Technologies) in 96-well optical plates with coverfilm as described previously (Ginsberg et al. 2006, 2010a; Alldred et al. 2008, 2012, 2014; Jiang et al. 2010). Standard curves and cycle threshold (Ct) were generated using standards obtained from total mouse brain RNA. The ddCT method was employed to determine relative gene level differences between Ts65Dn and 2N mice with SDHA qPCR products used as a control (Alldred et al. 2008; Applied Biosystems 2008; Jiang et al. 2010; Ginsberg et al. 2010a). Negative controls for gene assays consisted of the reaction mixture without input RNA. To test for differences between the genotypes, for each gene, the PCR product synthesis was modeled as a function of mouse genotype, using mixed effects models with random mouse effect to account for the correlation between repeated assays on the same mouse (McCulloch et al. 2008). Significance was judged at the level (α=0.05), two-sided.
Immunoblot analysis
Frozen microdissected hippocampal tissue samples obtained from Ts65Dn and 2N mice aged 4-6 months (Ts65Dn, n=8; 2N, n=8) were homogenized in a 20 mM Tris-HCl (pH 7.4) buffer containing 10% (w/v) sucrose, 1 mM ethylenediaminetetraacetic acid (EDTA), 5 mM ethylene glycol-bis (ß-aminoethylether)-N,N,N',N'-tetra-acetic acid (EGTA), 2 mg/ml of the following: (aprotinin, leupeptin, and chymostatin), 1 mg/ml of the following: {pepstatin A, antipain, benzamidine, and phenylmethylsulfonyl fluoride (PMSF)}, 100 μ/ml of the following: {soybean trypsin inhibitor, Na-p-tosyl-L-lysine chloromethyl ketone (TLCK), and N-tosyl-L- phenylalanine chloromethyl ketone (TPCK)}, 1 mM of the following: (sodium fluoride and sodium orthovanadate) and centrifuged as described previously (Counts et al. 2004; Ginsberg et al. 2012; Alldred et al. 2014). All protease inhibitors were purchased from Sigma. Identical amounts of homogenates (10 μ) were loaded into a gel electrophoresis apparatus, subjected to sodium dodecyl sulfate-polyacrylamide gel electrophoresis (SDS-PAGE; 4-15% gradient acrylamide gels; Bio-Rad, Hercules, CA), and transferred to nitrocellulose by electroblotting (Mini Transblot, Bio-Rad). Nitrocellulose membranes were blocked in blocking buffer (LiCor, Lincoln, NE) for 1 h at 4 °C prior to being incubated with primary antibodies directed against GRIA1 (06-306; Millipore), GRIA2/3 (06-307; Millipore), TrkB (610102; BD Transduction Laboratory), TrkC (3376S; Cell Signalling), NTF3 (PA514861; Thermo Scientific), BDNF (SC-546; Santa Cruz), or ß-tubulin (TUBB; T-5293; Sigma). Immunoblots were quantified by densitometric software supplied with the instrument. Signal intensity of immunoreactive bands was normalized to TUBB immunoreactivity for each assay as described previously (Ginsberg 2010; Ginsberg et al. 2012; Alldred et al. 2012).
Each protein measure was modeled as a function of mouse genotype, using mixed effects models with random mouse effect to account for the correlation between repeated assays on the same mouse (McCulloch et al. 2008). All inferences were based on models with only main effects for genotype, age and sex, by modeling the outcome (gene expression of proteins) as a function of mouse genotype controlling for sex and age (Alldred et al., 2014).
Antibody Characterization
To label CA1 pyramidal neurons via immunocytochemistry in paraffin-embedded tissue sections, we employed RMdO20 (RRID:AB_477262), which recognizes nonphosphorylated NF-medium/NF-high proteins (Lee et al. 1987), and has been used in previous LCM-based experiments in mouse and human brains in our laboratory (Ginsberg 2010; Alldred et al. 2012, 2014). Controls for these experiments included omission of primary and secondary antibodies in parallel studies of adjacent paraffin-embedded tissue sections (Ginsberg et al. 2000; Ginsberg 2010; Alldred et al. 2012).
The primary antibodies employed for the immunoblot studies were purchased from commercial sources and used previously by our laboratory group (Ginsberg 2010; Ginsberg et al. 2012; Alldred et al. 2012). Each antibody has been characterized extensively previously (Table II), which contains specificity, antibody concentration and JCN registry information (JCN Antibody Database v. 14). The α-amino-3-hydroxy-5-methyl-4-isoxazolepropionic acid (AMPA) receptor GRIA1 antibody (06-306) recognizes a single ~105 kiloDalton (kDa) band on Western blots of mouse hippocampal brain homogenates. The GluR2/3 antibody recognizes a shared epitope of GRIA2 and GRIA3 and recognizes a single band at ~110 kDa on Western blots of hippocampal mouse brain homogenates (RRID:AB_2314574). The neurotrophin-3 (NTF3) antibody recognizes a single band at ~29 kDa on Western blots of mouse hippocampal brain homogenates (RRID:AB_2154265). The BDNF antibody (RRID:AB_630940) recognizes both the pro-BDNF (~30 kDa) and mature BDNF (~15 kDa) isoforms in mouse brain homogenates (RRID:AB_630940). The neurotrophin receptor antibodies (TrkB and TrkC) recognize both full-length (FL) and truncated (T1) isoforms. The TrkB antibody recognizes a ~145 kDa band corresponding to TrkB-FL and a ~95 kDa band corresponding to TrkB-T1 in mouse hippocampal brain homogenates (RRID:AB_397508). The TrkC antibody recognizes a ~135 kDa band corresponding to TrkC-FL and a ~95 kDa band corresponding to TrkC-T1 in mouse hippocampal brain homogenates (RRID:AB_2155283). The TUBB antibody recognizes a single ~50 kDa band on Western blots of hippocampal mouse brain homogenates (RRID:AB_477580). Negative controls include omission of primary and secondary antibodies as described previously (Ginsberg 2010; Ginsberg et al. 2010a).
Table II.
Antibody Characterization
| Antibody Name | Structure Immunogen | Antibody Information | Concentration |
|---|---|---|---|
| RmDo20 | enzymatically dephosphorylated, purified rat NF-M | Gift of VM-Y Lee; mouse monoclonal antibody | 1:200 |
| GRIA1 | 15 residue synthetic peptide (KMSHSSGMPLGATGL) corresponding to C-terminus of rat GluR1 | Millipore/Upstate, 06-306; rabbit polyclonal antibody | 1:1000 |
| GRIA2/3 | synthetic peptide corresponding to aa 864-883 of rat GluR2 | Millipore, 06-307; rabbit polyclonal antibody; RRID:AB_2314574 | 1:1000 |
| TrkB | human TrkB aa 156-322 | BD Transduction Laboratory, 610102; Mouse polyclonal antibody purified; RRID:AB_397508 | 1:500 |
| TrkC | peptide surrounding Gly50 of human TrkC | Cell Signalling, 3376S, rabbit monoclonal antibody; RRID:AB_2155283 | 1:1000 |
| NTF3 | synthetic peptide from the C-terminal region of NTF3 conjugated to KLH | Pierce/Thermo Scientific, PA514861; rabbit polyclonal antibody; RRID:AB_2154265 | 1:100 |
| BDNF | peptide mapping within an internal region of human BDNF | Santa Cruz, SC-546; rabbit polyclonal antibody; RRID:AB_630940 | 1:1000 |
| TUBB | derived from 2-28-33 hybridoma | Sigma; T-5293; mouse monoclonal antibody; RRID:AB_477580 | 1:1000 |
Results
Microarray analysis reveals significant gene expression alterations within CA1 pyramidal neurons in young-middle aged Ts65Dn mice
Alterations in gene expression in CA1 pyramidal neurons comparing 4-9 month old Ts65Dn mice to 2N littermates were examined using 90 custom-designed microarrays (50 cells analyzed per array; total 41 Ts65Dn arrays and 37 2N arrays). Quantitative analysis showed differential expression of 35 genes out of 576 total genes examined with a cut-off of uncorrected p<0.01 (6%; Table III), with 9 passing FDR (q<0.05) and 14 passing FDR (q<0.1; an additional 55 genes displayed trend-level alteration with uncorrected p-values between 0.02<p<0.05; Table IV).
Table III.
Specific changes in CA1 pyramidal neuron gene expression on the custom-designed microarray platform.
| Gene Abbreviation | Gene specifically altered | Fold Change |
|---|---|---|
| AGER* | RAGE, advanced glycosylation end product-specific receptor | −1.40 |
| CAT* | catalase | −1.78 |
| CCNB1 | cyclin B1 | −1.49 |
| CCND2** | cyclin D2 | −1.43 |
| CHRNA2 | nicotinic acetylcholine receptor alpha 2 | −1.33 |
| COMT | catechol-O-methyltransferase | −2.12 |
| CTNNB1* | b-catenin | −1.52 |
| CTSB | cathepsin B | −1.56 |
| GABRA4 | GABA A receptor, alpha 4 | −1.64 |
| GABRD | GABA A receptor, delta | −1.81 |
| GABRG1* | GABA A receptor, gamma 1 | −1.60 |
| GRM4 | glutamate receptor, metabotropic 4 | −1.52 |
| HSPA5/BIP** | Heat shock 70kDa protein 5 | +1.37 |
| IGFR1 | insulin-like growth factor receptor tyrosine kinase 1 | −1.52 |
| KCNIP3** | Kv channel interacting protein 3, calsenilin | −1.46 |
| MAPT4** | tau 4Rtau 1 insert (4R1N) | −2.15 |
| MBP* | myelin basic protein | −1.84 |
| MYO5B | Myosin Vb | +1.55 |
| NPC2 | Niemann-Pick disease, type C2 | +1.42 |
| NR4A3 | nuclear receptor subfamily 4, group A, member 3 | +1.56 |
| NTRK2ECD | TrkB extracellular domain | −1.31 |
| NTRK3ECD* | TrkC extracellular domain | −1.53 |
| NTRK3TK* | TrkC tyrosine kinase domain | −1.88 |
| p75** | pan-neurotrophin receptor (p75NTR) | −1.76 |
| PTGS1 | COX-1 prostaglandin-endoperoxide synthase 1 | −1.33 |
| RAB11A | RAS-related protein, member RAS oncogene family 11a | +1.36 |
| RAB9* | RAS-related protein, member RAS oncogene family 9 | −1.81 |
| SAA4* | serum amyloid A4 | −1.59 |
| SAPK3 | stress-activated protein kinase 3 | −1.28 |
| TIMP1 | metalloproteinase inhibitor 1 precursor | +1.50 |
All unadjusted p-values are p<0.01. Genes that pass FDR at 0.05 are indicated with a double asterisk. Genes that pass FDR at 0.1 are indicated with an asterisk.
Table IV.
Trend level changes in CA1 pyramidal neuron gene expression via microarray analysis.
| Gene Abbreviation | Gene specifically altered | Fold Change |
|---|---|---|
| APP | amyloid precursor protein (APP695) | −4.89 |
| ACHE | acetylcholinesterase | −2.00 |
| ADCY3 | adenylate cyclase 3 | +1.18 |
| ADRA2B | adrenergic receptor, alpha 2b | −1.63 |
| APCS | serum amyloid P-component | −1.56 |
| APLP2 | amyloid precursor-like protein 2 | −1.26 |
| ATG12 | autophagy related 12 homolog | −1.36 |
| BCHE | butyrylcholinesterase | −1.35 |
| BMP1 | bone morphogenic protein 1 | −1.34 |
| CAMK2A | calcium/calmodulin-dependent protein kinase II, alpha | −1.58 |
| CAPN1 | calpain 1, (mu/I) large subunit | −1.76 |
| CASP10 | caspase 10 | −1.18 |
| CAV2 | caveolin 2 | +1.43 |
| CAV3 | caveolin 3 | −2.22 |
| CHRNA3 | nicotinic acetylcholine receptor alpha 3 | −1.36 |
| CHRNA4 | nicotinic acetylcholine receptor alpha 4 | −1.54 |
| CHRNB3 | nicotinic acetylcholine receptor beta 3 | + 1.85 |
| CNTF | ciliary neurotrophic factor | −1.27 |
| CSF1 | colony stimulating factor 1 (macrophage) | −1.46 |
| CSPG2 | chondroitin sulfate proteoglycan 2 (versican) | −1.43 |
| DDX17 | DEAD/H (Asp-Glu-Ala-Asp/His) box polypeptide 17, 72kDa | −1.26 |
| DNAJB1 | DnaJ (Hsp40) homolog, subfamily B, member 1 | −1.36 |
| DRD5 | dopamine receptor D5 | −1.46 |
| EEA1 | early endosome antigen 1 | −1.34 |
| ELAVL3 | embryonic lethal, abnormal vision, Drosophila-like 3 (Hu antigen C) | −1.33 |
| FALZ | fetal Alzheimer antigen | −1.28 |
| GABRA2 | GABA A receptor, alpha 2 | −1.27 |
| GABRB3 | GABA A receptor, beta 3 | −1.28 |
| GNA15 | guanine nucleotide binding protein, alpha 15 | +1.33 |
| GNB1 | guanine nucleotide binding protein (G protein), beta polypeptide 1 | +1.69 |
| GNB3 | guanine nucleotide binding protein (G protein), gamma 3 subunit | +1.40 |
| GNB4 | guanine nucleotide binding protein (G protein), beta polypeptide 4 | +1.39 |
| IL6 | interleukin 6 | −1.26 |
| LRP1 | low density lipoprotein-related protein 1 (alpha-2-macroglobulin receptor) | −1.28 |
| MAPK14 | mitogen activated protein kinase 14, p38 | −1.54 |
| MAPK8 | mitogen-activated protein kinase 8 | −1.19 |
| MAPKAPK | MAP kinase-activated protein kinase 2 | −1.31 |
| MAPT2 | 4Rtau 0 insert (4R0N) | −1.31 |
| MAPT6 | 4Rtau 2 inserts (4R2N) | −1.44 |
| MSC1 | EST for multiple sclerosis related protein | −1.40 |
| MSR1 | macrophage scavenger receptor 1 | +1.22 |
| NR4A2 | nuclear receptor subfamily 4, group A, member 2 (NURR1) | +1.31 |
| NTF5 | neurotrophin 4/5 | −1.33 |
| NTRK1TK | NGF receptor TrkA tyrosine kinase domain | −1.31 |
| PRKCI | protein kinase C, iota | −1.23 |
| POLR2C | polymerase (RNA) II (DNA directed) polypeptide C | −1.30 |
| PPP1CB | protein phosphatase 1, catalytic subunit, beta isoform | −1.28 |
| PPP3CC | protein phosphatase 3, catalytic subunit, gamma isoform | −1.37 |
| PRKR | protein kinase, interferon-inducible double stranded RNA dependent | +1.24 |
| RAB11A | RAS-related protein, member RAS oncogene family 11a | +1.36 |
| RBL2 | p130 | −1.65 |
| RGS16 | regulator of G-protein signalling 16 | −1.29 |
| SAPK3 | stress-activated protein kinase 3 | −1.28 |
| SLC18A3 | solute carrier family 18, member 3, vesicular acetylcholine transporter 1 | −1.29 |
| SLC6A13 | solute carrier family 6, member 13 GABA transporter GAT3 | −1.43 |
| SLC6A4 | solute carrier family 6, member 4, serotonin transporter SERT4 | −1.39 |
| SNCG | gamma synuclein | −1.31 |
| SST | somatostatin | −1.54 |
| STX5A | syntaxin 5A | −1.52 |
| TGM2 | transglutaminase 2 | −1.19 |
Unadjusted p-value changes in CA1 pyramidal neuron gene expression at trend level (0.02<p<0.05)
As a gene ontology class, neurotrophins and cognate neurotrophin receptors displayed strikingly significant changes in gene expression in 4-9 month old Ts65Dn mice compared to 2N littermates, along with significant alterations in select monoamines, endosomal/lysosomal markers, and AD-related genes (Table III). Specifically, results indicated that several of the neurotrophins and neurotrophin receptors represented on the custom-designed microarray displayed significantly decreased (or trend level decreased) RNA expression levels within Ts65Dn CA1 pyramidal neurons compared to 2N littermates. Decreases were seen in ciliary neurotrophic factor (CNTF; 21% decrease, p=0.04) and neurotrophin 4/5 (NTF4/5; 25% decrease, p=0.03). In terms of altered neurotrophin receptor expression levels, the pan-neurotrophin receptor (p75NTR; 43% decrease, p<0.005), brain-derived neurotrophic factor (BDNF) cognate receptor TrkB, TrkB extracellular domain (TrkB-ECD; 24% decrease, p<0.01), and neurotrophin-3 (NTF3) cognate receptor TrkC, TrkC-ECD (35% decrease, p<0.001), and TrkC tyrosine kinase domain (TrkC-TK, 47% decrease, p<0.001) were significantly downregulated in Ts65Dn CA1 neurons. The nerve growth factor β (NGFβ) cognate receptor TrkA, tyrosine kinase domain (TrkA-TK) showed a trend level decrease (23% decrease, p=0.047) as well as TrkB-TK (29% decrease; p=0.06). No significant alterations were found in glial-cell derived neurotrophic factor (GDNF), BDNF, NGFβ, or NTF3 expression levels (Fig. 1A, Tables III, IV).
Figure 1. Downregulation of select neurotrophins, neurotrophin receptors, and AD-related genes in young-middle aged Ts65Dn CA1 pyramidal neurons.
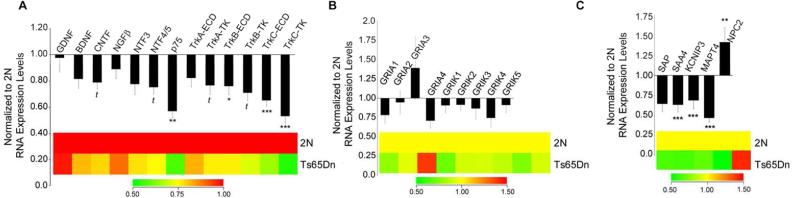
Bar graphs and color coded heatmaps illustrating relative transcript levels in Ts65Dn (n = 9) and 2N (n = 7) mice at 4-9 months of age in CA1 neurons. (A) Several neurotrophins and cognate neurotrophin receptors displayed downregulation, including CNTF, NTF4/5, p75NTR, TrkA, TrkB, and TrkC (B) No significant changes in GluR subunits were observed. (C) Alterations in AD-related transcripts included SAA4, KCNIP3, MAPT4, and NPC2 (*p < 0.01), (**p < 0.005), and (*** p < 0.001) (t= trend 0.02< p < 0.05). Error bars indicate standard error of the mean (SEM).
In CA1 pyramidal neurons assayed in older Ts65Dn mice compared to age-matched 2N animals (>10 months of age) significant changes in glutamate receptor (GluR) expression were found (Alldred et al., 2014). However, no significant changes in gene expression of any of the GluR subunits tested were found in these younger animals in the present study, including ionotropic and metabotropic GluR subunits (Fig 1B). In contrast to the GluRs, expression level alterations were detected in several AD-related transcripts, with significant decreases in serum amyloid A4 (SAA4, 37% decrease, p<0.002), Kv channel interacting protein 3, calsenilin (KCNIP3, 31% decrease, p<0.003) and microtubule-associated protein tau 4Rtau 1 insert (MAPT4 or 4R-N, 53% decrease, p<0.002). Notably, Niemann-Pick disease type C2 (NPC2) showed a significant increase in gene expression (42% increase, p<0.005) in Ts65Dn CA1 pyramidal neurons compared to 2N littermates (Fig. 1C, Table III).
qPCR validation
Select microarray-identified expression level changes were assessed via qPCR analysis using microdissected hippocampal CA1 enriched tissue obtained from Ts65Dn mice and 2N littermates. qPCR results showed no differences in gene expression for BDNF, and a trend level decrease in NTF3 (24% decrease, p=0.1), similar to the microarray results. Notably, the neurotrophin receptors TrkB (35% decrease; p<0.02) and TrkC (33% decrease; p<0.02) both showed significant downregulation via qPCR, validating microarray results in an independent cohort of mice (Fig. 2).
Figure 2. qPCR results from CA1 microdissections confirmed significant changes in gene expression by microarray analysis.

(A) BDNF showed no difference in mRNA expression levels, however, the BDNF receptor TrkB (NTRK2) showed significant downregulation, in accordance with the microarray results. NTF3 showed a trend for downregulation and the NTF3 receptor TrkC (NTRK3) was significantly downregulated. ddCT was expressed as percent of 2N control for all qPCR results. Key, (* p < 0.05) and (t p < 0.1). Error bars indicate SEM.
Immunoblot validation
Western blot analysis of BDNF, including the pro-neurotrophin BDNF (pro-BDNF) and mature BDNF was performed. Specifically, pro-BDNF displayed significant upregulation in hippocampal dissections obtained from middle-aged Ts65Dn mice as compared to 2N littermates (36% increase, p<0.01). In contrast, mature BDNF levels did not differ between genotypes (p=0.9) (Fig. 3A, B). Unlike the trend for downregulation seen in the microarray and qPCR results, NTF3 expression showed no change in protein expression levels (Fig. 3A, B). Immunoblot assessment did reveal a trend level decrease of full-length TrkB (TrkB-FL; 29% decrease, p=0.09) but no change in truncated TrkB (TrkB-T1) in regional hippocampal homogenates from Ts65Dn mice compared to 2N littermates (Fig. 3A, B). Full-length TrkC (TrkC-FL) displayed no changes in expression level whereas truncated TrkC (TrkC-T1) displayed a trend level decrease in protein expression (33% decrease, p=0.07) (Fig. 3A, B). There were no changes in protein expression levels of either of the AMPA GluR subunits examined (GRIA1 and GRIA2/3), consistent with the results seen in the microarray (Fig. 1B) and qPCR data (data not shown).
Figure 3. Immunoblotting of hippocampal dissections showed select changes in protein levels.

Immunoblot analysis using regional hippocampal dissections was performed to assess whether selected transcriptional alterations resulted in commensurate protein level changes in Ts65Dn mice compared to 2N littermates at 4-6 months of age. (A) Representative immunoblots for pro-BDNF, mature BDNF, NTF3, TrkB-FL, TrkB-T1, TrkC-FL, and TrkC-T1. β-tubulin (TUBB) expression was used as a loading control. (B) Normalized expression levels compared to TUBB expression show upregulation of pro-BDNF (p<0.02), a trend towards downregulation of TrkB-FL (p =0.09) and TrkC-T1 (p= 0.069), but no significant changes in NTF3, mature BDNF, TrkB-T1 and TrkC-FL expression. Key: 2N black, Ts65Dn grey.
Discussion
DS is a genetic disorder that has a complex phenotype marked by ID and early onset AD pathology, including degeneration of the septohippocampal circuit. Unfortunately, there are no effective treatments or cures for DS or AD. Currently, most FDA approved treatments for AD involve delaying the CBF/BFCN degeneration, and show mixed effects, making it imperative to further understand the progression of the degeneration seen in the hippocampal neurons. Treatment regimens for the neuropathology and dementia are only moderately effective, early in the disease, but studies to date have found later treatments are ineffective. Moreover, the delivery of memantine, an FDA-approved drug for alleviating some of the symptoms associated with cognitive decline, has not been proven to be effective in DS patients (Hanney et al. 2012). To identify potential targets for intervention therapies, we examined a well-established mouse model of DS/AD during the time of BFCN degeneration initiation to characterize specific gene expression profiles in a neuronal population that is especially vulnerable to the neurodegeneration found in early AD and DS (Mufson et al. 2008; Kelley et al. 2014a, 2014b). We compared trisomic mice to their disomic littermates to identify individual genes and pathways that are dysregulated at the start of neurodegeneration to select targets for therapeutic interventions. Prior to the current findings, there was little gene expression data available in the septohippocampal circuit in young-middle aged trisomic mice. The present results demonstrate that even in these younger Ts65Dn mice there are significant deficits in multiple systems necessary for normal septohippocampal function.
Microarray results suggest that a multiplicity of alterations occur in CA1 pyramidal neurons early during BFCN degeneration in trisomic mice. The most significant pathway perturbations that we identified in our custom-designed array approach appear to be the downregulation of select neurotrophins and cognate neurotrophin receptors as well as dysregulation of several AD pathology-related genes. Notably, expression level changes of the neurotrophin class of transcripts in the present cohort of young-middle aged adult Ts65Dn mice was less pronounced than what was seen via microarray and validated by qPCR and immunoblot preparations of in older trisomic mice (Alldred et al., 2014), suggesting a progression of neurodegenerative changes observed in human DS and AD in the septohippocampal circuit (Ginsberg et al. 2006, 2012; Ginsberg 2010; Counts et al. 2011, 2014). These molecular and cellular datasets suggest that neurotrophin signaling pathways are rational targets for therapeutic intervention. Since neurotrophin receptor expression levels are downregulated, and neurotrophin expression appears to partially parallel these decreases, possible interventions include gene therapy (Tuszynski 2002, 2007; Maeder et al. 2013), modifications in target-derived neurotrophic support (Cooper et al. 2001; Howe and Mobley 2004; Salehi et al. 2006) and potentially receptor transactivation (Rajagopal et al. 2004; Skaper 2008; Huang and McNamara 2012) to increase TrkA, TrkB, and/or TrkC signaling for pro-survival effects. Importantly, increasing neurotrophic support can be used in conjunction with so-called monotherapies that aim to modify amyloid and/or tau levels in AD and DS (D'Alton and George 2011; Lane et al. 2012) for a more sophisticated treatment regimen with a higher likelihood of success by effecting multiple targets during the presumed prodromal and neurodegenerative phases of DS and AD.
Neurotrophins and neurotrophin receptors have been implicated in neuronal survival and differentiation and maintenance of neuronal systems, including the septohippocampal circuitry. Downregulation of these pro-survival genes may be an underlying cause for the vulnerability of the CA1 pyramidal neurons to AD pathology. Deficits seen in the CA1 pyramidal neurons may be due to the reliance on retrograde trafficking of neurotrophins within the septohippocampal circuit, including NGF, BDNF and NTF3, which all have shown to be dysregulated in AD and DS (Chao 2003; Mufson et al. 2007; Peng et al. 2009; Ginsberg et al. 2010a). Utilizing the Ts65Dn mouse, several studies have targeted neurotrophins and cognate neurotrophin receptors to restore neurogenesis and arrest neurodegeneration of BFCNs and hippocampal neurons (Salehi et al. 2006; Fukuda et al. 2010; Blanchard et al. 2011; Chung et al. 2012). The deficits in neurotrophin and neurotrophin receptor expression observed within CA1 neurons in the present study may represent early markers septohippocampal degeneration, progressing through the lifespan along with concomitant BFCN degeneration, and coupled with our observations in aged Ts65Dn mice (Alldred et al., 2014), may model the progression of neurodegeneration of CA1 pyramidal neurons and CBF neurons from mild cognitive impairment (MCI) to AD (Ginsberg et al., 2006, 2007, 2010a; Mufson et al., 2007, 2008). Specifically, previous work by our group in human MCI and AD brain tissue has found early downregulation of NGF, BDNF, and NTF3 cognate receptors TrkA, TrkB, and TrkC within hippocampal CA1 pyramidal neurons and CBF neurons during the progression of AD, indicating the vulnerability of the septohippocampal circuit (Ginsberg et al. 2006, 2010a, 2012). Interestingly, in young-middle aged animals, we see minor decreases that are not significant in NGF or BDNF expression, consistent with previous assessments in Ts65Dn mice (Peng et al., 2009). However, significant downregulation was found for these neurotrophins in aged trisomic animals (Alldred et al., 2014). These observations contrast some of the findings of Cooper et al., where increases in NGF levels were found at 6 and 12 months of age in the hippocampus of Ts65Dn mice (Cooper et al., 2001). Notable differences include that in the present report we are examining RNA levels in homogeneous CA1 pyramidal neurons, and not in the hippocampus as a whole as in the latter study, which includes admixed cell types with likely varying degrees of neurotrophin and neurotrophin receptor expression. Notably, we report an increase in pro-BDNF expression in the hippocampus of young-middle aged trisomic animals, whereas mature BDNF was unchanged. In contrast, we have reported a significant deficit in both pro-BDNF and mature BDNF in aged Ts65Dn hippocampus (Alldred et al., 2014), indicating that aging has a significant effect upon neurotrophin biology in the Ts65Dn mouse, similar to the progressive changes in proBDNF and mature BDNF in MCI and AD (Peng et al., 2005).
A caveat to the use of the Ts65Dn mouse model, which is trisomic for approximately 88/161 orthologs on HSA21, is that ~50 encoded genes triplicated in Ts65Dn are not triplicated in HSA21 (Sturgeon and Gardiner 2011). Thus, caution has to be used when interpreting expression level changes in the context of what is occurring in human trisomy. However, many cognitive and morphological changes are similar in Ts65Dn mice and bona fide DS, notably in the context of AD-like neuropathology. The current work extends the utility of the model, as the Ts65Dn mouse serves as useful translational tool to evaluate the efficacy of neurotrophin modulation for the development and refinement of early intervention therapeutics to ameliorate neuropathology and cognitive decline in DS and AD.
The present results suggest that dampening of neurotrophin receptor gene expression is an early change within CA1 pyramidal neurons, which surprisingly included the downregulation of the pan-neurotrophin p75NTR receptor. This decrease in p75NTR was not seen within CA1 pyramidal neurons in aged Ts65Dn animals (Alldred et al., 2014), nor is it seen in the human AD condition (Counts et al. 2004; Ginsberg et al. 2006), although there is evidence for a gender difference in p75NTR expression within CBF neurons in AD (Counts et al., 2011). This discrepancy in mRNA levels between young-middle aged and aged Ts65Dn mice intriguing, and may indicate a switch between pro-survival and pro-death signaling within vulnerable neuronal populations as trisomic animals age.
In contrast to aged Ts65Dn mice (Alldred et al., 2014), we saw no significant changes in excitatory GluR subunit expression in young-middle aged Ts65Dn mice. The lack of change in the 4-9 month old animals confirms what has been previously seen in Ts65Dn mice before the age of 6 months (Granholm et al. 2003; Belichenko et al. 2004; Lorenzi and Reeves 2006; Pollonini et al. 2008; Lockrow and Prakasam 2009). However, recent work by our collaborative group in the Ts2 model of DS/AD has shown aberrant glutamatergic signaling in the hippocampus (Kaur et al. 2014) including downregulation in the NMDA receptor subunit GRIN1 and a trend for downregulation of the PSD-95 in 8 month old animals but no changes in AMPA receptor subunit RNA expression levels. These molecular, cellular, and physiological results suggest that alterations found in GluR expression are progressive, which mimics the human DS and AD condition. We posit this may be a result of the BFCN degeneration and synaptic dysfunction seen in these animals, although additional research is required to validate this assertion. We also report significant alterations in a variety of other gene ontology categories, including AD-related markers, monoamines, GABAergic receptor subunits, and a few endosomal-lysosomal markers (Tables III, IV). Further research is required on independent cohorts to validate each of these potential targets, but the single population microarray study indicates that several relevant genes are dysregulated relatively early in the lifespan of trisomic mice in a vulnerable hippocampal neuronal population.
The custom-designed microarray platform utilized in this study has the advantage of being hypothesis driven and interrogative. However, a limitation of this platform is the lack of coverage for the entire genome. High-density microarray and/or RNA-seq studies are valid high throughput options for follow-up studies with trisomic mice. Unfortunately, the current limitation of these platforms is a relatively large RNA input requirement, which turns single population analyses into a daunting task. Recent advancements in LCM and RNA amplification technology has increased the feasibility for these experiments to be undertaken, and are part of our future aims for translational studies. Notably, DS and AD neurodegeneration has proven to be cell-type specific, limiting the utility of regional and/or global studies where expression analyses contain an admixture of neuronal and non-neuronal cells (Alldred et al. 2012; Ginsberg et al. 2012; Stempler and Ruppin 2012).
Conclusions
Single population molecular fingerprinting of CA1 pyramidal neurons in young-middle aged adult trisomic mice shows a notable downregulation of several cognate neurotrophin receptors, with focal changes in select neurotrophins. These findings suggest a dampening of pro-survival pathways early in septohippocampal degeneration, which may underlie ID and the cognitive decline seen in this mouse model of DS and AD. Studies in human postmortem tissue during the progression of AD have shown similar changes within CA1 pyramidal neurons (Ginsberg et al. 2010a, 2012; Alldred et al. 2012; Counts et al. 2014), making the present work translationally relevant. In summary, the Ts65Dn mouse represents a model of neurotrophin failure in the hippocampus that faithfully mimics key molecular and cellular alterations that are occurring in this vulnerable cell type in the human condition. Additional expression profiling employing human DS postmortem tissue across the lifespan of the patients is required for further proof of concept. Moreover, translational studies using trisomic mouse models to develop therapeutic interventions, such as dietary treatments, including maternal choline supplementation and caloric restriction (Moon et al. 2010; Velazquez et al. 2013; Ash et al., 2014; Kelley et al. 2014a, 2014b; Yan et al., 2014) have shown promise in improving cognitive function and may provide neurotrophic support to reduce pathology and improve behavioral and physiological outcomes.
Supplementary Material
Acknowledgements
Support for this project comes from NIH grants AG043375, AG014449, AG017617, and the Alzheimer's Association (IIRG-12-237253). We thank Irina Elarova, M.S. and Arthur Saltzman, M.S. for expert technical assistance.
Role of Authors
All authors had full access to all the data in the study and take responsibility for the integrity of the data and the accuracy of the data analysis. Our colleagues have agreed to be named in the Acknowledgements section. Study concept and design: (MJA and SDG). Acquisition of data: (MJA). Analysis and interpretation of data: (MJA, SHL, EP, and SDG). Drafting of the manuscript: (MJA). Critical revision of the manuscript for important intellectual content: (MJA, EP, and SDG). Statistical analysis: (MJA, SHL, and EP). Obtained funding: (SDG).
Footnotes
Conflict of Interest Statement
The authors (MJA, SHL, EP, and SDG) have no conflicts of interest to disclose.
References
- Akeson E, Lambert J. Ts65Dn–localization of the translocation breakpoint and trisomic gene content in a mouse model for Down syndrome. Cytogenet Cell Genet. 2001;276:270–276. doi: 10.1159/000056997. [DOI] [PubMed] [Google Scholar]
- Alldred MJ, Che S, Ginsberg SD. Terminal Continuation (TC) RNA amplification enables expression profiling using minute RNA input obtained from mouse brain. Int J Mol Sci. 2008;9:2091–2104. doi: 10.3390/ijms9112091. [DOI] [PMC free article] [PubMed] [Google Scholar]
- Alldred MJ, Che S, Ginsberg SD. Terminal continuation (TC) RNA amplification without second strand synthesis. J Neurosci Methods. 2009;177:381–385. doi: 10.1016/j.jneumeth.2008.10.027. [DOI] [PMC free article] [PubMed] [Google Scholar]
- Alldred MJ, Duff KE, Ginsberg SD. Microarray analysis of CA1 pyramidal neurons in a mouse model of tauopathy reveals progressive synaptic dysfunction. Neurobiol Dis. 2012;45:751–762. doi: 10.1016/j.nbd.2011.10.022. [DOI] [PMC free article] [PubMed] [Google Scholar]
- Alldred MJ, Lee SH, Petkova E, Ginsberg SD. Expression profile analysis of hippocampal CA1 pyramidal neurons in aged Ts65Dn mice, a model of Down syndrome (DS) and Alzheimer's disease (AD). Brain Struct Funct. 2014 doi: 10.1007/s00429-014-0839-0. in press. [DOI] [PMC free article] [PubMed] [Google Scholar]
- Applied Biosystems Guide to Performing Relative Quantitation of Gene Expression Using Real-Time Quantitative PCR. Gene Expr. 2008;2009:1–60. [Google Scholar]
- Ash JA, Velazquez R, Kelley CM, Powers BE, Ginsberg SD, Mufson EJ, Strupp BJ. Maternal choline supplementation improves spatial mapping and increases basal forebrain cholinergic neuron number and size in aged Ts65Dn mice. Neurobiol Dis. 2014;70:32–42. doi: 10.1016/j.nbd.2014.06.001. [DOI] [PMC free article] [PubMed] [Google Scholar]
- Belichenko NP, Belichenko PV, Kleschevnikov AM, et al. The “Down syndrome critical region” is sufficient in the mouse model to confer behavioral, neurophysiological, and synaptic phenotypes characteristic of Down syndrome. J Neurosci. 2009;29:5938–5948. doi: 10.1523/JNEUROSCI.1547-09.2009. [DOI] [PMC free article] [PubMed] [Google Scholar]
- Belichenko PV, Masliah E, Kleschevnikov AM, et al. Synaptic structural abnormalities in the Ts65Dn mouse model of Down Syndrome. J Comp Neurol. 2004;480:281–298. doi: 10.1002/cne.20337. [DOI] [PubMed] [Google Scholar]
- Benjamini Y, Hochberg Y. Controlling the false discovery rate: a practical and powerful approach to multiple testing. J R Stat Soc Ser B. 1995;57:289–300. [Google Scholar]
- Blanchard J, Bolognin S, Chohan MO, et al. Rescue of synaptic failure and alleviation of learning and memory impairments in a trisomic mouse model of down syndrome. J Neuropathol Exp Neurol. 2011;70:1070–1079. doi: 10.1097/NEN.0b013e318236e9ad. [DOI] [PubMed] [Google Scholar]
- Cataldo AM, Peterhoff CM, Troncoso JC, et al. Endocytic pathway abnormalities precede amyloid β deposition in sporadic Alzheimer's disease and Down syndrome. Am J Pathol. 2000;157:277–286. doi: 10.1016/s0002-9440(10)64538-5. [DOI] [PMC free article] [PubMed] [Google Scholar]
- Chao MV. Retrograde transport redux. Neuron. 2003;39:1–2. doi: 10.1016/s0896-6273(03)00401-x. [DOI] [PubMed] [Google Scholar]
- Chapman R, Hesketh L. Behavioral phenotype of individuals with Down syndrome. Ment Retard Dev Disabil Res Rev. 2000;95:84–95. doi: 10.1002/1098-2779(2000)6:2<84::AID-MRDD2>3.0.CO;2-P. [DOI] [PubMed] [Google Scholar]
- Che S, Ginsberg SD. Amplification of RNA transcripts using terminal continuation. Lab Invest. 2004;84:131–137. doi: 10.1038/labinvest.3700005. [DOI] [PubMed] [Google Scholar]
- Chen Z, Simmons MS, Perry RT, et al. Genetic association of neurotrophic tyrosine kinase receptor type 2 (NTRK2) with Alzheimer's disease. Am J Med Genet B Neuropsychiatr Genet. 2008;147:363–369. doi: 10.1002/ajmg.b.30607. [DOI] [PubMed] [Google Scholar]
- Chung B, Hinek A, Keating S, et al. Overgrowth with increased proliferation of fibroblast and matrix metalloproteinase activity related to reduced TIMP1: a newly recognized syndrome? Am J Med Genet A. 2012;158A:2373–2381. doi: 10.1002/ajmg.a.35570. [DOI] [PubMed] [Google Scholar]
- Contestabile A, Fila T, Bartesaghi R, Ciani E. Choline acetyltransferase activity at different ages in brain of Ts65Dn mice, an animal model for Down's syndrome and related neurodegenerative diseases. J Neurochem. 2006;97:515–526. doi: 10.1111/j.1471-4159.2006.03769.x. [DOI] [PubMed] [Google Scholar]
- Cooper JD, Salehi A, Delcroix JD, et al. Failed retrograde transport of NGF in a mouse model of Down's syndrome: reversal of cholinergic neurodegenerative phenotypes following NGF infusion. Proc Natl Acad Sci USA. 2001;98:10439–10444. doi: 10.1073/pnas.181219298. [DOI] [PMC free article] [PubMed] [Google Scholar]
- Counts SE, Alldred MJ, Che S, et al. Synaptic gene dysregulation within hippocampal CA1 pyramidal neurons in mild cognitive impairment. Neuropharmacology. 2014;79:172–179. doi: 10.1016/j.neuropharm.2013.10.018. [DOI] [PMC free article] [PubMed] [Google Scholar]
- Counts SE, Che S, Ginsberg SD, Mufson EJ. Gender differences in neurotrophin and glutamate receptor expression in cholinergic nucleus basalis neurons during the progression of Alzheimer's disease. J Chem Neuroanat. 2011;42:111–117. doi: 10.1016/j.jchemneu.2011.02.004. [DOI] [PMC free article] [PubMed] [Google Scholar]
- Counts SE, Nadeem M, Wuu J, et al. Reduction of cortical TrkA but not p75(NTR) protein in early-stage Alzheimer's disease. Ann Neurol. 2004;56:520–531. doi: 10.1002/ana.20233. [DOI] [PubMed] [Google Scholar]
- D'Alton S, George DR. Changing perspectives on Alzheimer's disease: thinking outside the amyloid box. J Alzheimers Dis. 2011;25:571–581. doi: 10.3233/JAD-2011-110089. [DOI] [PubMed] [Google Scholar]
- Das I, Reeves RH. The use of mouse models to understand and improve cognitive deficits in Down syndrome. Dis Model Mech. 2011;4:596–606. doi: 10.1242/dmm.007716. [DOI] [PMC free article] [PubMed] [Google Scholar]
- Davisson M, Schmidt C. Segmental trisomy as a mouse model for Down syndrome. Prog Clin Biol Res. 1993:117–133. [PubMed] [Google Scholar]
- Efron B. Correlation and large-scale simultaneous significance testing. J Am Stat Assoc. 2007;102:93–103. [Google Scholar]
- Esbensen AJ. Health conditions associated with aging and end of life of adults with Down syndrom. Int Rev Res Ment Retard. 2010;39:107–126. doi: 10.1016/S0074-7750(10)39004-5. [DOI] [PMC free article] [PubMed] [Google Scholar]
- Escorihuela RM, Fernández-Teruel A, Vallina IF, et al. A behavioral assessment of Ts65Dn mice: a putative Down syndrome model. Neurosci Lett. 1995;199:143–146. doi: 10.1016/0304-3940(95)12052-6. [DOI] [PubMed] [Google Scholar]
- Fukuda Y, Berry TL, Nelson M, et al. Stimulated neuronal expression of brain-derived neurotrophic factor by neurotropin. Mol Cell Neurosci. 2010;45:226–233. doi: 10.1016/j.mcn.2010.06.013. [DOI] [PubMed] [Google Scholar]
- Gardiner K, Fortna A, Bechtel L, Davisson MT. Mouse models of Down syndrome: how useful can they be? Comparison of the gene content of human chromosome 21 with orthologous mouse genomic regions. Gene. 2003;318:137–147. doi: 10.1016/s0378-1119(03)00769-8. [DOI] [PubMed] [Google Scholar]
- Ginsberg SD. Glutamatergic neurotransmission expression profiling in the mouse hippocampus after perforant-path transection. Am J Geriatr Pyschiatry. 2005a;13:1052–1061. doi: 10.1176/appi.ajgp.13.12.1052. [DOI] [PubMed] [Google Scholar]
- Ginsberg SD. RNA amplification strategies for small sample populations. Methods. 2005b;37:229–237. doi: 10.1016/j.ymeth.2005.09.003. [DOI] [PubMed] [Google Scholar]
- Ginsberg SD. Transcriptional profiling of small samples in the central nervous system. Methods Mol Biol. 2008;439:147–158. doi: 10.1007/978-1-59745-188-8_10. [DOI] [PMC free article] [PubMed] [Google Scholar]
- Ginsberg SD. In: Microarray use for the analysis of the CNS. Encyclopedia of Neuroscience. Squire LR, editor. Vol. 5. Academic Press; Oxford: 2009. pp. 835–841. [Google Scholar]
- Ginsberg SD. Alterations in discrete glutamate receptor subunits in adult mouse dentate gyrus granule cells following perforant path transection. Anal Bioanal Chem. 2010;397:3349–3358. doi: 10.1007/s00216-010-3826-1. [DOI] [PMC free article] [PubMed] [Google Scholar]
- Ginsberg SD. Expression profile analysis of brain aging. In: Riddle DR, editor. Brain Aging: Models, Methods and Mechanisms. CRC Press; New York: 2007. pp. 159–185. [Google Scholar]
- Ginsberg SD, Alldred MJ, Che S. Gene expression levels assessed by CA1 pyramidal neuron and regional hippocampal dissections in Alzheimer's disease. Neurobiol Dis. 2012;45:99–107. doi: 10.1016/j.nbd.2011.07.013. [DOI] [PMC free article] [PubMed] [Google Scholar]
- Ginsberg SD, Alldred MJ, Counts SE, et al. Microarray analysis of hippocampal CA1 neurons implicates early endosomal dysfunction during Alzheimer's disease progression. Biol Psychiatry. 2010a;68:885–893. doi: 10.1016/j.biopsych.2010.05.030. [DOI] [PMC free article] [PubMed] [Google Scholar]
- Ginsberg SD, Che S, Wuu J, et al. Down regulation of Trk but not p75NTR gene expression in single cholinergic basal forebrain neurons mark the progression of Alzheimer's disease. J Neurochem. 2006;97:475–487. doi: 10.1111/j.1471-4159.2006.03764.x. [DOI] [PubMed] [Google Scholar]
- Ginsberg SD, Hemby SE, Lee VMY, et al. Expression profile of transcripts in Alzheimer's disease tangle-bearing CA1 neurons. Ann Neurol. 2000;48:77–87. [PubMed] [Google Scholar]
- Ginsberg SD, Mirnics K. Functional genomic methodologies. Prog Brain Res. 2006;158:15–40. doi: 10.1016/S0079-6123(06)58002-1. [DOI] [PubMed] [Google Scholar]
- Ginsberg SD, Mufson EJ, Counts SE, et al. Regional selectivity of rab5 and rab7 protein upregulation in mild cognitive impairment and Alzheimer's disease. J Alzheimers Dis. 2010b;22:631–639. doi: 10.3233/JAD-2010-101080. [DOI] [PMC free article] [PubMed] [Google Scholar]
- Granholm A-C, Sanders L, Seo H, et al. Estrogen alters amyloid precursor protein as well as dendritic and cholinergic markers in a mouse model of Down syndrome. Hippocampus. 2003;13:905–914. doi: 10.1002/hipo.10130. [DOI] [PubMed] [Google Scholar]
- Granholm AC, Sanders LA, Crnic LS. Loss of cholinergic phenotype in basal forebrain coincides with cognitive decline in a mouse model of Down's syndrome. Exp Neurol. 2000;161:647–663. doi: 10.1006/exnr.1999.7289. [DOI] [PubMed] [Google Scholar]
- Hanney M, Prasher V, Williams N, et al. Memantine for dementia in adults older than 40 years with Down's syndrome (MEADOWS): a randomised, double-blind, placebo-controlled trial. Lancet. 2012;379:528–536. doi: 10.1016/S0140-6736(11)61676-0. [DOI] [PubMed] [Google Scholar]
- Holtzman DM, Santucci D, Kilbridge J, et al. Developmental abnormalities and age-related neurodegeneration in a mouse model of Down syndrome. Proc Natl Acad Sci USA. 1996;93:13333–13338. doi: 10.1073/pnas.93.23.13333. [DOI] [PMC free article] [PubMed] [Google Scholar]
- Howe CL, Mobley WC. Signaling endosome hypothesis: A cellular mechanism for long distance communication. J Neurobiol. 2004;58:207–216. doi: 10.1002/neu.10323. [DOI] [PubMed] [Google Scholar]
- Huang YZ, McNamara JO. Neuroprotective effects of reactive oxygen species mediated by BDNF-independent activation of TrkB. J Neurosci. 2012;32:15521–15532. doi: 10.1523/JNEUROSCI.0755-12.2012. [DOI] [PMC free article] [PubMed] [Google Scholar]
- Hunter CL, Isacson O, Nelson M, et al. Regional alterations in amyloid precursor protein and nerve growth factor across age in a mouse model of Down's syndrome. Neurosci Res. 2003;45:437–445. doi: 10.1016/s0168-0102(03)00005-1. [DOI] [PubMed] [Google Scholar]
- Hyde LA, Crnic LS. Age-related deficits in context discrimination learning in Ts65Dn mice that model Down syndrome and Alzheimer's disease. Behav Neurosci. 2001;115:1239–1246. [PubMed] [Google Scholar]
- Insausti AM, Megías M, Crespo D, et al. Hippocampal volume and neuronal number in Ts65Dn mice: a murine model of Down syndrome. Neurosci Lett. 1998;253:175–178. doi: 10.1016/s0304-3940(98)00641-7. [DOI] [PubMed] [Google Scholar]
- Jacobs PA, Hassold TJ. The origin of numerical chromosome abnormalities. Adv Genet. 1995;33:101–33. doi: 10.1016/s0065-2660(08)60332-6. [DOI] [PubMed] [Google Scholar]
- Jiang Y, Mullaney KA, Peterhoff CM, et al. Alzheimer's-related endosome dysfunction in Down syndrome is Abeta-independent but requires APP and is reversed by BACE-1 inhibition. Proc Natl Acad Sci USA. 2010;107:1630–1635. doi: 10.1073/pnas.0908953107. [DOI] [PMC free article] [PubMed] [Google Scholar]
- Kaur G, Sharma A, Xu W, et al. Glutamatergic transmission aberration: a major cause of behavioral deficits in a murine model of Down's syndrome. J Neurosci. 2014;34:5099–5106. doi: 10.1523/JNEUROSCI.5338-13.2014. [DOI] [PMC free article] [PubMed] [Google Scholar]
- Kelley C, Powers B, Velazquez R, et al. Maternal choline supplementation differentially alters the basal forebrain cholinergic system of young-adult Ts65Dn and disomic mice. J Comp Neurol. 2014a;522:1390–1410. doi: 10.1002/cne.23492. [DOI] [PMC free article] [PubMed] [Google Scholar]
- Kelley CM, Powers BE, Velazquez R, et al. Sex differences in the cholinergic basal forebrain in the Ts65Dn mouse model of Down syndrome and Alzheimer's disease. Brain Pathol. 2014b;24:33–44. doi: 10.1111/bpa.12073. [DOI] [PMC free article] [PubMed] [Google Scholar]
- Kurt MA, Davies DC, Kidd M, et al. Synaptic deficit in the temporal cortex of partial trisomy 16 (Ts65Dn) mice. Brain Res. 2000;858:191–197. doi: 10.1016/s0006-8993(00)01984-3. [DOI] [PubMed] [Google Scholar]
- Lane RF, Shineman DW, Steele JW, et al. Beyond amyloid: the future of therapeutics for Alzheimer's disease. Adv Pharmacol. 2012;64:213–271. doi: 10.1016/B978-0-12-394816-8.00007-6. [DOI] [PubMed] [Google Scholar]
- Lee VM, Carden MJ, Schlaepfer WW, Trojanowski JQ. Monoclonal antibodies distinguish several differentially phosphorylated states of the two largest rat neurofilament subunits (NF-H and NF-M) and demonstrate their existence in the normal nervous system of adult rats. J Neurosci. 1987;7:3474–3488. doi: 10.1523/JNEUROSCI.07-11-03474.1987. [DOI] [PMC free article] [PubMed] [Google Scholar]
- Leverenz JB, Raskind MA. Early amyloid deposition in the medial temporal lobe of young Down syndrome patients: a regional quantitative analysis. Exp Neurol. 1998;150:296–304. doi: 10.1006/exnr.1997.6777. [DOI] [PubMed] [Google Scholar]
- Levine S, Saltzman A, Levy E, Ginsberg SD. Systemic pathology in aged mouse models of Down's syndrome and Alzheimer's disease. Exp Mol Pathol. 2009;86:18–22. doi: 10.1016/j.yexmp.2008.10.006. [DOI] [PMC free article] [PubMed] [Google Scholar]
- Lockrow J, Prakasam A. Cholinergic degeneration and memory loss delayed by vitamin E in a Down syndrome mouse model. Exp Neurol. 2009;216:278–289. doi: 10.1016/j.expneurol.2008.11.021. [DOI] [PMC free article] [PubMed] [Google Scholar]
- Lorenzi HA, Reeves RH. Hippocampal hypocellularity in the Ts65Dn mouse originates early in development. Brain Res. 2006;1104:153–159. doi: 10.1016/j.brainres.2006.05.022. [DOI] [PubMed] [Google Scholar]
- Maeder ML, Linder SJ, Cascio VM, et al. CRISPR RNA-guided activation of endogenous human genes. Nat Methods. 2013;10:977–999. doi: 10.1038/nmeth.2598. [DOI] [PMC free article] [PubMed] [Google Scholar]
- Mann DM, Yates PO, Marcyniuk B, Ravindra CR. The topography of plaques and tangles in Down's syndrome patients of different ages. Neuropathol Appl Neurobiol. 1986;12:447–457. doi: 10.1111/j.1365-2990.1986.tb00053.x. [DOI] [PubMed] [Google Scholar]
- McCulloch CE, Searle SR, Neuhaus JM. Generalized, Linear, and Mixed Models. John Wiley & Sons; New York: 2008. [Google Scholar]
- Moon J, Chen M, Gandhy SU, et al. Perinatal choline supplementation improves cognitive functioning and emotion regulation in the Ts65Dn mouse model of Down syndrome. Behav Neurosci. 2010;124:346–361. doi: 10.1037/a0019590. [DOI] [PMC free article] [PubMed] [Google Scholar]
- Mufson EJ, Counts SE, Fahnestock M, Ginsberg SD. Cholinotrophic molecular substrates of mild cognitive impairment in the elderly. Curr Alzheimer Res. 2007;4:340–350. doi: 10.2174/156720507781788855. [DOI] [PubMed] [Google Scholar]
- Mufson EJ, Counts SE, Perez SE, Ginsberg SD. Cholinergic system during the progression of Alzheimer's disease: therapeutic implications. Expert Rev Neurother. 2008;8:1703–1718. doi: 10.1586/14737175.8.11.1703. [DOI] [PMC free article] [PubMed] [Google Scholar]
- Mufson EJ, Ginsberg SD, Ikonomovic MD, DeKosky ST. Human cholinergic basal forebrain: chemoanatomy and neurologic dysfunction. J Chem Neuroanat. 2003;26:233–242. doi: 10.1016/s0891-0618(03)00068-1. [DOI] [PubMed] [Google Scholar]
- Nixon RA, Cataldo AM. Lysosomal system pathways: genes to neurodegeneration in Alzheimer's disease. J Alzheimers Dis. 2006;9:277–289. doi: 10.3233/jad-2006-9s331. [DOI] [PubMed] [Google Scholar]
- Parker SE, Mai CT, Canfield MA, et al. Updated national birth prevalence estimates for selected birth defects in the United States, 2004-2006. Birth Defects Res A Clin Mol Teratol. 2010;88:1008–1016. doi: 10.1002/bdra.20735. [DOI] [PubMed] [Google Scholar]
- Peng S, Wuu J, Mufson EJ, Fahnestock M. Precursor form of brain-derived neurotrophic factor and mature brain-derived neurotrophic factor are decreased in the pre-clinical stages of Alzheimer's disease. J Neurochem. 2005;93:1412–1421. doi: 10.1111/j.1471-4159.2005.03135.x. [DOI] [PubMed] [Google Scholar]
- Peng S, Garzon DJ, Marchese M, et al. Decreased brain-derived neurotrophic factor depends on amyloid aggregation state in transgenic mouse models of Alzheimer's disease. J Neurosci. 2009;29:9321–9329. doi: 10.1523/JNEUROSCI.4736-08.2009. [DOI] [PMC free article] [PubMed] [Google Scholar]
- Pollonini G, Gao V, Rabe A, Palminiello S. Abnormal expression of synaptic proteins and neurotrophin-3 in the Down syndrome mouse model Ts65Dn. Neuroscience. 2008;156:99–106. doi: 10.1016/j.neuroscience.2008.07.025. [DOI] [PMC free article] [PubMed] [Google Scholar]
- Rajagopal R, Chen Z-Y, Lee FS, Chao MV. Transactivation of Trk neurotrophin receptors by G-protein-coupled receptor ligands occurs on intracellular membranes. J Neurosci. 2004;24:6650–6658. doi: 10.1523/JNEUROSCI.0010-04.2004. [DOI] [PMC free article] [PubMed] [Google Scholar]
- Reeves RH, Irving NG, Moran TH, et al. A mouse model for Down syndrome exhibits learning and behaviour deficits. Nat Genet. 1995;11:177–184. doi: 10.1038/ng1095-177. [DOI] [PubMed] [Google Scholar]
- Rueda N, Flórez J, Martínez-Cué C. Mouse models of Down syndrome as a tool to unravel the causes of mental disabilities. Neural Plast. 2012;2012:584071. doi: 10.1155/2012/584071. [DOI] [PMC free article] [PubMed] [Google Scholar]
- Salehi A, Delcroix J-D, Belichenko PV, et al. Increased App expression in a mouse model of Down's syndrome disrupts NGF transport and causes cholinergic neuron degeneration. Neuron. 2006;51:29–42. doi: 10.1016/j.neuron.2006.05.022. [DOI] [PubMed] [Google Scholar]
- Saran NG, Pletcher MT, Natale JE, et al. Global disruption of the cerebellar transcriptome in a Down syndrome mouse model. Hum Mol Genet. 2003;12:2013–2019. doi: 10.1093/hmg/ddg217. [DOI] [PubMed] [Google Scholar]
- Seo H, Isacson O. Abnormal APP, cholinergic and cognitive function in Ts65Dn Down's model mice. Exp Neurol. 2005;193:469–480. doi: 10.1016/j.expneurol.2004.11.017. [DOI] [PubMed] [Google Scholar]
- Skaper SD. The biology of neurotrophins, signalling pathways, and functional peptide mimetics of neurotrophins and their receptors. CNS Neurol Disord Drug Targets. 2008;7:46–62. doi: 10.2174/187152708783885174. [DOI] [PubMed] [Google Scholar]
- Stempler S, Ruppin E. Analyzing gene expression from whole tissue vs. different cell types reveals the central role of neurons in predicting severity of Alzheimer's disease. PLoS One. 2012;7:e45879. doi: 10.1371/journal.pone.0045879. [DOI] [PMC free article] [PubMed] [Google Scholar]
- Sturgeon X, Gardiner KJ. Transcript catalogs of human chromosome 21 and orthologous chimpanzee and mouse regions. Mamm Genome. 2011;22:261–271. doi: 10.1007/s00335-011-9321-y. [DOI] [PubMed] [Google Scholar]
- Tuszynski M. Growth-factor gene therapy for neurodegenerative disorders. Lancet Neurol. 2002;1:51–57. doi: 10.1016/s1474-4422(02)00006-6. [DOI] [PubMed] [Google Scholar]
- Tuszynski MH. Nerve growth factor gene therapy in Alzheimer disease. Alzheimer Dis Assoc Disord. 2007;21:179–189. doi: 10.1097/WAD.0b013e318068d6d2. [DOI] [PubMed] [Google Scholar]
- Velazquez R, Ash JA, Powers BE, et al. Maternal choline supplementation improves spatial learning and adult hippocampal neurogenesis in the Ts65Dn mouse model of Down syndrome. Neurobiol Dis. 2013;58:92–101. doi: 10.1016/j.nbd.2013.04.016. [DOI] [PMC free article] [PubMed] [Google Scholar]
- Wisniewski K, Wisniewski H, Wen G. Occurrence of neuropathological changes and dementia of Alzheimer's disease in Down's syndrome. Ann Neurol. 1985;17:278–282. doi: 10.1002/ana.410170310. [DOI] [PubMed] [Google Scholar]
- Yan J, Ginsberg SD, Powers B, Alldred MJ, Saltzman A, Strupp BJ, Caudill MA. Maternal choline supplementation programs greater activity of the phosphatidylethanolamine N-methyltransferase (PEMT) pathway in adult Ts65Dn trisomic mice. FASEB J. 2014 doi: 10.1096/fj.14-251736. in press. [DOI] [PMC free article] [PubMed] [Google Scholar]
Associated Data
This section collects any data citations, data availability statements, or supplementary materials included in this article.