

Abstract
G protein-coupled receptors (GPCRs) are well known to signal via cyclic AMP (cAMP) production at the plasma membrane, but it is now clear that various GPCRs also signal after internalization. Apart from its temporal impact through prolonging the cellular response, does the endosome-initiated signal encode any discrete spatial information? Using the beta2-adrenoceptor (β2-AR) as a model, we show that endocytosis is required for the full repertoire of downstream cAMP-dependent transcriptional control. Next, we describe an orthogonal optogenetic approach to definitively establish that the location of cAMP production is indeed the critical variable determining the transcriptional response. Finally, our results suggest that this spatial encoding scheme helps cells functionally discriminate chemically distinct β2-AR ligands according to differences in their ability to promote receptor endocytosis. These findings reveal a discrete principle for achieving cellular signalling specificity, based on endosome-mediated spatial encoding of intracellular second messenger production and ‘location aware’ downstream transcriptional control.
Introduction
Cyclic AMP (cAMP) is the prototypical ‘diffusible’ second messenger and a key mediator of downstream signal transduction initiated by many G protein–coupled receptors (GPCRs). In the classical model, ligand-induced activation of GPCRs on the plasma membrane couples through heterotrimeric G proteins to stimulation of adenylyl cyclase, resulting in production of cAMP that regulates downstream effectors. Ligand-activated receptors then undergo phosphorylation and engagement of arrestins, preventing functional coupling to G proteins and promoting receptor endocytosis via clathrin-coated vesicles and subsequent delivery to endosomes. It was traditionally thought that the endosome-associated receptor pool is functionally inactive with regard to canonical second messenger signalling, but it has become increasingly evident that GPCR-G protein activation and generation of cAMP can also be initiated from endosomes 1–4. Thus GPCR-cAMP signalling occurs in discrete spatiotemporal ‘waves’, first from the plasma membrane before receptors are internalized and then from endosomes after ligand-induced endocytosis 5. The temporal effects of this two-phase system of cellular signal initiation are clear, with the endosome-based phase extending or sustaining the cellular response 1,2. However, a major outstanding question raised by the discovery of endosome-based signalling is whether there is any functional significance to the spatial separation of cAMP production sites.
We addressed the role of spatial segregation of cAMP by focusing on the beta2-adrenoceptor (β2-AR), an extensively characterized GPCR that is known to stimulate G protein-linked cAMP production from the plasma membrane and endosomes 3. We profiled global changes in gene expression in response to β2-AR activation and found that inhibition of receptor internalization strongly diminished β2-AR-dependent transcriptional signalling. This signalling deficiency did not reflect secondary effects through receptor recycling, and could not be accounted for by endocytic effects on net cytoplasmic cAMP accumulation. Instead, the adequate initiation of transcriptional responses depended on the subcellular site of cAMP production. These results show that cells can discriminate the location of cAMP accumulation when initiating a response, and establish a functional role of endocytosis in GPCR signalling.
Results
Endocytosis promotes β2-AR-elicited transcription
We began by assessing the effects of endosome signalling on the integrated β2-AR response. To do so, we profiled receptor-mediated regulation of cellular gene expression for > 20,000 human genes, and asked if endocytosis is important for this response. HEK293 cells endogenously express β2-ARs at low levels, making them a useful model for studying signalling effects without potential complications of receptor over-expression 6. We examined the endogenous HEK293 β2-AR-cAMP response elicited by the β2-AR agonist isoproterenol at two agonist concentrations: 1 μM, a saturating concentration, and 10 nM, a sub-saturating concentration that is close to the EC50 for stimulating acute cAMP accumulation. Both concentrations of isoproterenol promoted significant β2-AR internalization (Supplementary Results, Supplementary Figure 1a). To examine cAMP production in response to agonist stimulation, we measured real-time accumulation of the second messenger with a previously described luminescence-based cAMP biosensor that localizes diffusely throughout the cytoplasm 3,7,8. While the net cAMP produced in response to 1 μM isoproterenol was greater than that to 10 nM agonist (Figure 1a–b, blue plots), microarray analysis revealed a similar gene expression response elicited by both concentrations of isoproterenol. This indicates that even sub-saturating concentrations of agonist produce net amounts of cAMP capable of triggering efficient transcriptional signalling. We identified a core set of 55 isoproterenol-responsive genes (Supplementary Table 1) that were consistently induced over 1.5-fold in response to both concentrations of isoproterenol. This set is strongly enriched for cAMP response element-binding protein (CREB) target genes 9 (30/55, p < 1.0×10⁻¹⁹ by hypergeometric test) and spans a diverse range of biological processes based on gene ontology (GO) analysis (Supplementary Table 2). To investigate whether endocytosis impacts the β2-AR-mediated transcriptional response, we first took a pharmacological approach using Dyngo, a chemical inhibitor of dynamin that blocks regulated endocytosis of β2-ARs acutely 3,10. Pre-treatment of cells with Dyngo for 15 min was sufficient to strongly (> 90%) and significantly (p = 4.0×10⁻⁴ by t-test) inhibit isoproterenol-induced internalization of β2-ARs (Supplementary Figure 1b). Dyngo had little effect on basal cAMP levels as quantified biochemically and no effect whatsoever on cAMP detection by the biosensor (Supplementary Figure 1c–d). However, it markedly reduced the magnitude of isoproterenol-induced cytoplasmic cAMP accumulation at both saturating (Figure 1a) and sub-saturating (Figure 1b) concentrations, confirming previous reports that endosome-localized receptors contribute to the overall cytoplasmic cAMP signal 3.
Figure 1. Endocytosis of β2-AR is required for cAMP accumulation and transcriptional response.

(a–b) Real-time cAMP levels were measured using the enzyme-based biosensor pGLO-20F (Promega) in response to bath application of (a) 1 μM or (b) 10 nM isoproterenol in cells pre-treated for 15 min with vehicle (DMSO) (blue) or 30 μM Dyngo (red). Data = average from n = 2–3 experiments. (c–e) Measurement by oligonucleotide microarrays of global gene expression in response to activation of β2-AR. Cells were pre-treated with either DMSO or Dyngo for 15 min as indicated. (c) Heat map showing the median-centered expression of core isoproterenol-responsive target genes (indicated on the y-axis; Supplementary Table 1) across all microarray experiments. (d–e) Scatter plots comparing expression levels for the target genes upon treatment of cells with (d) 1 μM or (e) 10 nM isoproterenol. Data = averaged log2 ratios (Iso/No Drug) from n = 2 experiments. In grey – isoproterenol targets, in red – endocytosis-dependent genes (Supplementary Table 3), dotted line has a slope of 1 (y = x). Arrows indicate RNA levels for PCK1 and DACT2. (f) Confirmation by qRT-PCR of PCK1 and DACT2 expression in response to block of receptor endocytosis. (g) Clathrin knockdown effects on β2-AR signalling in cells transfected with CHC17 or control siRNAs. RNA levels of PCK1 were analyzed by qRT-PCR. Data = averaged log2 ratios (Iso/No Drug) from n = 2 experiments. ND = no drug; Iso = isoproterenol. ** p < 0.005, * p < 0.05, p-values by unpaired t-test; error bars = ± s.e.m.
Remarkably, acute endocytic blockade produced a profound and widespread inhibition of the β2-AR-mediated transcriptional response (p < 1.6×10⁻⁹ by Wilcoxon signed rank test) and, for some genes, abolished the transcriptional response altogether (Figure 1c). We saw significant inhibition (by t-test, see Materials and Methods) of 30 and 23 genes of the 55 β2-AR-dependent targets in cells treated with saturating (Figure 1d) and sub-saturating (Figure 1e) concentrations of agonist, respectively (Supplementary Table 3). This did not reflect an off-target or general effect of Dyngo on gene transcription because, in parallel experiments, Dyngo did not interfere with basal gene expression levels or transcriptional signalling in the unfolded protein response (Supplementary Figure 1e–f). We validated the microarray results by qRT-PCR of two endocytosis-dependent β2-AR targets- phosphoenolpyruvate carboxykinase 1 (PCK1) and dapper antagonist of beta catenin, homolog 2 (DACT2). PCK1, a cAMP-regulated enzyme 11 that catalyzes the rate-limiting step of gluconeogenesis, was one of the most strongly isoproterenol-induced genes based on the microarray experiment. DACT2, which encodes a protein implicated in the control of Wnt and Nodal signalling 3,12,13, was detected at a lower level on the microarrays and was induced significantly but less strongly by isoproterenol. In full agreement with the microarray results, qRT-PCR analysis verified that endocytic blockade strongly (> 4-fold) inhibited isoproterenol-elicited induction of both genes (Figure 1f).
We independently corroborated that receptor endocytosis is required for β2-AR transcriptional signalling using a complementary genetic approach to inhibit receptor internalization by siRNA-mediated depletion of clathrin heavy chain (CHC17). Clathrin knockdown was confirmed biochemically by qRT-PCR (Supplementary Figure 1g) and its ability to inhibit β2-AR internalization was verified by fluorescence flow cytometry (Supplementary Figure 1h). Using expression of PCK1 RNA, the most robust cAMP-dependent target, as readout for the β2-AR-dependent transcriptional response, we observed that clathrin knockdown also reduced the induction of PCK1 at both 1 μM and 10 nM isoproterenol (Figure 1g), mirroring the effect of Dyngo. In fact, the inhibitory effect of clathrin knockdown was even more pronounced than that of Dyngo, as indicated by a nearly complete loss of the β2-AR-mediated induction of PCK1 at both isoproterenol concentrations.
Endocytosis affects the G protein-dependent β2-AR response
Endosome signalling by β2-ARs may also involve G protein-independent mechanism(s) such as β-arrestin-mediated activation of MAP kinases 14,15, but two lines of evidence indicate that many of the observed transcriptional responses are likely mediated by cAMP. First, we observed a significant enrichment of cAMP-response element (CRE)-containing genes among the endocytosis-sensitive β2-AR targets- 19 out of 30 (p < 1.0×10⁻¹⁶ by hypergeometric test) and 15 out of 23 (p < 1.0×10⁻¹³ by hypergeometric test) for 1 μM and 10 nM isoproterenol, respectively (Supplementary Table 3). Second, to investigate directly if our results reflect a cAMP-independent response, we chose six of the endocytosis-sensitive genes that were not previously annotated as CREB targets and asked if their expression is induced by receptor-independent activation of adenylyl cyclase by forskolin 16. Four of the six genes tested (AVPI1, RHOB, SLC2A3, and DACT2) were significantly up-regulated by forskolin treatment (Supplementary Figure 2). Based on this empirically determined validation rate, together with the other considerations summarized above, we anticipate that a significant number of the endocytosis-sensitive genes detected in our analysis are indeed induced through the traditional cAMP-dependent pathway.
In principle, the pronounced signalling effects of endocytic inhibition might represent a secondary consequence of preventing β2-AR trafficking through the recycling pathway, thereby inhibiting the process of functional re-sensitization of plasma membrane-delimited signalling after receptor phosphorylation and desensitization 17. To test this possibility, we used a pulse-chase protocol to uncouple temporally receptor endocytosis from sorting back to the membrane. β2-ARs enter the endocytic pathway within 1–2 min of agonist-induced activation 18 but subsequent β2-AR trafficking through the recycling pathway requires an additional ~8 min 19; by comparison, the endocytosis-dependent component of net cytoplasmic cAMP accumulation is evident within 5 min (Figure 1a–b). Therefore, we asked if exposing cells to isoproterenol only for 5 min might be sufficient to elicit an endocytosis-dependent gene expression response. This was indeed the case: A single 5 min pulse of isoproterenol was sufficient to elicit significant PCK1 induction. Remarkably, the transcriptional response initiated by this brief β2-AR activation, which effectively circumvents receptor recycling, was completely abolished by endocytic blockade with Dyngo (Figure 2a). As a second, independent approach to address the role of receptor recycling in transcriptional signalling, we acutely inhibited the recycling pathway with the vacuolar proton ATPase inhibitor Bafilomycin A1 (Baf) 4,20,21. Bafilomycin A1 did not fully block recycling but nevertheless significantly diminished receptor surface recovery (Figure 2b). Yet, this manipulation did not have any effect whatsoever on PCK1 transcriptional induction in response to agonist (Figure 2c). Taken together, these results suggest that receptor recycling and re-activation at the plasma membrane are not required for β2-AR-mediated gene induction, and that the transcriptional response likely emanates from the endosome-localized receptor pool.
Figure 2. The β2-AR transcriptional response does not require receptor recycling.
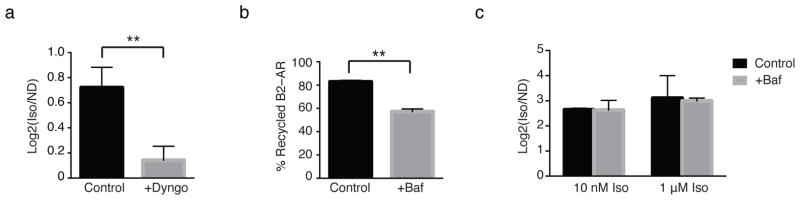
(a) Transcriptional activation of PCK1 was measured by qRT-PCR in response to a 5 min pulse of 1 μM isoproterenol and chase with 10 μM alprenolol in cells pre-treated with either 30 μM Dyngo or vehicle (DMSO). Data = average from n = 5. (b) Percent recycled FLAG epitope-tagged β2-AR measured by flow cytometry in cells pre-treated with 0.5 mM Bafilomycin A1 or vehicle (DMSO). Data = mean surface fluorescence from n = 2, 10,000–20,000 cells/condition, each time point in triplicate. (c) PCK1 expression measured by qRT-PCR in cells pre-treated with Bafilomycin A1 and incubated with indicated doses of isoproterenol for 2 hrs. Data are average of n = 2. Baf = Bafilomycin A1, Iso = isoproterenol, Alp = alprenolol, ND = no drug. ** p < 0.005 by unpaired t-test; error bars = ± s.e.m.
Direct demonstration of location-biased signalling
Further supporting the hypothesis that endosome-based β2-AR signalling is essential for transcriptional control we noted that, even though exposing cells to 1 μM isoproterenol in the presence of endocytic blockade produced a significantly higher overall cytoplasmic cAMP response than 10 nM isoproterenol in the absence of endocytic blockade (Figure 3a), induction of both PCK1 and DACT2 varied in the opposite direction (Figure 3b). Moreover, this trend held for the full repertoire of β2-AR-induced genes detected by our analysis (p = 1.1×10⁻⁹ by Wilcoxon signed rank test) (Figure 3c). Thus, the ability of endocytosis to promote transcriptional signalling correlates with the process of endocytosis itself, rather than with quantitatively increased overall levels of cytoplasmic cAMP accumulation. Accordingly, the results strongly suggest that cells discriminate the location of cAMP generation when initiating a signalling response.
Figure 3. Transcriptional signalling is not monotonically related to net cAMP levels.
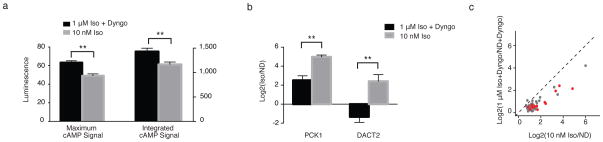
(a–c)B2-AR was activated by bath application of 10 nM or 1 μM isoproterenol in the presence of 30 μM Dyngo to block endocytosis. (a) Maximum and integrated cAMP signal was measured with the enzyme-based biosensor pGLO-20F (Promega). Data = mean from n = 2–3 experiments. (b–c) Transcriptional induction of (b) PCK1 and DACT2 or (c) isoproterenol target genes was determined by qRT-PCR or microarray analysis, respectively. In grey – isoproterenol targets, in red – endocytosis-dependent genes (Supplementary Table 3), dotted line has a slope of 1 (y = x). Data = averaged log2 ratios (Iso/No Drug) from n = 2 experiments for each condition. Iso = isoproterenol, ND = no drug ** p < 0.005 by unpaired t-test; error bars = ± s.e.m.
To test this hypothesis directly, we developed an optogenetic strategy based on bPAC, a bacteria-derived adenylyl cyclase that allows cAMP production to be acutely induced by light 22. We transfected bPAC into HEK293 cells and localized the expressed cyclase specifically to either the plasma membrane (“bPAC-PM”) or endosome limiting membrane (“bPAC-Endo”) using respective Lyn-derived 23 or Hrs-derived 24 targeting sequences. Lyn was chosen for plasma membrane targeting because it can partition into both raft and non-raft fractions 25. For comparison, we expressed the bPAC protein not fused to a targeting domain, which localizes diffusely throughout the cytoplasm (“bPAC-Cyto”). Protein expression (Supplementary Figure 3a) and appropriate subcellular localization (Figure 4a and Supplementary Figure 3b) from each construct were verified by microscopy. We adjusted bPAC transfection conditions to achieve comparable levels of acute cAMP accumulation in response to varying light doses driving bPAC activation (Figure 4b and Supplementary Figure 4a–b). We then monitored the transcriptional response by measuring induction of PCK1. As expected, activation of endogenous adenylyl cyclases in bPAC-transfected cells with 10 nM isoproterenol led to a robust increase in PCK1 levels across all samples (Supplementary Figure 4c). Light-induced activation of bPAC-PM did not lead to appreciable PCK1 induction, even at the highest dose of activation tested (5 min light pulse). In contrast, activation of the bPAC-Endo with a range of light doses (including those driving less overall cytoplasmic cAMP accumulation than bPAC-PM) produced clear induction of PCK1 expression (Figure 4c and Supplementary Figure 4d, compare green and red bars in each set). As expected, the bPAC-Endo-dependent transcriptional induction of PCK1 was unaffected by the endocytic inhibitor Dyngo (Supplementary Figure 4e). Interestingly, bPAC-Cyto also produced a clear transcriptional response at all activating doses tested (Figure 4c, blue bars), further supporting the spatial encoding model and indicating that cAMP generated from the plasma membrane is effectively uncoupled from downstream transcriptional control.
Figure 4. Localized cAMP production causes distinct transcriptional responses.

(a) bPAC constructs were targeted to the plasma membrane (“bPAC-PM”), endosomes (“bPAC-Endo”), or cytoplasm (“bPAC-Cyto”) and visualized by immunofluorescence microscopy with Alexa-conjugated anti-myc antibody in fixed HEK293 cells. Scale bar = 10 μm. (b) Maximum and integrated cAMP signal after bPAC activation was measured with the luminescence-based biosensor pGLO-22F (Promega). Data = mean from n = 4–5 experiments. (c) PCK1 expression was measured by qRT-PCR before (“No Light”) or after activation of bPACs (“Light”) with indicated doses of light. The PDE4-specific inhibitor rolipram (“Roli”) was added to final concentration of 10 μM to cells immediately prior to exposure to light. Data = average from n = 4–5 experiments. (d) Maximum and integrated cAMP signal after treatment of cells with 10 nM epinephrine (“Epi”) or 10 μM dopamine (“DA”) was measured with the luminescence-based biosensor pGLO-20F (Promega). Data = average from n = 3 experiments. (e) PCK1 expression measured by qRT-PCR after treatment with 10 nM epinephrine or 10 μM dopamine. Data = mean from n = 5–7 experiments. ** p < 0.005, * p < 0.05 by unpaired t-test; error bars = ± s.e.m.
To corroborate the transcriptional activation data, we also examined phosphorylation of CREB in cells expressing each bPAC construct. While stimulation of endogenous transmembrane cyclases with forskolin triggered robust CREB phosphorylation in all samples (Supplementary Figure 5a), optogenetic stimulation of only bPAC-Endo and bPAC-Cyto, but not of bPAC-PM, produced detectable activation of the transcription factor (Supplementary Figure 5b). Based on these results, it appears that cAMP generated at the plasma membrane from bPAC is relatively weakly coupled to CREB-dependent induction of gene expression, while comparable (and even lower) levels of cAMP produced elsewhere in the cytoplasm can efficiently trigger a transcriptional response. The bPAC results provide direct and independent support for the hypothesis that differences in transcriptional signalling depend on the subcellular location of cAMP generation.
Location bias contributes to agonist discrimination
Because chemically distinct agonists acting on the same GPCR can differ considerably in ability to promote regulated endocytosis of receptors, we wondered if cells might use the spatial encoding scheme for functional discrimination of agonists. To investigate this we focused on dopamine and epinephrine, two endogenously produced catecholamines that are present at comparable levels in human plasma 26 and differ structurally by a single hydroxyl group. Epinephrine is a potent β2-AR agonist that strongly stimulates receptor endocytosis, while dopamine is a weaker agonist that produces relatively little internalization even when applied at saturating concentration 27. Remarkably, even when respective agonist concentrations were carefully adjusted to produce closely similar levels of overall cAMP accumulation (Figure 4d), the transcriptional response elicited by epinephrine was significantly stronger (p = 2.2 × 10⁻² by t-test) (Figure 4e). Accordingly, the present results provide independent pharmacological support for the spatial encoding hypothesis, and suggest that spatial encoding by endosomal signalling can indeed function in agonist discrimination.
Discussion
The present findings reveal an essential consequence of endosome-based cAMP signalling in transducing the full repertoire of transcriptional responses elicited by activation of a prototypical GPCR. The classical dogma, based on GPCR-elicited cAMP production occurring only from the plasma membrane, accordingly assumes that downstream transcriptional control originates from the cell surface. Our findings re-define this dogma by showing that endocytosis is required for the full transcriptional response. In essence, endosomes function as flexible signal delivery vehicles that physically move, in response to receptor activation, the site of receptor-elicited cAMP production away from the plasma membrane and in proximity to the nucleus for efficient downstream control of CREB-dependent transcription.
The present results are limited to a relatively undifferentiated cell model and it will be interesting in future studies to investigate the signalling consequences of endocytosis in native systems and in more highly differentiated cells such as neurons, which extend cell processes remarkably far from the nucleus and package GPCRs into endosomes that are capable of both restricted and long-range motility 28. There is already evidence that endosomes support GPCR - cAMP generation in neurons 4, and endosome motility is important for a subset of growth factor-elicited signalling responses in this cell type 29,30. Another area for future study is the role of endosome-dependent signalling in mediating functional discrimination among chemically distinct GPCR ligands, and whether this might open a new door to understanding the clinically relevant phenomenon of functional selectivity or agonist bias 31. Finally, we note that beta-adrenoceptors are also capable of a low level of constitutive (ligand-independent) endocytosis, which appears to also be mediated by clathrin, and it will be interesting to investigate whether or not the constitutively internalized receptors contribute to transcriptional control.
More generally, our results are in line with emerging appreciation of the importance of spatial organization of cAMP signalling in discrete regions of the plasma membrane as well as cytoplasm through membrane compartmentation 32–36 and localized cAMP turnover 33,37. Indeed, we found that the PDE4 inhibitor rolipram rendered plasma membrane-localized adenylyl cyclase (bPAC-PM) capable of triggering a transcriptional response following brief optogenetic activation (Figure 4c, far right green bar). Thus the present results identify an essential cellular consequence of GPCR signalling from endosomes, and reveal a discrete spatial encoding scheme that determines functional selectivity of the downstream response. Because many GPCR signalling effects are mediated by second messenger control of downstream gene expression, we suggest that the present results have widespread physiological implications.
Online Methods
Cell culture and transfection
Human embryonic kidney (HEK293) cells were obtained from ATCC and grown in Dulbecco’s modified Eagle Medium supplemented with 10% fetal bovine serum (UCSF Cell Culture Facility, San Francisco, CA, USA). Stably transfected HEK293 cells expressing FLAG-tagged β2-AR were described previously 38. Synthetic RNA duplexes (CHC17, AllStars Negative Control) were obtained from the validated HP GenomeWide siRNA collection (Qiagen). For transient transfections, Lipofectamine 2000 or Lipofectamine-RNAiMax (Invitrogen) was used according to manufacturer’s instructions. Plasmids were transfected for 24–48 hrs. siRNAs were transfected for 72 hrs. Dyngo-4a (AbCam) was prepared as a 30 mM stock solution in DMSO and added to cells grown in serum-free medium to a final concentration of 30 μM for 15 min preceding drug treatment. Bafilomycin A1 (Tocris Biosciences) was added from a 1 mM stock in DMSO to a final concentration of 0.5 mM for 15 min. Rolipram (Tocris Biosciences) was added from a 10 mM stock in DMSO to a final concentration of 10 μM immediately prior to exposure to light.
bPAC cloning and activation
cDNA encoding a humanized photoactivatable adenylyl cyclase (bPAC) described in Stierl et al. 22 was obtained from Peter Hegemann’s laboratory through Addgene. The Hrs 2xFYVE sequence was amplified from eGFP-2xFYVE plasmid, a generous gift from Harald Stenmark (Oslo, Norway), and the Lyn sequence was amplified from LF2C plasmid obtained from Tobias Meyer’s laboratory through Addgene. Both targeting sequences were fused to the N terminus of cytosolic bPAC. All bPAC constructs were cloned into pcDNA3.1 Hygro (+) for mammalian expression. The cyclase was activated by illuminating cells inside a temperature- and CO2- controlled incubator for various times (0.5, 1, 2, 3, 4, or 5 min). Protein expression for each bPAC construct and CREB phosphorylation were quantified from immunofluorescence staining in ImageJ using the formula: Corrected Fluorescence = Integrated Density of Cell Area – (Cell Area x Mean Fluorescence of Background) 39.
Luminescence-based cAMP biosensors
Plasmids pGLO-20F and pGLO-22F (Promega) encoding circularly-permuted firefly luciferase cAMP reporters were transfected into HEK293 cells and assayed as described in Irannejad et al. 3. The pGLO-20F biosensor was used for all cAMP measurements except for bPAC-mediated cAMP accumulation assays. Because cAMP produced from bPACs at doses of light > 1 min saturated the pGLO-20F biosensor, we used the pGLO-22F biosensor, which has higher EC50 value for activation (Promega). For every experiment, reference wells were treated with 5 μM forskolin and all experimental cAMP measurements were normalized and displayed as percent of the maximum luminescence value measured in the presence of forskolin. “Maximum cAMP Signal” refers to the peak value from each forskolin-normalized cAMP experiment. “Integrated cAMP Signal” was calculated by numerical integration of the area under the respective cAMP curve.
DNA microarray sample preparation and processing
Human HEEBO microarrays printed on epoxysilane-coated glass (Schott Nexterion E) were purchased from the Stanford Functional Genomics Facility (Stanford, CA, USA) and processed according to standard protocols. HEK293 cells were grown in 6-well plates at ~90–100% confluency, washed once with serum-free medium, and re-suspended in serum-free medium. 30 μM Dyngo or DMSO was added for 15 min, followed by addition of isoproterenol for 2 hrs. Total RNA was isolated with RNeasy Mini Kit (Qiagen) and quantified by Nanodrop. 2–5 μg of total RNA was used as input for amplification with AminoAllyl MessageAmp aRNA kit (Ambion). Up to 5 μg of in vitro transcribed aRNA was then coupled to NHS-monoesters of either Cy5 (“Iso”) or Cy3 (“No Drug”) dyes (GE Healthcare Life Sciences). Cy5- and Cy3-labeled aRNA were combined in 3× SSC, 50 mM Hepes (pH 7.0), 20 μg of poly(A) RNA, 20 μg Cot-1 DNA, 20 μg tRNA, and 0.3% SDS to a total volume of 50 μL. Samples were then heated to 70°C for 5 min, spun at 14,000 rpm at room temperature in a microfuge for 5 min, then hybridized at 65°C using the MAUI hybridization system (BioMicro) for 12–16 hrs. After hybridization, microarrays were washed first in a solution of 2x SSC with 0.05% SDS at 70°C for 5 min, then in 2x SSC at room temperature for 2 min, then in 1x SSC at room temperature for 2 min, then 0.2x SSC at room temperature for 2 min, then dried by centrifugation. Microarrays were scanned using AxonScanner 4000B (Molecular Devices), and PMTs were manually adjusted for every slide scanned to maximize signal without saturation.
DNA microarray data analysis
Only genes with signal greater than 1.5 times the background in either Cy5 or Cy3 channel and median Cy5 or Cy3 signal greater than 100 were included for further analysis. Log2 ratios (“Iso”/”No Drug”) from each microarray were median-centered. Genes were classified as “Iso targets” (1) if their expression was induced by at least 1.5-fold by isoproterenol treatment in each of four replicates, and (2) if their averaged expression from all four isoproterenol-treated replicates showed at least a two-fold increase relative to untreated samples (i.e. Log2(“Iso”/”No Drug” ≥ 1). This analysis yielded 55 high-confidence β2-AR target genes (Supplementary Table 1). Enriched GO terms were identified with GeneTrail 40, using a cut-off hypergeometric p < 0.05 (corrected for multiple hypothesis testing). Wilcoxon signed rank test analysis revealed that the expression induction of all 55 β2-AR genes was affected by blockade of endocytosis with Dyngo at both saturating and sub-saturating doses of isoproterenol. We used a stringent cut-off based on statistical differences by unpaired t-test of Log2(“Dyngo+Iso”/”Dyngo+No Drug”) versus Log2(“DMSO+Iso”/”DMSO+No Drug”) with a p < 0.05 to define “Endocytosis-dependent” genes. Average linkage hierarchical clustering was performed using Euclidian distance as a similarity metric with the R software and visualized with Java TreeView 41.
Flow cytometry
For β2-AR internalization and recycling assays, we used stably transfected FLAG-β2-AR cells. For receptor internalization measurements, cells were treated with indicated doses of isoproterenol for 20 min. For receptor recycling measurements, cells were treated with isoproterenol for 20 min, washed once, and re-suspended in fresh medium containing 10 μM alprenolol for 40 min. Cells were lifted and labeled with Alexa647-M1 antibody (1:1,000). Flow cytometry of 10,000 cells per sample was carried out using a FACS-Calibur instrument (BD Biosciences). % Internalized receptors = (# Surface receptors after 20 min isoproterenol)/(Initial # surface receptors) * 100. % Recycled receptors = [(# Surface receptors 40 min after alprenolol - # surface receptors after 20min isoproterenol)/(Initial # surface receptors - # surface receptors after 20 min isoproterenol)] * 100. Statistical significance was established with unpaired t-test.
Quantitative real-time PCR
Total RNA was extracted from samples with RNeasy Mini Kit (Qiagen). Reverse transcription was carried out with SuperScript III RT (Invitrogen) and a mix of oligo(dT) and random nonamer primers following standard protocols. The resulting cDNA was used as input for quantitative PCR with StepOnePlus (ABI). Taqman Expression Mastermix (Invitrogen) and validated Taqman probe mix (Cat# 4331182, probe ID# Hs00915740_m1) were used for DACT2 expression measurements. SYBR Select MasterMix (Invitrogen) and primers described in Supplementary Table 4 were used in determining the expression of all other genes. Statistical significance was established with unpaired t-test. All levels were normalized to the levels of a housekeeping gene (ACTA or GAPDH).
Supplementary Material
Acknowledgments
We thank Patrick Brown for generously providing access to microarray facilities, Peter Hegemann, Harald Stenmark and Tobias Meyer for plasmids, Daniel Udwari and Thomas Oertner for initially suggesting use of bPAC, and Henry Bourne, Ben Cheyette, Roshanak Irannejad, Braden Lobingier, Aaron Marley and Daniel Riordan for valuable discussion. These studies were supported by the National Institute on Drug Abuse of the US National Institutes of Health (DA010711 and DA012864 to M.v.Z.). N.G.T. is supported by the American Heart Association.
Footnotes
Author Contributions
N.G.T. performed the experiments and analysed the data. N.G.T. and M.v.Z. designed the study, interpreted the results, and wrote the manuscript.
Competing financial interests
The authors declare no competing financial interests.
All microarray datasets were deposited on GEO under accession number GSE57274.
References
- 1.Calebiro D, et al. Persistent cAMP-signals triggered by internalized G-protein-coupled receptors. PLoS Biol. 2009;7 doi: 10.1371/journal.pbio.1000172. [DOI] [PMC free article] [PubMed] [Google Scholar]
- 2.Ferrandon S, et al. Sustained cyclic AMP production by parathyroid hormone receptor endocytosis. Nat Chem Biol. 2009;5:734–742. doi: 10.1038/nchembio.206. [DOI] [PMC free article] [PubMed] [Google Scholar]
- 3.Irannejad R, et al. Conformational biosensors reveal GPCR signalling from endosomes. Nature. 2013;495 doi: 10.1038/nature12000. [DOI] [PMC free article] [PubMed] [Google Scholar]
- 4.Kotowski SJ, Hopf FW, Seif T, Bonci A, von Zastrow M. Endocytosis promotes rapid dopaminergic signaling. Neuron. 2011;71 doi: 10.1016/j.neuron.2011.05.036. [DOI] [PMC free article] [PubMed] [Google Scholar]
- 5.Lohse MJ, Calebiro D. Cell biology: Receptor signals come in waves. Nature. 2013;495 doi: 10.1038/nature12086. [DOI] [PubMed] [Google Scholar]
- 6.Violin JD, et al. beta2-adrenergic receptor signaling and desensitization elucidated by quantitative modeling of real time cAMP dynamics. J Biol Chem. 2008;283 doi: 10.1074/jbc.M707009200. [DOI] [PubMed] [Google Scholar]
- 7.Fan F, et al. Novel genetically encoded biosensors using firefly luciferase. Acs Chem Biol. 2008;3:346–351. doi: 10.1021/cb8000414. [DOI] [PubMed] [Google Scholar]
- 8.Rajagopal S, et al. Quantifying ligand bias at seven-transmembrane receptors. Mol Pharmacol. 2011;80:367–377. doi: 10.1124/mol.111.072801. [DOI] [PMC free article] [PubMed] [Google Scholar]
- 9.Zhang X, et al. Genome-wide analysis of cAMP-response element binding protein occupancy, phosphorylation, and target gene activation in human tissues. Proc Natl Acad Sci U S A. 2005;102:4459–4464. doi: 10.1073/pnas.0501076102. [DOI] [PMC free article] [PubMed] [Google Scholar]
- 10.Harper CB, Popoff MR, McCluskey A, Robinson PJ, Meunier FA. Targeting membrane trafficking in infection prophylaxis: dynamin inhibitors. Trends Cell Biol. 2013;23:90–101. doi: 10.1016/j.tcb.2012.10.007. [DOI] [PubMed] [Google Scholar]
- 11.O’Brien RM, Printz RL, Halmi N, Tiesinga JJ, Granner DK. Structural and functional analysis of the human phosphoenolpyruvate carboxykinase gene promoter. Biochim Biophys Acta. 1995;1264:284–288. doi: 10.1016/0167-4781(95)00194-8. [DOI] [PubMed] [Google Scholar]
- 12.Waxman JS, Hocking AM, Stoick CL, Moon RT. Zebrafish Dapper1 and Dapper2 play distinct roles in Wnt-mediated developmental processes. Development. 2004;131:5909–5921. doi: 10.1242/dev.01520. [DOI] [PubMed] [Google Scholar]
- 13.Zhang L, et al. Zebrafish Dpr2 inhibits mesoderm induction by promoting degradation of nodal receptors. Science. 2004;306:114–117. doi: 10.1126/science.1100569. [DOI] [PubMed] [Google Scholar]
- 14.Daaka Y, et al. Essential role for G protein-coupled receptor endocytosis in the activation of mitogen-activated protein kinase. J Biol Chem. 1998;273:685–688. doi: 10.1074/jbc.273.2.685. [DOI] [PubMed] [Google Scholar]
- 15.Shenoy SK, et al. beta-arrestin-dependent, G protein-independent ERK1/2 activation by the beta2 adrenergic receptor. J Biol Chem. 2006;281:1261–1273. doi: 10.1074/jbc.M506576200. [DOI] [PubMed] [Google Scholar]
- 16.Seamon KB, Padgett W, Daly JW. Forskolin: unique diterpene activator of adenylate cyclase in membranes and in intact cells. Proc Natl Acad Sci U S A. 1981;78:3363–3367. doi: 10.1073/pnas.78.6.3363. [DOI] [PMC free article] [PubMed] [Google Scholar]
- 17.Pippig S, Andexinger S, Lohse MJ. Sequestration and recycling of beta 2-adrenergic receptors permit receptor resensitization. Mol Pharmacol. 1995;47:666–676. [PubMed] [Google Scholar]
- 18.Puthenveedu MA, von Zastrow M. Cargo regulates clathrin-coated pit dynamics. Cell. 2006;127:113–124. doi: 10.1016/j.cell.2006.08.035. [DOI] [PubMed] [Google Scholar]
- 19.Lauffer BE, et al. SNX27 mediates PDZ-directed sorting from endosomes to the plasma membrane. J Cell Biol. 2010;190:565–574. doi: 10.1083/jcb.201004060. [DOI] [PMC free article] [PubMed] [Google Scholar]
- 20.Johnson LS, Dunn KW, Pytowski B, McGraw TE. Endosome acidification and receptor trafficking: bafilomycin A1 slows receptor externalization by a mechanism involving the receptor’s internalization motif. Mol Biol Cell. 1993;4:1251–1266. doi: 10.1091/mbc.4.12.1251. [DOI] [PMC free article] [PubMed] [Google Scholar]
- 21.Presley JF, Mayor S, McGraw TE, Dunn KW, Maxfield FR. Bafilomycin A1 treatment retards transferrin receptor recycling more than bulk membrane recycling. J Biol Chem. 1997;272:13929–13936. doi: 10.1074/jbc.272.21.13929. [DOI] [PubMed] [Google Scholar]
- 22.Stierl M, et al. Light modulation of cellular cAMP by a small bacterial photoactivated adenylyl cyclase, bPAC, of the soil bacterium Beggiatoa. J Biol Chem. 2011;286:1181–1188. doi: 10.1074/jbc.M110.185496. [DOI] [PMC free article] [PubMed] [Google Scholar]
- 23.Kasahara K, et al. Trafficking of Lyn through the Golgi caveolin involves the charged residues on alphaE and alphaI helices in the kinase domain. J Cell Biol. 2004;165:641–652. doi: 10.1083/jcb.200403011. [DOI] [PMC free article] [PubMed] [Google Scholar]
- 24.Gillooly DJ, et al. Localization of phosphatidylinositol 3-phosphate in yeast and mammalian cells. Embo J. 2000;19:4577–4588. doi: 10.1093/emboj/19.17.4577. [DOI] [PMC free article] [PubMed] [Google Scholar]
- 25.Young RM, Holowka D, Baird B. A lipid raft environment enhances Lyn kinase activity by protecting the active site tyrosine from dephosphorylation. J Biol Chem. 2003;278:20746–20752. doi: 10.1074/jbc.M211402200. [DOI] [PubMed] [Google Scholar]
- 26.Goldstein DS, Eisenhofer G, Kopin IJ. Sources and significance of plasma levels of catechols and their metabolites in humans. J Pharmacol Exp Ther. 2003;305:800–811. doi: 10.1124/jpet.103.049270. [DOI] [PubMed] [Google Scholar]
- 27.Swaminath G, et al. Sequential binding of agonists to the beta2 adrenoceptor. Kinetic evidence for intermediate conformational states. J Biol Chem. 2004;279:686–691. doi: 10.1074/jbc.M310888200. [DOI] [PubMed] [Google Scholar]
- 28.Choy RW, et al. Retromer mediates a discrete route of local membrane delivery to dendrites. Neuron. 2014;82:55–62. doi: 10.1016/j.neuron.2014.02.018. [DOI] [PMC free article] [PubMed] [Google Scholar]
- 29.Cosker KE, Segal RA. Neuronal signaling through endocytosis. Cold Spring Harb Perspect Biol. 2014;6 doi: 10.1101/cshperspect.a020669. [DOI] [PMC free article] [PubMed] [Google Scholar]
- 30.Murphy JE, Padilla BE, Hasdemir B, Cottrell GS, Bunnett NW. Endosomes: a legitimate platform for the signaling train. Proc Natl Acad Sci U S A. 2009;106:17615–17622. doi: 10.1073/pnas.0906541106. [DOI] [PMC free article] [PubMed] [Google Scholar]
- 31.Galandrin S, Oligny-Longpre G, Bouvier M. The evasive nature of drug efficacy: implications for drug discovery. Trends Pharmacol Sci. 2007;28:423–430. doi: 10.1016/j.tips.2007.06.005. [DOI] [PubMed] [Google Scholar]
- 32.Taylor SS, Zhang P, Steichen JM, Keshwani MM, Kornev AP. PKA: lessons learned after twenty years. Biochim Biophys Acta. 2013;1834:1271–1278. doi: 10.1016/j.bbapap.2013.03.007. [DOI] [PMC free article] [PubMed] [Google Scholar]
- 33.Sample V, et al. Regulation of nuclear PKA revealed by spatiotemporal manipulation of cyclic AMP. Nat Chem Biol. 2012;8:375–382. doi: 10.1038/nchembio.799. [DOI] [PMC free article] [PubMed] [Google Scholar]
- 34.Pontier SM, et al. Cholesterol-dependent separation of the beta2-adrenergic receptor from its partners determines signaling efficacy: insight into nanoscale organization of signal transduction. J Biol Chem. 2008;283:24659–24672. doi: 10.1074/jbc.M800778200. [DOI] [PMC free article] [PubMed] [Google Scholar]
- 35.Perino A, Ghigo A, Scott JD, Hirsch E. Anchoring proteins as regulators of signaling pathways. Circ Res. 2012;111:482–492. doi: 10.1161/CIRCRESAHA.111.262899. [DOI] [PMC free article] [PubMed] [Google Scholar]
- 36.Ostrom RS, Bogard AS, Gros R, Feldman RD. Choreographing the adenylyl cyclase signalosome: sorting out the partners and the steps. Naunyn Schmiedebergs Arch Pharmacol. 2012;385:5–12. doi: 10.1007/s00210-011-0696-9. [DOI] [PubMed] [Google Scholar]
- 37.Kholodenko BN, Kolch W. Giving space to cell signaling. Cell. 2008;133:566–567. doi: 10.1016/j.cell.2008.04.033. [DOI] [PubMed] [Google Scholar]
- 38.Temkin P, et al. SNX27 mediates retromer tubule entry and endosome-to-plasma membrane trafficking of signalling receptors. Nat Cell Biol. 2011;13:715–721. doi: 10.1038/ncb2252. [DOI] [PMC free article] [PubMed] [Google Scholar]
- 39.Burgess A, et al. Loss of human Greatwall results in G2 arrest and multiple mitotic defects due to deregulation of the cyclin B-Cdc2/PP2A balance. Proc Natl Acad Sci U S A. 2010;107:12564–12569. doi: 10.1073/pnas.0914191107. [DOI] [PMC free article] [PubMed] [Google Scholar]
- 40.Backes C, et al. GeneTrail--advanced gene set enrichment analysis. Nucleic Acids Res. 2007;35:W186–192. doi: 10.1093/nar/gkm323. [DOI] [PMC free article] [PubMed] [Google Scholar]
- 41.Saldanha AJ. Java Treeview--extensible visualization of microarray data. Bioinformatics. 2004;20:3246–3248. doi: 10.1093/bioinformatics/bth349. [DOI] [PubMed] [Google Scholar]
Associated Data
This section collects any data citations, data availability statements, or supplementary materials included in this article.