Abstract
Purpose
The goal of this work was to detect disease-related microstructural changes to the liver using magnetic resonance imaging. Chronic liver disease can cause microstructural changes in the liver that reduce plasma access to the perisinusoidal space—the site of exchange between the blood plasma and the hepatic parenchyma. The reduced plasma access to the perisinusoidal space inhibits hepatic function and contributes to the ~30,000 chronic liver disease-related deaths per year.
Methods
The extracellular matrix-specific cationized ferritin magnetic resonance imaging probe was injected intravenously into healthy rats and a rat model of the chronic liver disease non-alcoholic steatohepatitis. Rats were subsequently imaged with -weighted magnetic resonance imaging.
Results
This work demonstrates that the binding of cationized ferritin to the perisinusoidal extracellular matrix is reduced by 55% in a rat model of non-alcoholic steatohepatitis compared to healthy controls. This reduced binding is detectable in vivo with magnetic resonance imaging. Immunofluorescence and electron microscopy indicated that the reduced binding is due to inhibited macromolecular access to the perisinusoidal space caused by non-alcoholic steatohepatitis-related microstructural changes.
Conclusions
The reduced accumulation of intravenously injected cationized ferritin may report on changes in macromolecular access to the liver parenchyma in chronic liver disease.
Keywords: chronic liver disease, molecular imaging, magnetic resonance imaging, NASH
Chronic liver disease accounts for ~30,000 deaths per year in the United States (1). Non-alcoholic steatohepatitis (NASH), an advanced and chronic form of non-alcoholic fatty liver disease, is associated with type 2 diabetes and obesity and affects ~6 million people in the United States (2). With increases in the incidence of type 2 diabetes and obesity, the number of people who will develop NASH is likely to rise. Left untreated, NASH may progress to cirrhosis. Several complications develop in the case of cirrhosis including hepatic encephalopathy, renal failure, and hepatocellular carcinoma (3). Microstructural changes due to the deposition of excess extracellular matrix (ECM) and the loss of endothelial fenestrations (4–8) reduce access of plasma molecules to the hepatic parenchyma and therefore reduce hepatic function (6,7). A robust method to detect these microstructural and functional changes to the liver would be an important diagnostic tool.
Here we demonstrate a magnetic resonance imaging (MRI) technique to detect changes in macromolecular access to the perisinusoidal space of the liver due to NASH. The perisinusoidal space (Disse’s space) is the major site of molecular exchange between the blood plasma and hepatocytes in the liver. It is situated beneath a layer of fenestrated endothelia that serve as a sieve, allowing passage of proteins and other plasma molecules into the perisinusoidal space while retaining cells in the hepatic sinusoid capillary space (9). Beneath the fenestrated endothelial layer, inside the perisinusoidal space, is a layer of ECM that is critical to normal hepatic structure and function: impacting cell migration, proliferation, differentiation, and gene expression (6,7,10). Chronic liver disease often leads to a thickening of this ECM and a loss of endothelial fenestrations (4–8) that ultimately reduce macromolecular access to the perisinusoidal space. This in turn leads to reduced plasma exchange with hepatocytes and altered hepatic function (6,7).
Rodent models are important for investigating the molecular and cellular mechanisms of non-alcoholic fatty liver disease. There are a large number of genetic and dietary models of non-alcoholic fatty liver disease, including the db/db and ob/ob genetic mouse models and high carbohydrate and high fat diets, though these specific genetic and dietary models often only result in steatosis (8). The methionine-choline deficient (MCD) dietary model results in rodents developing hepatic changes that closely resemble those of NASH in humans. These changes include steatosis, focal inflammation, fibrosis, and necrosis of hepatocytes (11–13). Furthermore, it has been suggested that this model may also exhibit loss of endothelial fenestrations (14).
Typically, NASH is differentiated from non-alcoholic fatty liver disease by biopsy. However, due to the diffuse nature of liver fibrosis, diagnoses based on liver biopsy can be subject to sampling errors (15,16). Biopsy may also cause pain and major complications (17). Recently, imaging techniques have been developed to assess the extent of liver fibrosis throughout the entire organ using ultrasound elastography (18). This method detects viscoelastic changes that occur during the development of fibrosis (19,20). MRI also shows promise in detecting liver disease because it is non-invasive, three dimensional, high resolution, and provides excellent soft-tissue contrast. Magnetic resonance elastography techniques have been developed based on applying mechanical waves to measure tissue stiffness (21–23). Current magnetic resonance elastography techniques are noninvasive and practical to detect gross changes in liver structure. Nonetheless, there remains a strong need to distinguish focal changes to microstructure and function that develop due to chronic liver disease.
A potential strategy to detect structural and functional changes in the liver due to steatohepatitis is to develop a MRI contrast agent that specifically targets the perisinusoidal ECM of the liver. Targeted MRI contrast agents have been developed to detect molecules and cells throughout the body (24–26). Iron oxide nanoparticles of ~10–50 nm are one type of contrast agent that creates a detectable change in the MRI signal. Ferritin, a 13 nm protein-based iron oxide nanoparticle, has been proposed as a useful natural nanoparticle contrast agent because of its uniform size, biocompatibility, and ease of functionalization in both natural and modified states (27–29). Because the ferritin nanoparticle has an iron oxide core, its accumulation creates a darkening in the MR image that can be detected using -weighted MRI. Ferritin may be detected by MRI in several forms, including the native form (28) or in a modified form with a core of high metal content (27,29,30). Here we use the native form of ferritin, cationized by the addition of surface amine groups. It was previously shown that the ECM in the kidney glomerulus may be imaged using MRI after the intravenous injection of a cationized ferritin (CF) (31–34). This technique is based on the passage of CF through the endothelial fenestrations of the glomerular capillary wall and subsequent electrostatic binding of CF to the anionic proteoglycans of the ECM. Intravenous CF is also non-toxic at MRI-detectable doses (35).
Here, we investigate the use of CF to detect the perisi-nusoidal ECM in healthy rats and in a rat model of NASH. Using CF and MRI we will investigate whether macromolecular access to the perisinusoidal space is reduced in a rat model of NASH.
METHODS
Synthesis of Cationic Ferritin
CF was synthesized from native horse spleen ferritin per Danon et al. (34). 1-Ethyl-3(3-dimethyl-aminopropyl) car-bodiimide hydrochloride was used to conjugate commercial horse spleen ferritin (Sigma-Aldrich, Saint Louis, MO) to N,N-dimethyl-1,3-propanediamine. This was accomplished by first adjusting a 2 M solution of N,N-dimethyl-1,3-propanediamine to a pH of 6 using 2 N and 0.2 N HCl and NaOH. Once a pH of 6 was achieved, 0.5 mL of 55 mg/mL horse spleen ferritin was added to the solution, followed by 200 mg of 1-ethyl-3 (3-dimethyl-aminopropyl) carbodiimide hydrochloride. The pH of the solution was monitored for 2 h after addition of 1-ethyl-3(3-dimethyl-aminopropyl) carbodiimide hydrochloride to ensure the pH remained at 6. The solution was left covered at room temperature for 12 h. The CF solution was dialyzed two times against 3.5 L of phosphate buffered saline (PBS) at a pH of 7.3 and 4° C for 12–24 h for each pass. The CF solution was stored at 4° C. CF and native ferritin (NF) each have an iron oxide core, a per particle T2 relaxivity of ~2455 mM−1 s−1, and a per iron T2 relaxivity of ~4 mM−1 s−1 (30).
Animal Preparation
A total of 30 male Sprague-Dawley rats were used in this study. All animal protocols were approved by the Arizona State University Institutional Animal Care and Use Committee and performed in accordance with the NIH guide for the care and use of laboratory animals. The 30 animals were split into two groups—the first (12) to study CF-labeling of the perisinusoidal ECM in healthy animals, and the second (18) to study the use of CF and MRI in a rat model of NASH. All injections were performed while the animals were anesthetized with a 5% isoflurane mixture in oxygen. A total CF dose of 5.75 mg/100 g was given in three bolus doses (~0.5 mL per dose) spaced 1.5 h apart.
The first group, consisting of 12 healthy rats weighing 293 ± 13 g, was used to demonstrate the labeling of the perisinusoidal ECM by CF in healthy rats administered intravenous bolus doses of CF. A group of three rats administered CF was compared to a group of three rats administered an equivalent dose of NF and to a group of three naive rats receiving no contrast agent. The rats were imaged with MRI in vivo and then sacrificed via transcardial perfusion of PBS and formalin 1.5 h after the last injection. Livers were resected and prepared for ex vivo MRI, histology, and transmission electron microscopy (TEM). The final three rats were prepared in the same way and perfused 2 days, 4 days, and 7 days after injection to observe the distribution of CF in the liver over time. TEM, MRI, and histology are detailed below.
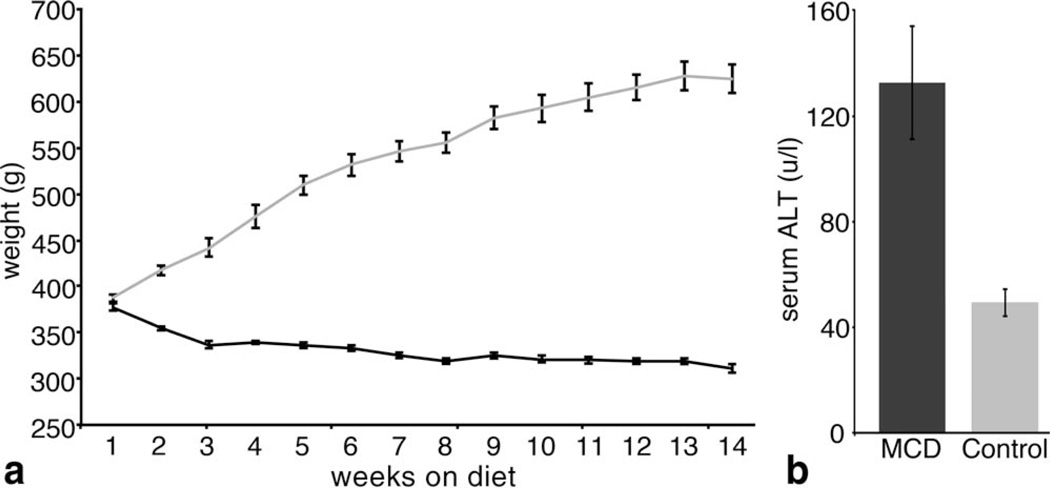
The second group, consisting of 18 rats, was used to study the use of CF in a rat model of NASH. Nine rats were fed a methionine choline deficient (MCD) diet (11–14) and nine were fed a control diet of the same composition supplemented with methionine and choline. All rats were weighed weekly, as animals on an MCD diet tend to lose weight (Fig. 4). Serum alanine transaminase (ALT) was measured by photometric absorbance (Charles River Laboratories, Wilmington, MA) in six of the rats that were fed the MCD diet and six of the rats fed the control diet to determine disease maturity. All experiments took place after serum ALT in MCD-fed animals were approximately three times the serum ALT of animals that fed the control diet (12). This occurred 14 weeks after starting the special diet. Six MCD fed rats and six control diet fed rats were imaged in vivo with MRI before and after injection of CF and sacrificed by transcardial perfusion of PBS and 10% neutral buffer formalin immediately after the post-injection MRI. Livers were resected and prepared for ex vivo MRI, histology, and TEM. The remaining three MCD fed rats and two control diet fed rats remained naive and were sacrificed by transcardial perfusion without being injected with CF. Livers from these animals were resected and prepared for ex vivo MRI, histology, and TEM. One sample from the un-injected control group was removed due to failure to properly perfuse the animal. MRI, histology, and TEM are detailed below.
FIG. 4.
Rats fed with a MCD diet begin to lose weight as soon as one week after the start of the diet (a). ALT values in rats fed with the MCD diet were significantly higher (α = 0.05) than those from rats fed with the control diet, indicating that NASH had been established in rats fed with the MCD diet (b). n = 6 rats per group. Error bars equal ± the standard error of the mean.
In Vivo MRI
For in vivo MRI, rats were prepared as described above. About 1.5 h after the final injection of CF, rats were anesthetized with a 5% isoflurane mixture in oxygen by nose cone and imaged at 7 T on a Bruker 7 T/35 scanner (Bruker, Billerica, MA) using a 72-mm quadrature transmit/receive radio frequency coil (Bruker). A series of axial -weighted 2D–gradient echo fast low angle shot (FLASH) sequences were acquired using a flip angle of 30°. Five different echo time (TE) values were used (4, 5, 6, 7, and 8 ms). A repetition time (TR) of 60 ms was used for each scan. In vivo images were collected with a resolution of 234 × 234 × 1000 µm (field of view = 6 × 6 cm, matrix size = 256 × 256, scan time = 4 min 36 s). maps were calculated using the series of FLASH images (data analysis described below). Twenty-four averages were collected for each scan to improve SNR and reduce motion artifacts (the total scan time was 4 min 36 s per scan).
Ex Vivo MRI
Perfused, excised livers were imaged on a Bruker 7T/35 scanner and a 72-mm rat volume transmit coil and a rat brain surface coil (Bruker). A high resolution 70 × 70 × 1000 µm (field of view = 2.1 × 2.1 cm, matrix size = 300 × 300) -weighted 2D–gradient echo FLASH sequence was collected on each liver with a TE/TR = 15/23 ms and a flip angle of 30 (100 averages, scan time = 8 min 36 s). The TE/TR used to image the perfused, fixed livers ex vivo is different than that used to image livers in vivo because the presence of blood in vivo shortens . To measure , a 2D multi-gradient echo sequence was used to collect 26 images with 26 evenly spaced echoes times between 2.48 ms and 42.54 ms. A TR of 1000 ms was used with the multi-gradient echo sequence along with a flip angle of 30° and a resolution of 280 × 280 × 1000 µm (field of view = 2.1 × 2.1 cm, matrix size = 75 × 75, no averaging, scan time = 57 s). maps were calculated from 26 gradient echo images (data analysis described below).
Immunofluorescence
Immunofluorescence (IF) confocal microscopy was performed on excised livers to determine the distribution of injected CF. Tissue fixed for IF was bathed in 15% sucrose overnight followed by 3 days in 30% sucrose. Sucrose-infiltrated tissue was rapidly frozen to − 80° C in optimal cutting temperature compound. Embedded tissue was sectioned at 35 µm at − 20°C in a cryostat (Leica Microsystems CM3050 S, Buffalo Grove, IL). Sections were washed three times in PBS, permeabilized with 0.3% triton, and blocked in Image-iT FX signal enhancer (Invitrogen, Carlsbad, CA) and goat serum for 1 h each. Sections were then incubated overnight at 4° C in chicken anti-fibronectin (1:400) and rabbit anti-horse spleen ferritin (1:500) primary antibodies (Invitrogen). Sections were then washed and incubated at room temperature for 2 h in Alexa488 goat anti-chicken and Alexa594 goat anti-rabbit secondary antibodies (Invitrogen). Nuclei were stained with 4’,6-diamidino-2-phenylindole (DAPI) for 15 min and sections were washed three times in PBS. Sections were mounted on slides with Prolong Gold anti-fade reagent (Invitrogen). The slides were imaged with a Zeiss 710 laser scanning confocal microscope.
Transmission Electron Microscopy
Pieces of liver tissue ~1 mm3 were collected from CF-injected and MCD-fed naive rats and the control diets. The specimens were placed in a 2% glutaraldehyde/ 0.1 M cacodylate solution. Tissue was dehydrated with a series of ethanol mixtures ranging from 70% to 100% and infiltrated with and embedded in epoxy resin. Sections were cut at a thickness of 70 nm and lightly stained with 0.2% osmium tetroxide in 0.1 M cacodylate buffer for 2 h. Osmium tetroxide precipitates were removed via a 12-min digestion with 1% periodic acid. Images were acquired on a Phillips CM12 transmission electron microscope.
Inductively Coupled Plasma Optical Emission Spectroscopy
Approximately, 1 g of liver tissue from each of the 18 rats in the NASH model study was digested in 9 mL nitric acid + 1 mL hydrochloric acid. After 15 min of pre-digestion at room temperature in the acid solution, the samples were fully digested by microwave heating to 200° C at 400 W (CEM corporation, Matthews, NC). Once completely digested, the iron content of each liver was measured using Inductively Coupled Plasma Optical Emission Spectroscopy (ICP-OES) (Thermo Scientific, Waltham, MA).
Data Analysis
In vivo values were calculated from the five -weighted FLASH gradient echo images (see section “In vivo MRI”) using MATLAB (The Mathworks, Inc. Natick, MA). Ex vivo values were calculated from the 26 gradient echo images of the multi-gradient echo sequence. Because ex vivo values obtained using the multi-gradient echo sequence are the same as those obtained from a series of ex vivo FLASH images (data not shown), a multi-gradient echo sequence was used ex vivo to collect more echoes and reduce scan total scan time across the entire ex vivo sample set. values were calculated from the image series by fitting the each voxel magnitude value at each TE to the equation S(t) = Soe−t/T2*, where S(t) is the voxel signal magnitude value at the given TE, S0 is the extrapolated signal magnitude value at TE = 0 ms, and t = TE.
Average signal magnitude and values were obtained by manually segmenting the livers from the MRI images or maps and averaging the remaining voxels. Average liver signal magnitude was compared across animals my normalizing to the signal magnitude of the muscle surrounding the spine in the same image (a circular region of interest was manually drawn to obtain the signal magnitude value of the muscle). histograms were produced from the segmented maps and intra-sample voxels were binned by their value.
Statistical analyses were run in MATLAB as two-sample, two-tailed Student’s t-tests to test the null hypothesis that the mean difference between groups is zero (α = 0.05). All values in the text are represented as the inter-sample mean ± the standard mean error.
RESULTS
Intravenous CF Labels the Healthy Perisinusoidal ECM and is Detected with MRI
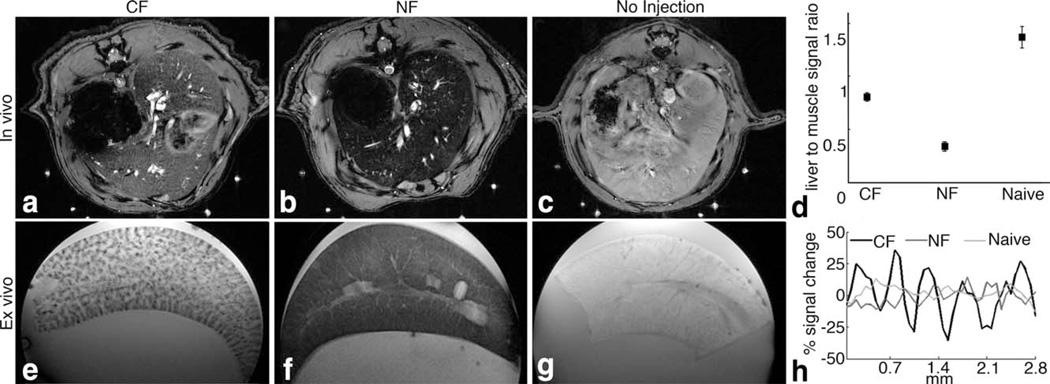
We first investigated whether intravenous CF can be used to detect the perisinusoidal space in the liver using MRI. We injected CF into healthy Sprague-Dawley rats. For comparison, we also injected healthy rats with NF and used a group of naive, un-injected rats as negative controls (n = 3 per group). We imaged rats in vivo 1.5 h after injection on a Bruker 7 T MRI scanner using a gradient-echo pulse sequence. In the resulting MR images (Fig. 1a – c), we observed dark striations throughout the livers of CF-injected rats, consistent with the distribution of hepatic sinusoids in the liver. The livers of NF-injected rats appeared dark in the images, and livers from naive controls were bright. The average normalized MRI signal magnitudes in livers from CF- and NF-injected rats and naive control rats were all significantly different (α = 0.05, Fig. 1d). These in vivo results suggest that CF uniquely labels the liver and that the labeling is detectable in vivo using MRI.
FIG. 1.
CF-labeling of the ECM of the hepatic sinusoid is detectable using MRI. In vivo with MRI (a–c) revealed detectable differences in contrast between rats injected with CF (a), NF (b), and naive control animals (c). Image signal magnitude in the liver was normalized to surrounding muscle (d). The differences in average normalized signal magnitude were statistically significant between all groups (α = 0.05). Ex vivo MRI (e–g) revealed dark striations in CF-labeled livers (e). Livers of NF-inoculated rats show diffuse signal darkening throughout the entire liver (f) whereas those of naive rats were bright (g). Striations in the images of CF-labeled liver are consistent with the distribution of hepatic sinusoids. Line profiles in images of the ex vivo livers show discernible MRI signal decrease in the hepatic sinusoid of CF-labeled livers as compared to NF and unlabeled control livers (h). n = 6 per group. Error bars equal ± the standard error of the mean.
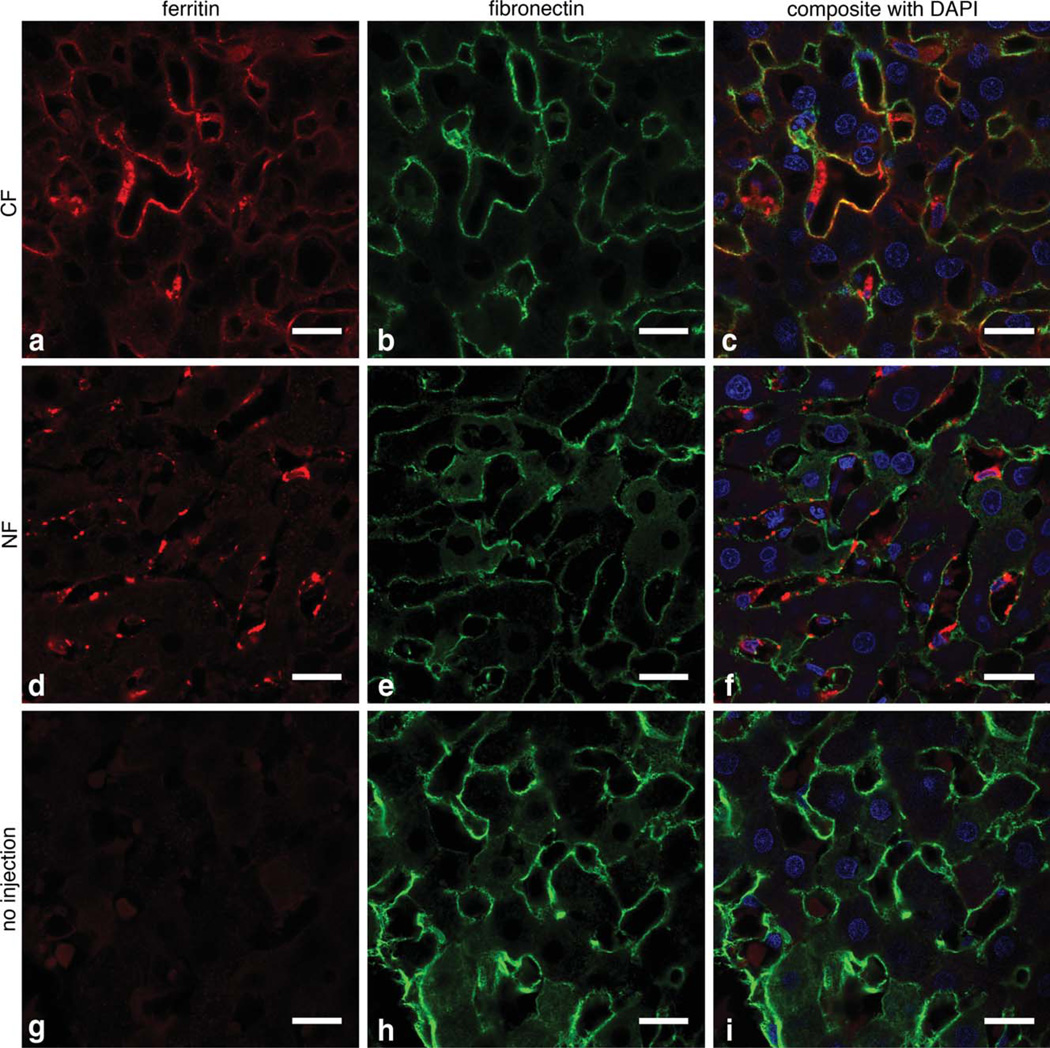
We used ex vivo MRI of the perfused, excised livers to further explore the differences in labeling between the CF-injected, NF-injected, and naive rats (Fig. 1e – g). Dark striations were visible with ex vivo MRI in CF-inoculated livers, consistent with in vivo MRI. No striations were visible in livers from NF-injected or naive control rats. Line profiles through the images (Fig. 1h) revealed an ~50% difference in signal magnitude between hepatic sinusoids and liver parenchyma in livers from rats injected with CF. We used IF and TEM to confirm the MRI results and to determine the location of injected CF in the liver. In IF (Fig. 2a – c), CF (red) was co-localized with fibronectin (green), suggesting that CF was bound to the ECM. Little ferritin-related fluorescence was seen in the livers of naive rats (Fig. 2g – i). In TEM, CF was also observed in the perisinusoidal space (Fig. 8e). NF was mostly found in Kupffer’s cells and endothelial cells of the hepatic sinusoid (Fig. 2d – f). Taken together, our IF and TEM results thus confirmed that CF accumulated in the perisinusoidal space of the liver.
FIG. 2.
CF labels the perisinusoidal ECM 1.5 h after intravenous injection, as shown in 63 × IF imaging. a–c: Show that CF (red) and fi-bronectin (green) are co-localized, consistent with ECM labeling with CF. No co-localization of NF with fibronectin is observed (d–f); instead NF appears to be taken up into macrophages and endothelial cells. Minimal ferritin IF was observed in the unlabeled control liver (g–i). Scale bar = 20 µm, cell nuclei are stained with 4’,6-diamidino-2-phenylindole (blue).
FIG. 8.
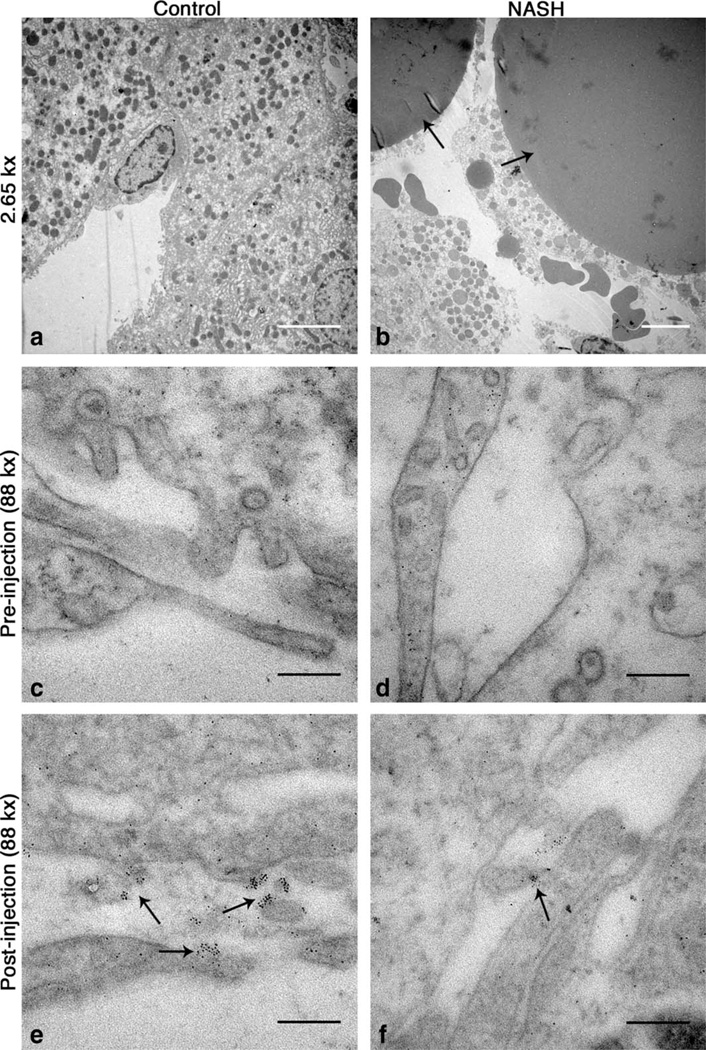
CF is localized to the perisinusoidal space in control and MCD-fed rats (e,f). The perisinusoidal space of naive rats is clear of CF (c,d). Wide (~150 nm) endothelial fenestrations are visible in livers from rats fed the control diet (e) while endothelia appear abutted in livers from rats fed the MCD diet (f). 2.65 kx transmission electron microscopy images show large lipid droplets inside of hepatocytes in livers from rats fed with the MCD diet (b). No such droplets were seen in livers from rats fed with the control diet (a). White scale bars = 5 mm, black scale bars = 200 nm.
To better understand the timing of CF uptake in the liver, we performed ex vivo MRI on livers that were perfused, fixed, and excised 1.5 h, 2, 4, and 7 days after CF-injection. -weighted MRI images revealed that the dark striations due to the accumulation of CF are apparent after 1.5 h injection (Fig. 3a) but become diffuse throughout the liver 2 and 4 days after CF-injection (Fig. 3b,c). CF was no longer detectable in the liver after 7 days (Fig. 3d). We also performed IF microscopy on livers perfused and fixed 1.5 and 3 h after CF-injection. IF shows that CF was taken into hepatocytes, Kupffer’s cells, and endothelia by 3 h after injection (Fig. 3e,f). These data suggest that labeling of the perisinusoidal ECM is transient and most evident with MRI 1.5 h after injection of CF. Furthermore, CF appears to be cleared from the liver within 7 days.
FIG. 3.
Specific, transient labeling of the perisinusoidal ECM. CF is moved into the liver parenchyma 3 h after injection and is cleared from the liver by one week after injection. IF imaging of the liver from a healthy rat sacrificed 1.5 CF injection (e) shows that CF (red) is specifically labeled to the ECM (green). IF of the liver from a healthy rat sacrificed 3 h after injection shows that CF has been internalized into hepatocytes, Kupffer’s cells, and endothelia (f). Cell nuclei are stained with 4’,6-diamidino-2-phenylindole and fluoresce blue. Scale bar = 20 mm. -weighted MRI 1.5 h after injection reveals a spatial pattern of CF-accumulation consistent with the distribution of hepatic sinusoids. CF distribution, observed with MRI, appears diffuse throughout the liver parenchyma at 2 days and 4 days after injection (a–c). CF is no longer detectable in the liver 7 days after injection (d).
Perisinusoidal Labeling of the ECM by CF Decreases with Steatohepatitis
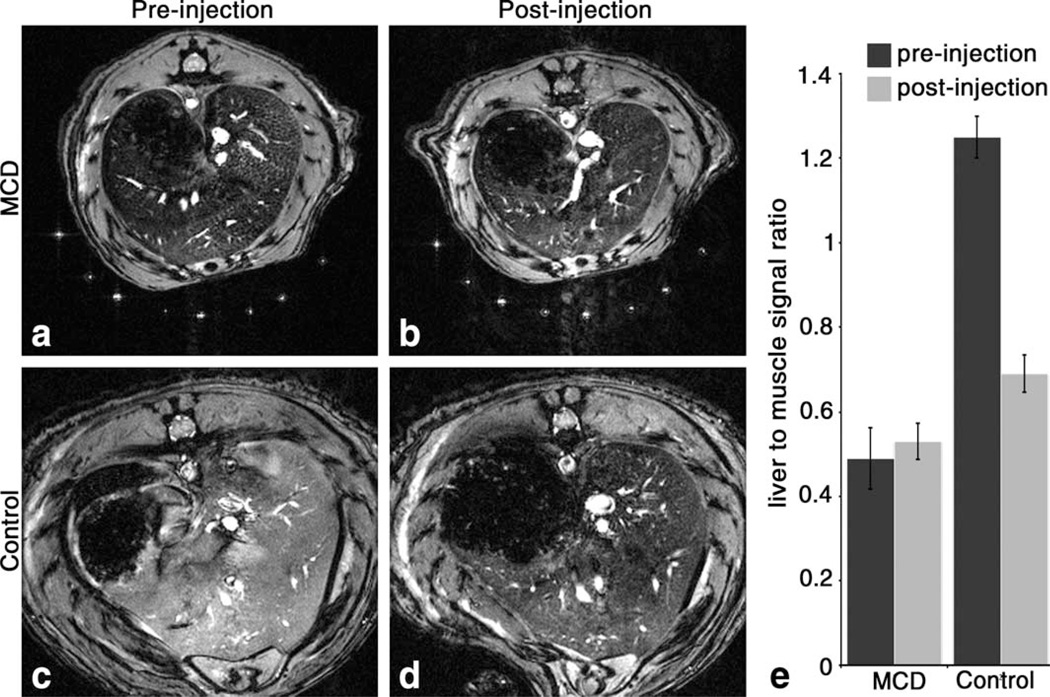
We performed experiments to establish whether CF-accu-mulation in the perisinusoidal space is altered by the development of NASH in a rat model. Rats were fed a MCD diet, which has been shown to precipitate NASH-like symptoms (11–14). The rats began to lose weight as soon as one week after the start of the MCD diet (Fig. 4a) but showed no other signs of disease. Serum ALT measurements indicated that the dietary NASH model was established by 14 weeks in rats fed with the MCD diet (Fig. 4b). At this point, MCD-fed and control rats were imaged in vivo with MRI before and after injection of CF. Before CF injection, the livers of rats fed with the MCD diet had decreased MRI signal magnitude compared to controls (Fig. 5a – d), indicating a decrease in with the development of NASH. Importantly, the average in vivo signal magnitude (Fig. 5e) of the livers of rats fed with the MCD diet did not darken after CF administration (α = 0.05).
FIG. 5.
Reduced CF-labeling of the perisinusoidal ECM of the liver is detectable in vivo in the rat model of NASH using -weighted MRI. In vivo MRI shows darkening in the images of MCD liver tissue before injection of CF compared to naive control (a and c). Signal magnitude did not change in liver tissue of MCD rats after injection of CF (b), while substantial darkening of liver tissue occurred in control rats after CF injection (d). To quantify the group differences, the liver signal was compared to surrounding muscle (e). Liver to muscle signal ratios from MRIs of pre- and post-injection control rats are statistically different, but pre- and post-injection ratios from rats fed with the MCD diet are not (α = 0.05). n = 6 for each group. Error bars equal ± the standard error of the mean.
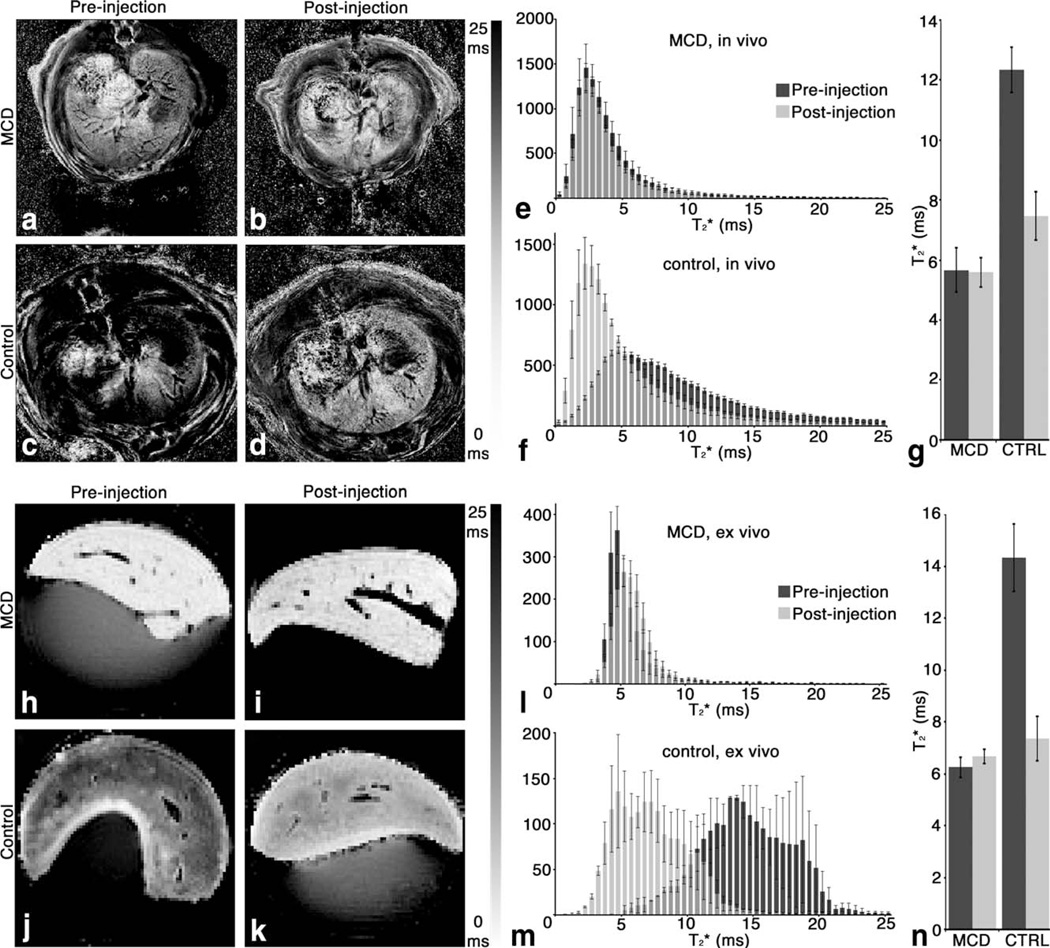
The in vivo MRI signal magnitude differences were consistent with in vivo liver measurements (Fig. 6a – d). Histograms (Fig. 6e,f) showed a broad shift in in control rats after the injection of CF. No such shift was seen in MCD-fed rats. The average in vivo (Fig. 6g) in rats fed with the MCD diet was 5.7 ± 0.7 ms before injection of CF and 5.6 ± 0.5 ms after injection, which was not significantly different (α = 0.05). The average in vivo in control rats was 12.3 ± 0.8 ms before injection of CF and 7.5 ± 0.8 ms after injection. There was a significant decrease (~40%, α = 0.05) in of age-matched healthy rats after CF-injection.
FIG. 6.
Reduced CF-labeling of the perisinusoidal ECM of the liver in the rat model of NASH is detectable in vivo and ex vivo by generating maps of measured (a–d, h–k). Histograms (e, f and l,m) of in the entire liver show a broad shift in in control rats after injection of CF, both in vivo and ex vivo. No such shift was seen in MCD-fed rats. A significant (α = 0.05) reduction in average in vivo and ex vivo (g, n) was observed after CF injection in livers from rats fed the control diet. did not change significantly after CF injection in livers from rats fed with the MCD diet. n = 6 per group for in vivo measurements. n = 2 for the ex vivo pre-injection control group. n = 3 for the ex vivo pre-injection MCD-fed group. n = 6 for both ex vivo post-injection groups. Error bars equal ± the standard error of the mean.
The in vivo MRI results were confirmed by our ex vivo liver measurements (Fig. 6h – k). Histograms (Fig. 6l,m) of in the entire liver confirmed a decrease in in control rats after injection of CF. No such decrease was observed in MCD-fed rats. The average ex vivo (Fig. 6n) in rats fed with the MCD diet was 6.3 ± 0.4 ms before injection of CF and 6.7 ± 0.3 ms after injection, which was not significantly different (α = 0.05). The average ex vivo in control rats was 14.3 ± 1.3 ms before injection of CF and 7.3 ± 0.9 ms after injection. There was a significant decrease (~50%, α = 0.05) in of healthy rat livers after CF-injection in ex vivo MRI.
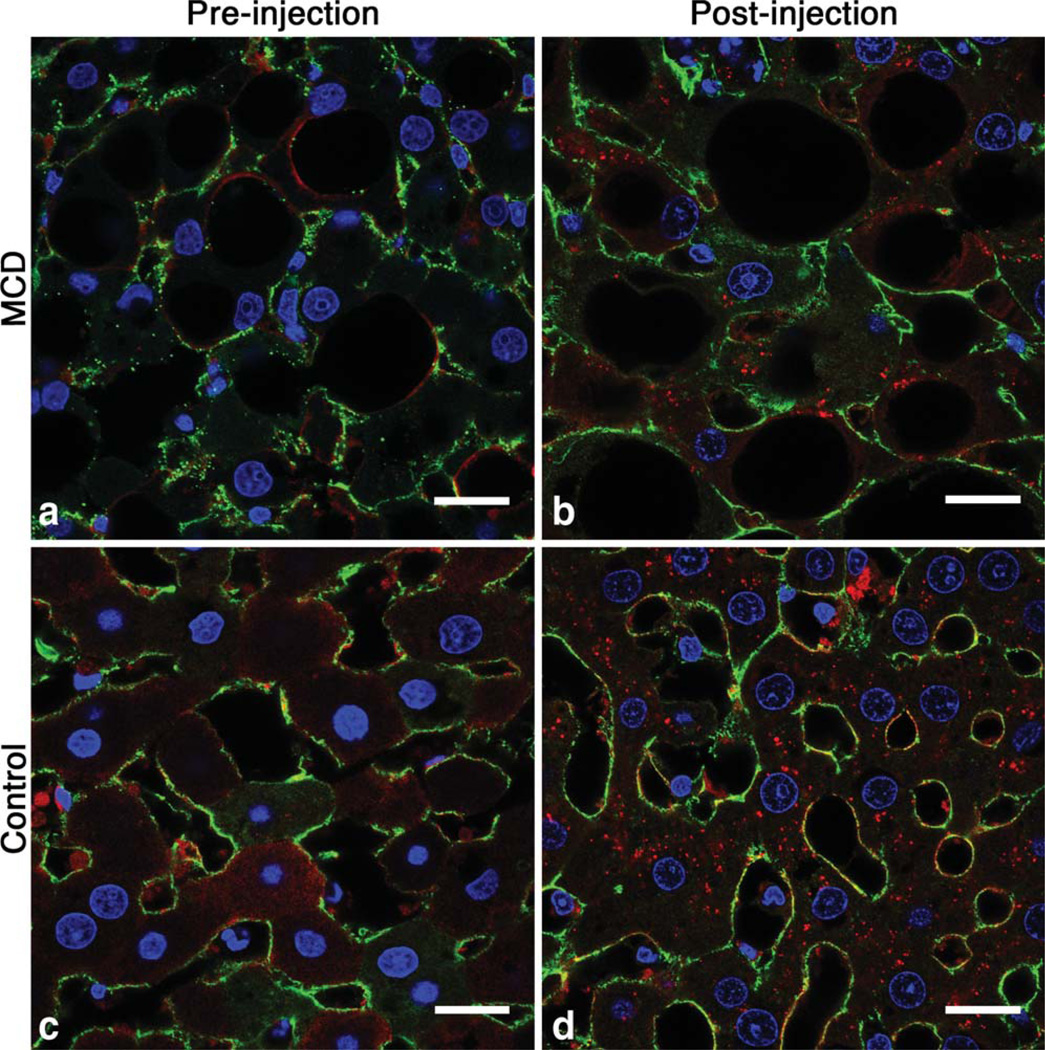
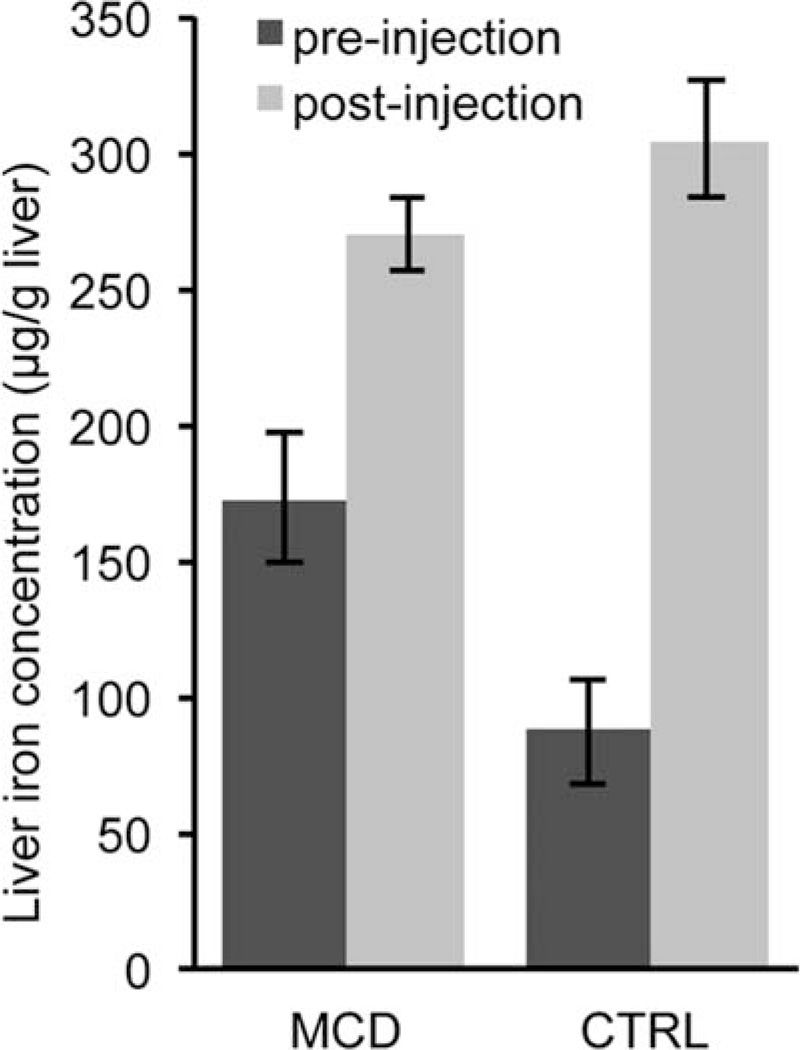
We used IF, TEM, and ICP-OES to investigate the mechanism of CF-labeling in MCD-fed and control rats. There were distinct differences in the spatial distribution of intravenously delivered CF between the livers of healthy rats and rats fed with the MCD diet, as observed with IF microscopy. Reduced ferritin IF in the livers from rats fed with the MCD diet compared to controls suggested reduced CF-labeling with NASH (Fig. 7b). The redistribution of fibronectin IF suggests thickening of the ECM and tissue displacement by lipid droplets. With TEM we observed CF in the perisinusoidal ECM in livers of both control and MCD-fed rats (Fig. 8e,f). While it was difficult to quantify CF content using TEM due to the limited field of view, in the sections we examined there was less CF bound in the perisinusoidal space of livers from MCD-fed rats. We also observed lipid droplets displacing the hepatic parenchyma in livers from rats fed with the MCD diet (Fig. 7a,b and Fig. 8b). TEM revealed wide (~150 nm) fenestrations in the healthy endothelium (Fig. 8e). In contrast, endothelia of livers from rats fed with the MCD diet appear abutted against one other (Fig. 8f), suggesting reduced exposure of blood to the perisinusoidal space. This reduced exposure of the blood to the ECM may account for the decrease in CF uptake we observed in MRI, IF, and TEM. The reduced accumulation of CF in the livers of MCD-fed rats is further supported by liver iron concentration measurements made using ICP-OES (Fig. 9). Liver iron concentrations in MCD-fed rats increased 98 µg/g liver after injection of CF versus 217 µg/g liver in healthy rats. The increase in liver iron concentration after CF injection is exclusively due to the iron core of the accumulated CF. These data indicate that MCD-fed rats bind 55% less CF in the liver than their healthy counterparts.
FIG. 7.
Distinct differences in the spatial distribution of intravenously delivered CF are apparent between the livers of healthy rats and rats fed with the MCD diet (b,d), as observed with immuno-fluorescent microscopy. Reduced ferritin IF in the livers from rats fed the MCD diet compared to controls indicated reduced CF-labeling with NASH. The ECM (green) pattern in MCD livers appears redistributed compared to control livers due to thickening and displacement by lipid droplets (a,c). Tissue was collected from animals 3 h after CF administration. Cell nuclei are stained with 4’,6-diamidino-2-phenylin-dole and fluoresce blue. Scale bar = 20 µm.
FIG. 9.
Liver iron concentrations were measured by ICP-OES. Liver iron concentrations in MCD-fed rats increased 98 µg/g liver after injection of CF versus 217 µg/g liver in healthy rats. The increase in liver iron concentration after CF injection is exclusively due to the iron core of the accumulated CF. These data indicate that MCD-fed rats bind 55% less CF in the liver than their healthy counterparts. Pre-injection MCD n = 3, pre-injection CTRL n = 3, post-injection MCD n = 6, post-injection CTRL n = 6. Error bars equal ± the standard error of the mean.
Taken together, our data indicate that CF specifically labels the perisinusoidal ECM and that this labeling is detectable in vivo using MRI. The labeling of the perisinusoidal ECM was transient, peaking within 3 h of injection. There was reduced CF-labeling of the perisinusoidal ECM in rats fed with the MCD diet, as observed with in vivo and ex vivo MRI, IF, and TEM. ICP-OES indicated that the CF-labeling of the perisinusoidal space was 55% less in MCD-fed rats compared to their healthy counterparts. TEM suggested that circulatory access of CF to the perisinusoidal space is blocked in disease by abutted endothelia. We conclude that the reduced perisinusoidal labeling by CF is thus due to excessive ECM deposition and loss of endothelial fenestrations associated with the advancement of NASH.
DISCUSSION
This work demonstrates that cationic iron oxide nanoparticles (CF) may be used to target and detect the ECM of the hepatic sinusoid using MRI, and that the binding of cationic nanoparticles may be used to detect structural and functional changes in the hepatic sinusoid in a rat model of NASH.
It is likely that CF passes through the endothelial fenestrations of the normal hepatic sinusoid and binds to the perisinusoidal ECM through an electrostatic interaction between the cationic nanoparticles and the anionic proteoglycans that comprise the ECM. The binding of CF to the perisinusoidal ECM appears to be highly specific and transient (Fig. 2 and Fig. 3). IF microscopy suggests that the cationic nanoparticles used in this study are internalized into the liver parenchyma after 3 h.
One potential concern about the use of CF as a contrast agent is whether it is toxic in MRI-detectable doses. To address this, we have recently found that CF has minimal acute or chronic toxicity at these doses, measured by renal and hepatic enzyme markers and lymphocyte counts (35). In the future, the dose of CF used here may likely be reduced ~100-fold via modification of the metal core of the apoferritin protein to increase ferritin relaxivity (27,29,30).
We have shown that the amount of specific binding of CF to the perisinusoidal ECM is reduced in a rat model of NASH. This reduced binding of CF to the perisinusoidal ECM is observable with MRI (Figs. 5 and 6). NF was not delivered as a control probe in the NASH model because the mechanism of NF labeling of the liver is very different from that of CF. The labeling of the liver by NF is driven by uptake into endothelia and macrophages, as shown in healthy rats (Fig. 2). Thus while changes in NF uptake in the NASH model are potentially interesting, this would not address whether plasma access to the perisinusoidal space had been reduced.
One concern for in vivo imaging is the fact that the TE is on the order of the in the liver in the animals with NASH. This raises the possibility that CF-accumulation did occur but was not detected because of the reduced dynamic range of the measurement. This is not the case, however, because ex vivo imaging with a higher background and a greater range of TE values showed the same reduced CF-accumulation. The reduced accumulation of CF in the livers of MCD-fed rats was also confirmed with ICP-OES, which revealed 55% less iron added to the tissue after CF injection in MCD-fed rats compared to their healthy counterparts. Since the increase in liver iron concentration after CF injection is exclusively due to the iron core of the accumulated CF, these data indicate 55% less CF binding in MCD-fed rats.
The reduced binding of CF to the perisinusoidal ECM in rats fed with the MCD diet is likely caused by changes to the perisinusoidal ECM and loss of endothelial fenestrations (4–8). Changes to the structure of and macromolecular access to the perisinusoidal ECM were identified in our IF and TEM images, which show distinct differences in perisinusoidal fibronectin distribution and thickness (Fig. 7), reduced accumulation of CF in the perisinusoidal space (Figs. 7 and 8), and suggest a loss of endothelial fenestrations (Fig. 8). We propose that the deposition of scar tissue in the hepatic sinusoid and the loss of endothelial fenestrations blocks macromolecular access to the perisinusoidal space. Detecting the reduced accumulation of CF in the perisinusoidal space with MRI might therefore serve as a molecular imaging biomarker for changes in macromolecular access to the hepatic parenchyma in chronic liver disease.
CONCLUSION
The goal of this work was to establish a non-invasive, ECM-specific molecular imaging biomarker to detect NASH-related changes in macromolecular access to the hepatic parenchyma. We have shown that intravenous injection of CF allows for MRI detection of the perisinusoidal ECM through accumulation of the particles in the ECM. Furthermore, there is an MRI-detectable reduction in binding of CF to the perisinusoidal ECM in a rat model of NASH. The reduced binding of CF to the perisinusoidal ECM in the NASH model is likely caused by reduced macromolecular access to the perisinusoidal space due to fibrosis and loss of endothelial fenestrations. To our knowledge, this is the first report of an in vivo targeted imaging agent that is sensitive to NASH-related changes in macromolecular access to the perisinusoidal space. The reduced, transient accumulation of intravenously injected cationic nanoparticles may report on changes in macromolecular access to the liver parenchyma in chronic liver diseases such as NASH.
ACKNOWLEDGMENTS
The authors gratefully acknowledge D. Lowry and the EM Laboratory at Arizona State University for assistance with electron microscopy and Dr. J. Rakela at the Mayo Clinic, Scottsdale for stimulating conversation.
Grant sponsor: American Heart Association; Grant number: 12BGIA9840020; Grant sponsor: Arizona Biomedical Research Commission; Grant number: 1106.
REFERENCES
- 1.National Center for Health Statistics. Highlights and Detailed Tables—deaths: final Data for 2009. NVSR. 2011;60:1–90. [Google Scholar]
- 2.Erickson SK. Nonalcoholic fatty liver disease. J Lipid Res. 2008;50(Suppl):S412–S416. doi: 10.1194/jlr.R800089-JLR200. [DOI] [PMC free article] [PubMed] [Google Scholar]
- 3.Bataller R. Liver fibrosis. J Clin Invest. 2005;115:209–218. doi: 10.1172/JCI24282. [DOI] [PMC free article] [PubMed] [Google Scholar]
- 4.Lough J, Rosenthall L, Arzoumanian A, Goresky CA. Kupffer cell depletion associated with capillarization of liver sinusoids in carbon tetrachloride-induced rat liver cirrhosis. J Hepatol. 1987;5:190–198. doi: 10.1016/s0168-8278(87)80572-x. [DOI] [PubMed] [Google Scholar]
- 5.Martinez-Hernandez A, Amenta P. The extracellular matrix in hepatic regeneration. FASEB J. 1995;9:1401–1410. doi: 10.1096/fasebj.9.14.7589981. [DOI] [PubMed] [Google Scholar]
- 6.Friedman SL. Molecular regulation of hepatic fibrosis, an integrated cellular response to tissue injury. J Biol Chem. 2000;275:2247–2250. doi: 10.1074/jbc.275.4.2247. [DOI] [PubMed] [Google Scholar]
- 7.Iredale JP. Models of liver fibrosis: exploring the dynamic nature of inflammation and repair in a solid organ. J Clin Invest. 2007;117:539–548. doi: 10.1172/JCI30542. [DOI] [PMC free article] [PubMed] [Google Scholar]
- 8.Farrell GC, Teoh NC, Mccuskey RS. Hepatic microcirculation in fatty liver disease. Anat Rec (Hoboken) 2008;291:684–692. doi: 10.1002/ar.20715. [DOI] [PubMed] [Google Scholar]
- 9.Wisse E. An electron microscopic study of the fenestrated endothelial lining of rat liver sinusoids. J Ultrastruct Res. 1970;31:125–150. doi: 10.1016/s0022-5320(70)90150-4. [DOI] [PubMed] [Google Scholar]
- 10.Bedossa P, Paradis V. Liver extracellular matrix in health and disease. J Pathol. 2003;200:504–515. doi: 10.1002/path.1397. [DOI] [PubMed] [Google Scholar]
- 11.Teramoto K, Bowers J, Khettry U, Palombo JD, Clouse ME. A rat fatty liver-transplant model. Transplantation. 1993;55:737–741. doi: 10.1097/00007890-199304000-00010. [DOI] [PubMed] [Google Scholar]
- 12.George J, Perra N, Phung N, Leclercq I, Hou JY, Farrell G. Lipid peroxidation, stellate cell activation and hepatic fibrogenesis in a rat model of chronic steatohepatitis. J Hepatol. 2003;39:756–764. doi: 10.1016/s0168-8278(03)00376-3. [DOI] [PubMed] [Google Scholar]
- 13.Rinella ME, Elias MS, Smolak RR, Fu T, Borensztajn J, Green RM. Mechanisms of hepatic steatosis in mice fed a lipogenic methionine choline-deficient diet. J Lipid Res. 2008;49:1068–1076. doi: 10.1194/jlr.M800042-JLR200. [DOI] [PMC free article] [PubMed] [Google Scholar]
- 14.McCuskey RS, Ito Y, Robertson GR, McCuskey MK, Perry M, Farrell GC. Hepatic microvascular dysfunction during evolution of dietary steatohepatitis in mice. Hepatology. 2004;40:386–393. doi: 10.1002/hep.20302. [DOI] [PubMed] [Google Scholar]
- 15.Siddique I, El-Naga HA, Madda JP, Memon A, Hassan F. Sampling variability on percutaneous liver biopsy in patients with chronic hepatitis C virus infection. Scand J Gastroenterol. 2003;38:427–432. doi: 10.1080/00365520310000825. [DOI] [PubMed] [Google Scholar]
- 16.Bedossa P, Dargère D, Paradis V. Sampling variability of liver fibrosis in chronic hepatitis C. Hepatology. 2003;38:1449–1457. doi: 10.1016/j.hep.2003.09.022. [DOI] [PubMed] [Google Scholar]
- 17.Thampanitchawong P, Piratvisuth T. Liver biopsy: complications and risk factors. World J Gastroenterol. 1999;5:301–304. doi: 10.3748/wjg.v5.i4.301. [DOI] [PMC free article] [PubMed] [Google Scholar]
- 18.Ophir J, Céspedes I, Ponnekanti H, Yazdi Y, Li X. Elastography: a quantitative method for imaging the elasticity of biological tissues. Ultrason Imaging. 1991;13:111–134. doi: 10.1177/016173469101300201. [DOI] [PubMed] [Google Scholar]
- 19.Yeh WC, Li PC, Jeng YM, Hsu HC, Kuo PO, Li ML, Yang PM, Lee PH. Elastic modulus measurements of human liver and correlation with pathology. Ultrasound Med Biol. 2002;28:467–474. doi: 10.1016/s0301-5629(02)00489-1. [DOI] [PubMed] [Google Scholar]
- 20.Sandrin L, Fourquet B, Hasquenoph JM, et al. Transient elastography: a new noninvasive method for assessment of hepatic fibrosis. Ultrasound Med Biol. 2003;29:1705–1713. doi: 10.1016/j.ultrasmedbio.2003.07.001. [DOI] [PubMed] [Google Scholar]
- 21.Muthupillai R, Lomas DJ, Rossman PJ, Greenleaf JF, Manduca A, Ehman RL. Magnetic resonance elastography by direct visualization of propagating acoustic strain waves. Science. 1995;269:1854–1857. doi: 10.1126/science.7569924. [DOI] [PubMed] [Google Scholar]
- 22.Manduca A, Oliphant TE, Dresner MA, Maholwald JL, Kruse SA, Amromin E, Felmlee JF, Ehman RL. Magnetic resonance elastogra-phy: non-invasive mapping of tissue elasticity. Med Image Anal. 2001;5:237–254. doi: 10.1016/s1361-8415(00)00039-6. [DOI] [PubMed] [Google Scholar]
- 23.Huwart L, Peeters F, Sinkus R, Annet L, Salameh N, ter Beek LC, Horsmans Y, Van Beers BE. Liver fibrosis: non-invasive assessment with MR elastography. NMR Biomed. 2006;19:173–179. doi: 10.1002/nbm.1030. [DOI] [PubMed] [Google Scholar]
- 24.Zhang S, Merritt M, Woessner D, Lenkinski RE, Sherry DA. PARAC-EST agents: Modulating MRI contrast via water proton exchange. Acc Chem Res. 2003;36:783–790. doi: 10.1021/ar020228m. [DOI] [PubMed] [Google Scholar]
- 25.Geninatti Crich S, Barge A, Battistini E, Cabella C, Coluccia S, Longo D, Mainero V, Tarone G, Aime S. Magnetic resonance imaging visualization of targeted cells by the internalization of supramolecular adducts formed between avidin and biotinylated Gd3+ chelates. J Biol Inorg Chem. 2005;10:78–86. doi: 10.1007/s00775-004-0616-2. [DOI] [PubMed] [Google Scholar]
- 26.Cormode DP, Jarzyna PA, Mulder WJM, Fayad ZA. Modified natural nanoparticles as contrast agents for medical imaging. Adv Drug Deliv Rev. 2010;62:329–338. doi: 10.1016/j.addr.2009.11.005. [DOI] [PMC free article] [PubMed] [Google Scholar]
- 27.Bulte JWM, Douglas T, Mann S, Vymazal J, Laughlin PG, Frank JA. Initial assessment of magnetoferritin biokinetics and proton relaxation enhancement in rats. Acad Radiol. 1995;2:871–878. doi: 10.1016/s1076-6332(05)80064-9. [DOI] [PubMed] [Google Scholar]
- 28.Bennett KM, Shapiro EM, Sotak CH, Koretsky AP. Controlled aggregation of ferritin to modulate MRI relaxivity. Biophys J. 2008;95:342–351. doi: 10.1529/biophysj.107.116145. [DOI] [PMC free article] [PubMed] [Google Scholar]
- 29.Uchida M, Terashima M, Cunningham CH, et al. A human ferritin iron oxide nano-composite magnetic resonance contrast agent. Magn Reson Med. 2008;60:1073–1081. doi: 10.1002/mrm.21761. [DOI] [PubMed] [Google Scholar]
- 30.Clavijo Jordan V, Caplan MR, Bennett KM. Simplified synthesis and relaxometry of magnetoferritin for magnetic resonance imaging. Magn Reson Med. 2010;64:260–1266. doi: 10.1002/mrm.22526. [DOI] [PubMed] [Google Scholar]
- 31.Bennett KM, Zhou H, Sumner JP, Dodd SJ, Bouraoud N, Doi K, Star RA, Koretsky AP. MRI of the basement membrane using charged nanoparticles as contrast agents. Magn Reson Med. 2008;60:564–574. doi: 10.1002/mrm.21684. [DOI] [PMC free article] [PubMed] [Google Scholar]
- 32.Beeman SC, Zhang M, Gubhaju L, Wu T, Bertram JF, Frakes DH, Cherry BR, Bennett KM. Measuring glomerular number and size in perfused kidneys using MRI. Am J Physiol Renal Physiol. 2011;300:1454–1457. doi: 10.1152/ajprenal.00044.2011. [DOI] [PubMed] [Google Scholar]
- 33.Heilmann M, Neudecker S, Wolf I, Gubhaju L, Sticht C, Schock-Kusch D, Kriz W, Bertram JF, Schad LR, Gretz N. Quantification of glomerular number and size distribution in normal rat kidneys using magnetic resonance imaging. Nephrol Dial Transplant. 2012;27:100–107. doi: 10.1093/ndt/gfr273. [DOI] [PubMed] [Google Scholar]
- 34.Danon D, Goldstein L, Marikovsky Y, Skutelsky E. Use of cationized ferritin as a label of negative charges on cell surfaces. J Ultrastruct Res. 1972;38:500–510. doi: 10.1016/0022-5320(72)90087-1. [DOI] [PubMed] [Google Scholar]
- 35.Beeman SC, Georges JF, Bennett KM. Toxicity, biodistribution, and ex vivo MRI detection of intravenously injected cationized ferritin. Magn Reson Med. 2013;69:853–861. doi: 10.1002/mrm.24301. [DOI] [PubMed] [Google Scholar]


