

Abstract
Objective
A subset analysis of the randomised, phase 3, MDS-004 study to evaluate outcomes in patients with International Prognostic Scoring System (IPSS)-defined Low-/Intermediate (Int)-1-risk myelodysplastic syndromes (MDS) with isolated del(5q).
Methods
Patients received lenalidomide 10 mg/d (days 1–21; n = 47) or 5 mg/d (days 1–28; n = 43) on 28-d cycles or placebo (n = 45). From the placebo and lenalidomide 5 mg groups, 84% and 58% of patients, respectively, crossed over to lenalidomide 5 or 10 mg at 16 wk, respectively.
Results
Rates of red blood cell-transfusion independence (RBC-TI) ≥182 d were higher in the lenalidomide 10 mg (57.4%; P < 0.0001) and 5 mg (37.2%; P = 0.0001) groups vs. placebo (2.2%). Cytogenetic response rates (major + minor responses) were 56.8% (P < 0.0001), 23.1% (P = 0.0299) and 0%, respectively. Two-year cumulative risk of acute myeloid leukaemia progression was 12.6%, 17.4% and 16.7% in the lenalidomide 10 mg, 5 mg, and placebo groups, respectively. In a 6-month landmark analysis, overall survival was longer in lenalidomide-treated patients with RBC-TI ≥182 d vs. non-responders (P = 0.0072). The most common grade 3–4 adverse event was myelosuppression.
Conclusions
These data support the clinical benefits and acceptable safety profile of lenalidomide in transfusion-dependent patients with IPSS-defined Low-/Int-1-risk MDS with isolated del(5q).
Keywords: acute myeloid leukaemia, del(5q), lenalidomide, myelodysplastic syndromes, transfusion independence
Deletions of the long arm of chromosome 5 [del(5q)] are present in approximately 10–15% of patients with primary myelodysplastic syndromes (MDS) 1,2, and del(5q) is one of the most frequently occurring cytogenetic aberrations in MDS 1–4. In approximately 80% of the patients with International Prognostic Scoring System (IPSS)-defined Low- or Intermediate (Int)-1-risk disease who present with the del(5q) abnormality, del(5q) is the only cytogenetic abnormality [isolated del(5q)] 5,6. MDS with isolated del(5q) and <5% bone marrow blasts are considered a distinct clinical entity in the World Health Organization classification system 7 and are characterised by a favourable prognosis 1,3,4,8–10. However, most patients with MDS and del(5q) eventually require red blood cell (RBC) transfusions 11, and RBC-transfusion dependence has been linked to poor prognosis in these patients 5.
In the phase 3, randomised, double-blind, placebo-controlled, multicentre study MDS-004, the efficacy and safety of lenalidomide were assessed in RBC-transfusion-dependent patients with IPSS-defined Low- or Int-1-risk MDS and del(5q), with or without additional cytogenetic abnormalities 12. Results of the primary study have been previously reported 12.
Lenalidomide was recently approved in the European Union for the treatment of patients with transfusion-dependent anaemia because IPSS-defined Low- or Int-1-risk MDS associated with an isolated del(5q) cytogenetic abnormality, when other therapeutic options are insufficient or inadequate. This post hoc analysis evaluated treatment responses, acute myeloid leukaemia (AML) progression, overall survival (OS) and adverse events in a subset of patients from the MDS-004 study who had isolated del(5q) [defined].
Methods
This retrospective subset analysis of the MDS-004, phase 3, randomised, double-blind, placebo-controlled trial analysed patients with RBC-transfusion-dependent, IPSS-defined Low- or Int-1-risk MDS with isolated del(5q). Full methodology for the MDS-004 study has been described previously 12. Briefly, transfusion dependence was defined as no period of eight consecutive weeks without RBC transfusions within 16 wk before randomisation. Risk was assessed according to the IPSS. Bone marrow pathology and del(5q) status were confirmed by central haematological and cytogenetic review after randomisation. Patients were excluded if they had any of the following: proliferative (white blood cell count ≥12 000/μL) chronic myelomonocytic leukaemia; grade ≥2 neuropathy; prior use of lenalidomide; prior use of recombinant erythropoietin, chemotherapy or treatment with any other investigational agent within the past 28-d or long-acting erythropoiesis-stimulating agents within the past 8 wk; or abnormal laboratory values (absolute neutrophil count <500/μL, platelet count <25 000/μL, serum creatinine >2.0 mg/dL, serum transaminases >3.0 × upper limit of normal and serum total bilirubin >1.5 mg/dL). All patients provided written informed consent. The study was approved by individual Institutional Review Boards at participating treatment centres and was conducted according to the Declaration of Helsinki.
Treatment in the double-blind and open-label extension phases
Patients were randomised 1 : 1 : 1 to oral lenalidomide 10 mg on days 1–21 or lenalidomide 5 mg on days 1–28 of each 28-d cycle or placebo. Erythroid response was assessed at 16 wk. Patients with at least a minor erythroid response continued double-blind treatment for up to 52 wk or until relapse, disease progression or unacceptable toxicity. Patients who completed the 52-wk-double-blind treatment phase without disease progression or erythroid relapse were unblinded and continued study treatment in the open-label extension phase at their current dose. Patients who did not achieve at least a minor erythroid response discontinued double-blind treatment and entered the open-label extension phase or were withdrawn from the study. Patients without a minor erythroid response or erythroid relapse in the placebo group were eligible to receive lenalidomide 5 mg in the open-label extension phase; those in the lenalidomide 5 mg group could receive lenalidomide 10 mg; and those in the 10 mg group were withdrawn from the study. Patients received a maximum of 156 wk of total study treatment. Use of granulocyte colony-stimulating factor and granulocyte-macrophage colony-stimulating factors was allowed for treatment of neutropenia. Thromboprophylaxis was not mandated.
Study endpoints and statistical methods
The primary endpoint of the study was RBC-transfusion independence (RBC-TI) ≥182 d. Secondary endpoints included duration of RBC-TI ≥182 d, time to RBC-TI ≥182 d, cytogenetic response, OS, AML progression and safety. Change in haemoglobin level from baseline was also assessed.
The Kaplan–Meier method was used to analyse duration of RBC-TI, and data are included until the last date with available information on transfusions. For patients who lost RBC-TI response, duration of RBC-TI was defined as the time between last transfusion before the start of the transfusion-independent period or the first dose of study drug (whichever occurred later) and the first transfusion after the transfusion-independent period; this loss of RBC-TI response was counted as an ‘event’ in statistical analyses of time-to-event variables. For patients who remained RBC-transfusion independent, the duration of RBC-TI was calculated as the time between last transfusion before the start of the transfusion-independent period or the first dose of study drug (whichever occurred later) and the last data collection date on RBC transfusion; this was censored in time to event analyses.
Cytogenetic response reflects best postbaseline response, assessed using International Working Group 2000 criteria 13 and based on karyotyping results (≥20 metaphases) and fluorescence in situ hybridisation. Time to AML progression and death was calculated from the time of randomisation; AML was diagnosed according to the French-American-British criteria 14, and time to death was calculated as time to death from any cause. Adverse events were coded using Medical Dictionary for Regulatory Activities version 13.0 and graded according to the National Cancer Institute Common Terminology Criteria for Adverse Events, version 3.0. Safety and efficacy were evaluated throughout the study, and bone marrow aspirates and cytogenetic assessments to monitor disease progression were performed at baseline, 12 and 24 wk and every 24 wk thereafter. Bone marrow aspirates were submitted and assessed by central pathology and cytogenetics review. Descriptive statistics were used to compare the lenalidomide 10 and 5 mg groups separately against placebo. Duration of response, AML progression and OS was characterised using Kaplan–Meier curves with differences evaluated by the log-rank test. Patients who discontinued the study for any reason were followed up for OS and progression to AML. To minimise bias, 6-month landmark analyses (excluding all early events that occurred in the first 6 months) were performed in patients randomised to lenalidomide to analyse AML progression and OS according to RBC-TI ≥182 d response (responders vs. non-responders) and cytogenetic response (responders vs. non-responders).
For patients assigned to lenalidomide treatment, univariate and multivariate logistic regression models were built to identify independent factors associated with RBC-TI ≥182 d response. Univariate and multivariate Cox proportional hazards models were built to identify independent factors associated with OS and time to AML progression. Firstly, univariate models were built to identify important independent variables associated with dependent outcome. Secondly, all significant variables identified by univariate analysis with P < 0.15 were used as initial variables in the multivariate models. Finally, a backward-elimination variable-selection approach was used to build the final multivariate models. The following baseline variables were evaluated: age (years), time since MDS diagnosis (years), RBC-transfusion burden (units/8 wk), bone marrow blast count (≥5% vs. <5%), number of cytopenias (2–3 vs. 1), platelet count (×109/L), absolute neutrophil count (×109/L), haemoglobin (g/dL), erythropoietin level (100 μU/mL), ferritin level (m), IPSS-defined risk (Int-2-risk vs. Low-/Int-1-risk) and treatment group (lenalidomide 10 mg vs. 5 mg).
Results
Patient baseline characteristics
Of the 205 patients randomised to treatment in the MDS-004 study, 135 (65.9%) had isolated del(5q) and were included in the intent-to-treat population for this analysis. A total of 47 patients were assigned to lenalidomide 10 mg, 43 to lenalidomide 5 mg and 45 to placebo. Baseline characteristics were well balanced across treatment groups (Table1). Median age was 69 yr (range 36–86), 75% of patients were female, and median time since diagnosis was 2.5 yr (range 0.2–29.2). Median haemoglobin level at baseline was 8.2 g/dL (range 5.6–11.2), and patients had a median RBC-transfusion burden of 6 units/8 wk (range 1–25). The median follow-up was 35.8 months.
Table 1.
Baseline characteristics of patients with isolated del(5q) (intent-to-treat population)
| Placebo (n = 45) | LEN 5 mg (n = 43) | LEN 10 mg (n = 47) | Total (n = 135) | |
|---|---|---|---|---|
| Age, median (range), years | 69 (39–85) | 66 (40–84) | 69 (36–86) | 69 (36–86) |
| Female gender, n (%) | 34 (75.6) | 30 (69.8) | 37 (78.7) | 101 (74.8) |
| Time since diagnosis, median (range), years | 2.1 (0.2–14.3) | 2.7 (0.6–13.2) | 2.5 (0.2–29.2) | 2.5 (0.2–29.2) |
| RBC-transfusion burden, median (range), units/8 wk | 6 (4–12) | 7 (1–25) | 6 (2–12) | 6 (1–25) |
| IPSS risk category (central review), n (%) | ||||
| Low | 29 (64.4) | 20 (46.5) | 20 (42.6) | 69 (51.1) |
| Intermediate-1 | 9 (20.0) | 16 (37.2) | 13 (27.7) | 38 (28.1) |
| Intermediate-2 | 1 (2.2) | 2 (4.7) | 1 (2.1) | 4 (3.0) |
| Missing | 6 (13.3) | 5 (11.6) | 13 (27.7) | 24 (17.8) |
| French-American-British classification (central review), n (%) | ||||
| Refractory anaemia | 25 (55.6) | 24 (55.8) | 23 (48.9) | 72 (53.3) |
| Refractory anaemia with ringed sideroblasts | 6 (13.3) | 4 (9.3) | 5 (10.6) | 15 (11.1) |
| Refractory anaemia with excess of blasts | 3 (6.7) | 8 (18.6) | 6 (12.8) | 17 (12.6) |
| Refractory anaemia with excess of blasts in transformation | 1 (2.2) | 0 | 0 | 1 (0.7) |
| Chronic myelomonocytic leukaemia | 1 (2.2) | 1 (2.3) | 0 | 2 (1.5) |
| Specimen not adequate | 6 (13.3) | 4 (9.3) | 12 (25.5) | 22 (16.3) |
| Other or missing | 3 (6.7) | 2 (4.7) | 1 (2.1) | 6 (4.4) |
| Prior erythropoietin use, n (%) | 24 (53.3) | 22 (51.2) | 28 (59.6) | 74 (54.8) |
| Absolute neutrophil count, median (range), ×109/L | 2.7 (0.5–7.6) | 1.8 (0.5–16.0) | 2.1 (0.5–10.7) | 2.1 (0.5–16.0) |
| Platelet count, median (range) ×109/L | 291.0 (38.0–721.0) | 210.0 (33.0–1321.0) | 266.0 (14.0–579.0) | 253.0 (14.0–1321.0) |
| Haemoglobin, median (range), g/dL | 8.1 (5.6–10.5) | 7.9 (5.7–10.9) | 8.4 (6.2–11.2) | 8.2 (5.6–11.2) |
| Bone marrow blast count, n (%) | ||||
| <5% | 32 (71.1) | 28 (65.1) | 27 (57.4) | 87 (64.4) |
| ≥5% | 2 (4.4) | 8 (18.6) | 6 (12.8) | 16 (11.9) |
| Missing | 11 (24.4) | 7 (16.3) | 14 (29.8) | 32 (23.7) |
IPSS, International Prognostic Scoring System; LEN, lenalidomide; RBC, red blood cell.
RBC-transfusion independence and cytogenetic response
Rates of RBC-TI ≥182 d and cytogenetic response are presented in Table2. The proportion of patients achieving RBC-TI ≥182 d was significantly higher in those treated with lenalidomide 10 mg (57.4%; P < 0.0001) or lenalidomide 5 mg (37.2%; P = 0.0001) compared with placebo (2.2%). Among patients who achieved RBC-TI ≥182 d, median time to onset of response was 4.3 wk (range 0.3–14.7) in the lenalidomide 10 mg group and 4.2 wk (range 0.3–12.3) in the lenalidomide 5 mg group. Median duration of RBC-TI ≥182 d response was not reached (NR) in either lenalidomide group, but the lower boundary of the 95% confidence interval (CI) was 1.6 and 0.8 yr for lenalidomide 10 and 5 mg, respectively (log-rank test P = 0.8783). Of the patients who achieved RBC–TI ≥182 d and who were evaluable for cytogenetic response, 16 of 26 (61.5%) in the lenalidomide 10 mg group and three of 13 (23.1%) in the lenalidomide 5 mg group also achieved a major or minor cytogenetic response. Median duration of RBC-TI was similar in cytogenetic responders (major + minor response) and non-responders (NR vs. 2.0 yr, respectively; log-rank test P = 0.4975).
Table 2.
Response rates by randomised treatment group in patients with isolated del(5q) (intent-to-treat population)
| Response | Placebo (n = 45) | LEN 5 mg (n = 43) | LEN 10 mg (n = 47) |
|---|---|---|---|
| RBC-TI ≥182 d, n (%) | 1 (2.2) | 16 (37.2) | 27 (57.4) |
| Time to onset of RBC-TI ≥182 d, median (range) weeks | 0.3 (0.3–0.3) | 4.2 (0.3–12.3) | 4.3 (0.3–14.7) |
| Duration of RBC-TI ≥182 d, median (range), years | NR (NR–NR) | NR (0.8–NR) | NR (1.6–NR) |
| Cytogenetic response, n (%) | n = 26 | n = 26 | n = 37 |
| Major + minor response | 0 | 6 (23.1) | 21 (56.8) |
| Major response (no del[5q] detectable) | 0 | 3 (11.5) | 13 (35.1) |
| Minor response (≥50% reduction in del[5q] metaphases) | 0 | 3 (11.5) | 8 (21.6) |
LEN, lenalidomide; NR, not reached; RBC-TI, red blood cell-transfusion independence.
Responding patients only.
P = 0.0001 vs. placebo.
P < 0.0001 vs. placebo.
P = 0.0299 vs. placebo.
P < 0.0001 vs. placebo.
Mean change in haemoglobin level from baseline over time is shown for each treatment group in Fig.1. Haemoglobin levels increased in patients treated with lenalidomide and reached a plateau after approximately 6 months, which was maintained until at least month 13. In patients with RBC-TI ≥182 d, median maximum haemoglobin increases were 6.5 g/dL (range 2.0–8.7) and 5.4 g/dL (range 1.6–8.5) for the lenalidomide 10 and 5 mg groups, respectively.
Figure 1.
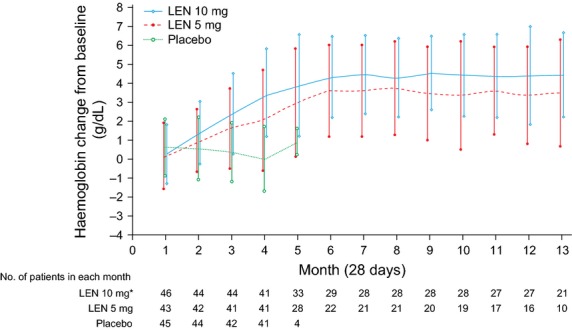
Mean change (±standard deviation) in haemoglobin levels from baseline over time by randomised treatment group in patients with isolated del(5q) (intent-to-treat population). *One of the 47 patients in the LEN 10 mg group was excluded due to lack of haemoglobin values at baseline and postbaseline. LEN, lenalidomide.
Cytogenetic response rates (major + minor responses) were significantly higher in the lenalidomide 10 mg (56.8%; P < 0.0001) and 5 mg (23.1%; P = 0.0299) groups compared with placebo (0%; Table2). Among these patients, 16 of 21 (76.2%) in the lenalidomide 10 mg group and three of six (50.0%) in the lenalidomide 5 mg group also achieved RBC-TI ≥182 d. Of the patients who achieved a major cytogenetic response (lenalidomide 10 and 5 mg groups combined), 11 of 16 (68.8%) also achieved RBC-TI ≥182 d.
Acute myeloid leukaemia progression
Progression to AML by randomised treatment group is presented in Fig.2A. The estimated 2–year cumulative risk of progression to AML was 12.6% (95%CI: 5.4–27.7), 17.4% (95%CI: 8.7–33.3) and 16.7% (95%CI: 8.3–32.0) in the lenalidomide 10 mg, lenalidomide 5 mg and placebo groups, respectively. The estimated 4-yr cumulative risk of progression to AML was 30.6% (95%CI: 18.1–48.8), 35.4% (95%CI: 21.4–54.6) and 43.3% (95%CI: 27.6–63.1) in the lenalidomide 10 mg, lenalidomide 5 mg and placebo groups, respectively. Of the seven patients randomised to placebo, who did not cross over to receive lenalidomide 5 mg in the open-label extension phase, 3 (42.9%) progressed to AML.
Figure 2.
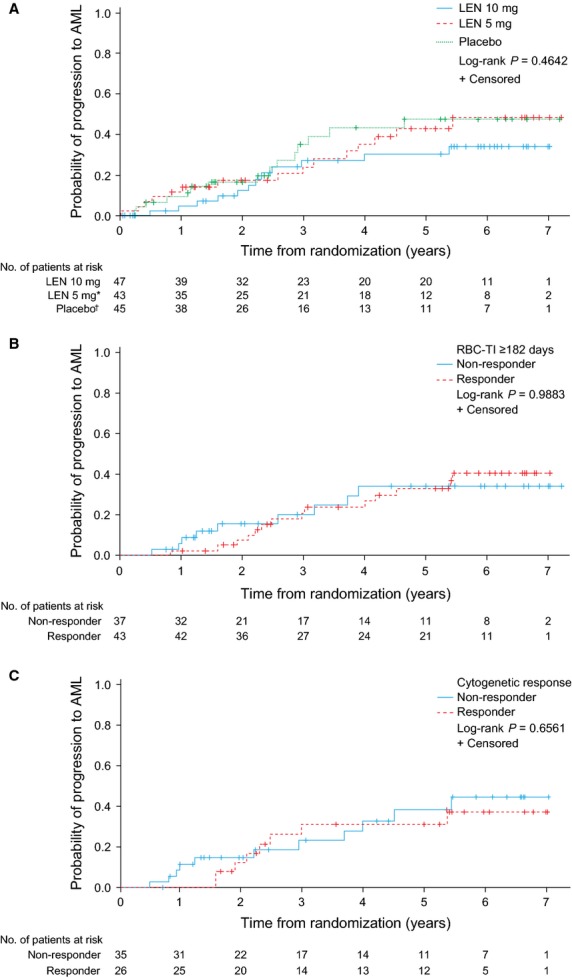
Progression to AML in patients with isolated del(5q) (intent-to-treat population) by: (A) randomised treatment group; (B) 6-month landmark analysis according to RBC-TI ≥182 d; and (C) cytogenetic response (major + minor response). *Of the 43 patients randomised to LEN 5 mg, 25 crossed over to LEN 10 mg in the open-label extension phase. †Of the 45 patients randomised to placebo, 38 crossed over to LEN 5 mg in the open-label extension phase. AML, acute myeloid leukaemia; LEN, lenalidomide; RBC-TI, red blood cell-transfusion independence.
In a 6-month landmark analysis, probability of AML progression was not significantly different between RBC-TI ≥182 d responders and non-responders (log-rank test P = 0.9883; Fig.2B), with 2-yr AML progression rates of 7.3% (95%CI: 2.4–21.1) and 15.5% (95%CI: 6.7–33.6), respectively. Patients who achieved a cytogenetic response (major + minor response) had similar probabilities of AML progression compared with non-responders (log-rank test P = 0.6561; Fig.2C), with 2-yr AML progression rates of 12.4% (95%CI: 4.2–33.7) and 14.8% (95%CI: 6.4–31.9), respectively.
Overall survival
Median OS was 4.0 yr (95%CI: 2.5–NR), 3.5 yr (95%CI: 1.7–4.8) and 2.9 yr (95%CI: 2.2–4.2) in the lenalidomide 10 mg, lenalidomide 5 mg and placebo groups, respectively (Fig.3A). Of the seven patients randomised to placebo who did not cross over to lenalidomide 5 mg, 6 (85.7%) died. In a 6-month landmark analysis, median OS was significantly longer in patients who achieved RBC-TI ≥182 d (5.7 yr; 95%CI: 3.2–NR) compared with non-responders (2.7 yr; 95%CI: 1.5–4.8; log-rank test P = 0.0072; Fig.3B). Median OS was similar in patients who achieved a major or minor cytogenetic response (4.3 yr; 95%CI: 2.3–NR) compared with non-responders (3.7 yr; 95%CI: 2.0–4.7; log-rank test P = 0.4073; Fig.3C).
Figure 3.
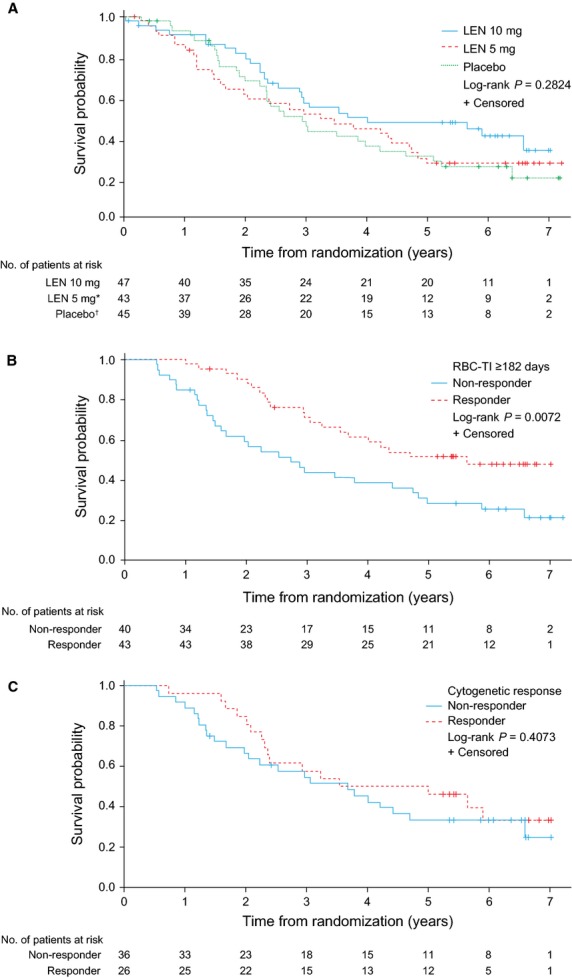
Overall survival in patients with isolated del(5q) (intent-to-treat population) by: (A) randomised treatment group; (B) 6-month landmark analysis according to RBC-TI ≥182 d; and (C) cytogenetic response (major + minor response). *Of the 43 patients randomised to LEN 5 mg, 25 crossed over to LEN 10 mg in the open-label extension phase. †Of the 45 patients randomised to placebo, 38 crossed over to LEN 5 mg in the open-label extension phase. LEN, lenalidomide; RBC-TI, red blood cell-transfusion independence.
Univariate and multivariate analyses
In the logistic regression analysis based on patients randomised to lenalidomide, patients in the lenalidomide 10 mg group were 2.36-times more likely to achieve RBC-TI ≥182 d than those in the lenalidomide 5 mg group (P = 0.0740; Table3). In univariate analysis, factors associated with a significant increase in the odds of achieving RBC-TI ≥182 d were lower RBC-transfusion burden [odds ratio (OR) 0.84; P = 0.0275] and higher platelet count (OR 1.00; P = 0.0244); these factors were no longer significant in the final multivariate logistic regression model after adjusting other factors. In the Cox proportional hazards models for OS and time to AML progression, baseline factors that negatively affected OS included advanced age [hazard ratio (HR) 1.03; P = 0.0369] and lower platelet count (HR 1.00; P = 0.0160) in the final multivariate model. Baseline factors that were significantly associated with an increased risk of progression to AML were higher RBC-transfusion burden (HR 1.12; P = 0.0180) and bone marrow blast count ≥5% (HR 2.73; P = 0.0323).
Table 3.
Logistic regression analysis for RBC-TI ≥182 d and Cox proportional hazards models for OS and time to AML progression in patients randomised to lenalidomide
| Baseline characteristic | Univariate model | Final multivariate model | ||||
|---|---|---|---|---|---|---|
| RBC-TI ≥182 d, OR (95% CI) | OS, HR (95% CI) | Time to AML progression, HR (95% CI) | RBC-TI ≥182 d, OR (95% CI) | OS, HR (95% CI) | Time to AML progression, HR (95% CI) | |
| Age (years) | 0.97 (0.93–1.01) P = 0.0885 | 1.03 (1.00–1.06) P = 0.0315 | 1.00 (0.97–1.04) P = 0.9860 | 0.96 (0.92–1.01) P = 0.0816 | 1.03 (1.00–1.06) P = 0.0369 | – |
| Time since MDS diagnosis (years) | 1.09 (0.95–1.24) P = 0.2143 | 1.01 (0.95–1.07) P = 0.7212 | 1.02 (0.93–1.11) P = 0.7245 | – | – | – |
| RBC-transfusion burden (units/8 wk) | 0.84 (0.72–0.98) P = 0.0275 | 1.08 (1.00–1.16) P = 0.0542 | 1.13 (1.03–1.24) P = 0.0068 | 0.90 (0.76–1.07) P = 0.2269 | – | 1.12 (1.02–1.24) P = 0.0180 |
| Bone marrow blast count (≥5% vs. <5%) | 0.83 (0.26–2.70) P = 0.7609 | 1.88 (0.94–3.74) P = 0.0730 | 2.36 (0.97–5.79) P = 0.0598 | – | – | 2.73 (1.09–6.84) P = 0.0323 |
| Number of cytopenias (2–3 vs. 1) | 1.16 (0.50–2.70) P = 0.7304 | 0.96 (0.56–1.66) P = 0.8888 | 1.22 (0.57–2.61) P = 0.6090 | – | – | – |
| Platelet count (×109/L) | 1.00 (1.00–1.01) P = 0.0244 | 1.00 (1.00–1.00) P = 0.0147 | 1.00 (1.00–1.00) P = 0.2447 | 1.00 (1.00–1.01) P = 0.1131 | 1.00 (1.00–1.00) P = 0.0160 | – |
| ANC (×109/L) | 1.01 (0.85–1.20) P = 0.9064 | 1.04 (0.95–1.14) P = 0.3615 | 1.01 (0.87–1.17) P = 0.9314 | – | – | – |
| Haemoglobin (g/dL) | 1.36 (0.91–2.03) P = 0.1355 | 0.96 (0.72–1.27) P = 0.7602 | 0.88 (0.59–1.32) P = 0.5495 | – | – | – |
| EPO level (100 μU/mL) | 0.99 (0.95–1.02) P = 0.3938 | 1.00 (0.98–1.02) P = 0.6675 | 1.00 (0.97–1.03) P = 0.8315 | – | – | – |
| Ferritin level (m) | 0.98 (0.96–1.00) P = 0.0789 | 1.02 (1.00–1.03) P = 0.0070 | 1.01 (1.00–1.03) P = 0.1020 | – | – | – |
| IPSS risk (Int-2-risk vs. Low-/Int-1-risk) | 1.94 (0.17–22.43) P = 0.5947 | 3.11 (0.94–10.34) P = 0.0640 | 3.86 (0.86–17.33) P = 0.0776 | – | – | – |
| Treatment group (lenalidomide 10 vs. 5 mg) | 2.28 (0.98–5.31) P = 0.0566 | 0.71 (0.42–1.20) P = 0.1995 | 0.68 (0.32–1.45) P = 0.3124 | 2.36 (0.92–6.05) P = 0.0740 | – | – |
AML, acute myeloid leukaemia; ANC, absolute neutrophil count; CI, confidence interval; EPO, erythropoietin; HR, hazard ratio; Int, Intermediate; IPSS, International Prognostic Scoring System; MDS, myelodysplastic syndromes; OR, odds ratio; OS, overall survival; RBC, red blood cell; RBC-TI, RBC-transfusion independence.
Bold indicates statistically significant variable (P < 0.05) in the final multivariate model.
Safety
Dose reductions due to adverse events were reported in 28 (59.6%) and 25 (58.1%) patients in the lenalidomide 10 and 5 mg groups, respectively. Adverse events led to study drug discontinuation in 3 (6.4%), 7 (16.3%) and 2 (4.4%) patients in the lenalidomide 10 mg, lenalidomide 5 mg and placebo groups, respectively.
The most common grade 3–4 adverse event in patients treated with lenalidomide was myelosuppression (Table4). Grade 3–4 neutropenia was reported in 35 (74.5%), 33 (76.7%) and 7 (15.6%) patients in the lenalidomide 10 mg, lenalidomide 5 mg and placebo groups, respectively, and thrombocytopenia in 18 (38.3%), 16 (37.2%) and 1 (2.2%) patients, respectively. Grade 3–4 deep vein thrombosis was reported in 3 (6.4%), 0 and 1 (2.2%) patients, respectively. Patients who developed deep vein thrombosis received antithrombotic agents. Haemorrhagic adverse events (any grade) were reported in 12 (25.5%), 9 (20.9%) and 7 (15.6%) patients in the lenalidomide 10 mg, lenalidomide 5 mg and placebo groups, respectively. Infection (any grade) was reported in 30 (63.8%), 25 (58.1%) and 13 (28.9%) patients in the lenalidomide 10 mg, lenalidomide 5 mg and placebo groups, respectively.
Table 4.
Grade 3–4 adverse events reported in ≥5% of patients with isolated del(5q) (intent-to-treat population)
| n (%) | Placebo (n = 45) | LEN 5 mg (n = 43) | LEN 10 mg (n = 47) |
|---|---|---|---|
| Patients with ≥1 event | 19 (42.2) | 40 (93.0) | 45 (95.7) |
| Neutropenia | 7 (15.6) | 33 (76.7) | 35 (74.5) |
| Thrombocytopenia | 1 (2.2) | 16 (37.2) | 18 (38.3) |
| Leukopenia | 0 | 5 (11.6) | 5 (10.6) |
| Anaemia | 3 (6.7) | 3 (7.0) | 2 (4.3) |
| Deep vein thrombosis | 1 (2.2) | 0 | 3 (6.4) |
LEN, lenalidomide.
Discussion
In this MDS-004 subset analysis of patients with isolated del(5q), lenalidomide 10 mg was associated with a rapid and sustained achievement of RBC-TI ≥182 d in 57% of patients. Lenalidomide treatment group (10 vs. 5 mg) was also associated with RBC-TI ≥182 d in the logistic regression analysis; patients in the lenalidomide 10 mg group were more likely to achieve RBC-TI ≥182 d.
Lenalidomide therapy was associated with cytogenetic response rates (major + minor responses) of 57% in the lenalidomide 10 mg group and 23% in the 5 mg group, with major cytogenetic response rates of 35% and 12%, respectively; no patients in the placebo group achieved cytogenetic response. In addition, cytogenetic response with lenalidomide was closely associated with RBC-TI; 76% of the cytogenetic responders in the lenalidomide 10 mg group and 50% in the lenalidomide 5 mg group also achieved RBC-TI ≥182 d. The cytogenetic response rates seen in the current analysis were lower than those reported in MDS patients with isolated del(5q) from the MDS-003 phase 2 trial (77%), when lenalidomide 10 mg was given on days 1–21 or 1–28 of each 28-d cycle 15. These findings suggest a possible dose–response relationship between the dose ranges studied for lenalidomide in terms of cytogenetic response. However, it should be noted that MDS-004 was not designed to detect differences between the lenalidomide dose groups.
Lenalidomide therapy did not appear to have an impact on progression to AML. However, the crossover design of the study limits the interpretation of the data for AML progression in the different treatment groups. Similar probabilities of AML progression were observed between patients achieving RBC-TI ≥182 d or cytogenetic response compared with non-responders. However, the power of statistical testing in this subset analysis was low due to the limited number of events and patients, which makes it difficult to reach statistical significance at the 5% significance level.
Median OS was 4.0, 3.5 and 2.9 yr for the lenalidomide 10 mg, lenalidomide 5 mg and placebo groups, respectively. Although not statistically significant, the difference in OS among the treatment groups was consistent with the patterns observed for cytogenetic response. The fact that a considerable proportion of the patients assigned to placebo (84%) subsequently received lenalidomide as part of the open-label extension phase may have contributed to a lack of significance being detected across treatment groups. In a study of untreated RBC-transfusion-dependent patients with IPSS-defined Low- or Int-1-risk MDS and del(5q), median OS was approximately 3.7 yr; 82% of the patients had isolated del(5q) 5. In the same study, RBC-transfusion dependency was associated with shorter OS (HR 2.260; P = 0.001) in a Cox proportional hazards model of MDS patients with isolated del(5q). In the current analysis, median OS was significantly longer in patients who achieved RBC-TI ≥182 d compared with non-responders. Although OS by cytogenetic response was not significantly different between responders and non-responders, this lack of significance may have been due to the limited number of events and patients in this subset analysis.
In the final multivariate analysis, younger age and higher platelet count were significantly associated with improved OS. In a separate Cox proportional regression model by Germing et al. 5 of untreated MDS patients with isolated del(5q) and bone marrow blast count <5%, advanced age was also identified as a significant factor for reduced OS (P < 0.001). Reduced platelet counts in patients with lower-risk MDS usually herald fibrosis, hypocellularity or more advanced disease with increases in bone marrow blasts. It is, therefore, understandable that patients with lower platelet counts have worse OS than those with the typical characteristics of the 5q− syndrome, such as normal to high platelet counts.
The incidence of adverse events appeared to be comparable for patients treated with lenalidomide 10 or 5 mg. The most common adverse events were neutropenia and thrombocytopenia, consistent with previous reports 15. Although lenalidomide dose reductions were relatively common, few patients discontinued treatment due to adverse events. In the MDS-003 study 15, the dosing schedule was amended from lenalidomide 10 mg daily to 10 mg for days 1–21 of each 28-d cycle in to reduce the number of adverse events, in particular grade 3–4 thrombocytopenia. Therefore, it is unlikely that lenalidomide dosage increases >10 mg/d would be implemented in future studies in an attempt to improve cytogenetic and RBC-TI responses.
In summary, these data support the clinical benefits of lenalidomide in the treatment of RBC-transfusion-dependent patients with IPSS-defined Low- or Int-1-risk MDS and isolated del(5q). Lenalidomide therapy was associated with a significant achievement of RBC-TI ≥182 d and cytogenetic response. Treatment with lenalidomide was associated with improved OS in RBC-TI ≥182 d responders compared with non-responders. The overall safety profile was well characterised and manageable.
Acknowledgments
The authors received editorial and writing support provided by Christian Geest, PhD, from Excerpta Medica, funded by Celgene Corporation. The authors had full access to the data and are fully responsible for content and editorial decisions for this manuscript.
Conflict of interest and sources of funding
Celgene Corporation provided funding for this study.
AG is a consultant for and has received honoraria from Celgene Corporation. GJM, MM, GS and EH-L are a consultant for and have received honoraria and research funding from Celgene Corporation. UP, DB and PF have received honoraria from Celgene Corporation. PM has been on the advisory boards of Alexion, Amgen and Opsona Therapeutics. DS is a consultant for and has received honoraria and research funding from Celgene Corporation, Novartis, Amgen and GSK. OB-R has received research funding from Celgene Corporation and Roche. PtB, LN, AG and GG have no disclosures. CdC is a consultant for and has received research funding from Celgene Corporation, Janssen-Cilag, Array and Novartis. AG-B is a consultant for Novartis and received honoraria from Celgene Corporation, BMS, Novartis and Amgen. ML is on the advisory board of Johnson & Johnson. BQ has received research funding from Celgene Corporation. BS is a consultant for Celgene Corporation. TF and BB are employees of and hold equity in Celgene Corporation.
References
- Bernasconi P, Klersy C, Boni M, et al. World Health Organization classification in combination with cytogenetic markers improves the prognostic stratification of patients with de novo primary myelodysplastic syndromes. Br J Haematol. 2007;137:193–205. doi: 10.1111/j.1365-2141.2007.06537.x. [DOI] [PubMed] [Google Scholar]
- Haase D, Germing U, Schanz J, et al. New insights into the prognostic impact of the karyotype in MDS and correlation with subtypes: evidence from a core dataset of 2124 patients. Blood. 2007;110:4385–95. doi: 10.1182/blood-2007-03-082404. [DOI] [PubMed] [Google Scholar]
- Schanz J, Tüchler H, Solé F, et al. New comprehensive cytogenetic scoring system for primary myelodysplastic syndromes (MDS) and oligoblastic acute myeloid leukemia after MDS derived from an international database merge. J Clin Oncol. 2012;30:820–9. doi: 10.1200/JCO.2011.35.6394. [DOI] [PMC free article] [PubMed] [Google Scholar]
- Solé F, Luño E, Sanzo C, et al. Identification of novel cytogenetic markers with prognostic significance in a series of 968 patients with primary myelodysplastic syndromes. Haematologica. 2005;90:1168–78. [PubMed] [Google Scholar]
- Germing U, Lauseker M, Hildebrandt B, et al. Survival, prognostic factors, and rates of leukemic transformation in 381 untreated patients with MDS and del(5q): a multicenter study. Leukemia. 2012;26:1286–92. doi: 10.1038/leu.2011.391. [DOI] [PubMed] [Google Scholar]
- Le Bras F, Sebert M, Kelaidi C, et al. Treatment by lenalidomide in lower risk myelodysplastic syndrome with 5q deletion–the GFM experience. Leuk Res. 2011;35:1444–8. doi: 10.1016/j.leukres.2011.05.034. [DOI] [PubMed] [Google Scholar]
- Vardiman JW, Thiele J, Arber DA, et al. The 2008 revision of the World Health Organization (WHO) classification of myeloid neoplasms and acute leukemia: rationale and important changes. Blood. 2009;114:937–51. doi: 10.1182/blood-2009-03-209262. [DOI] [PubMed] [Google Scholar]
- Greenberg P, Cox C, LeBeau MM, et al. International scoring system for evaluating prognosis in myelodysplastic syndromes. Blood. 1997;89:2079–88. [PubMed] [Google Scholar]
- Greenberg PL, Tuechler H, Schanz J, et al. Revised international prognostic scoring system for myelodysplastic syndromes. Blood. 2012;120:2454–65. doi: 10.1182/blood-2012-03-420489. [DOI] [PMC free article] [PubMed] [Google Scholar]
- Malcovati L, Germing U, Kuendgen A, et al. Time-dependent prognostic scoring system for predicting survival and leukemic evolution in myelodysplastic syndromes. J Clin Oncol. 2007;25:3503–10. doi: 10.1200/JCO.2006.08.5696. [DOI] [PubMed] [Google Scholar]
- Giagounidis AA, Germing U, Aul C. Biological and prognostic significance of chromosome 5q deletions in myeloid malignancies. Clin Cancer Res. 2006;12:5–10. doi: 10.1158/1078-0432.CCR-05-1437. [DOI] [PubMed] [Google Scholar]
- Fenaux P, Giagounidis A, Selleslag D, et al. A randomized phase 3 study of lenalidomide versus placebo in RBC transfusion-dependent patients with Low-/Intermediate-1-risk myelodysplastic syndromes with del5q. Blood. 2011;118:3765–76. doi: 10.1182/blood-2011-01-330126. [DOI] [PubMed] [Google Scholar]
- Cheson BD, Bennett JM, Kantarjian H, et al. Report of an international working group to standardize response criteria for myelodysplastic syndromes. Blood. 2000;96:3671–4. [PubMed] [Google Scholar]
- Bennett JM, Catovsky D, Daniel MT, Flandrin G, Galton DA, Gralnick HR, Sultan C. Proposals for the classification of the myelodysplastic syndromes. Br J Haematol. 1982;51:189–99. [PubMed] [Google Scholar]
- List A, Dewald G, Bennett J, et al. Lenalidomide in the myelodysplastic syndrome with chromosome 5q deletion. N Engl J Med. 2006;355:1456–65. doi: 10.1056/NEJMoa061292. [DOI] [PubMed] [Google Scholar]